. 2018;44(4):573-589.
doi: 10.1016/j.jglr.2018.05.012.

A Comparative Examination of Recent Changes in Nutrients and Lower Food Web Structure in Lake Michigan and Lake Huron

Affiliations

A Comparative Examination of Recent Changes in Nutrients and Lower Food Web Structure in Lake Michigan and Lake Huron

Richard P Barbiero et al. J Great Lakes Res. 2018.

Abstract

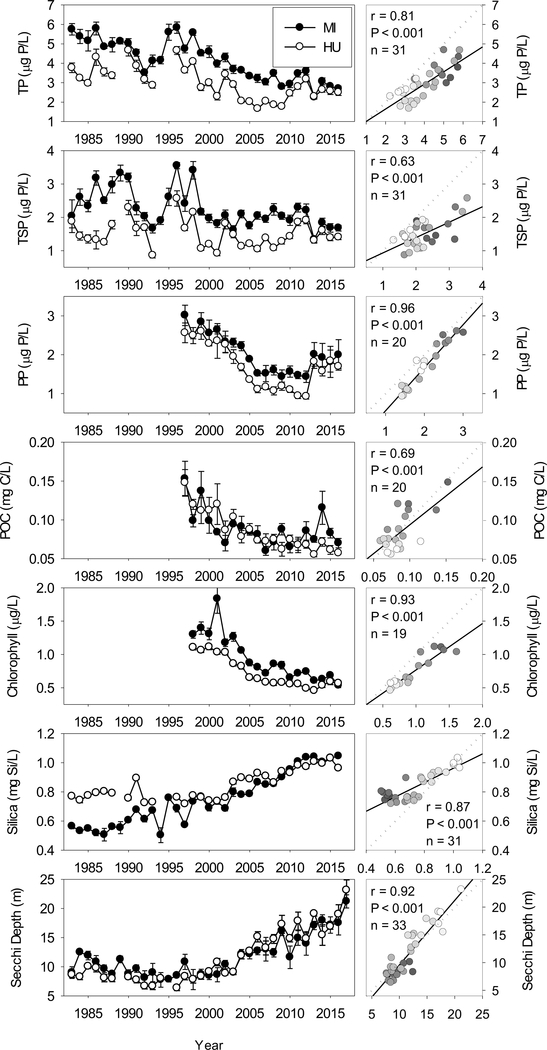
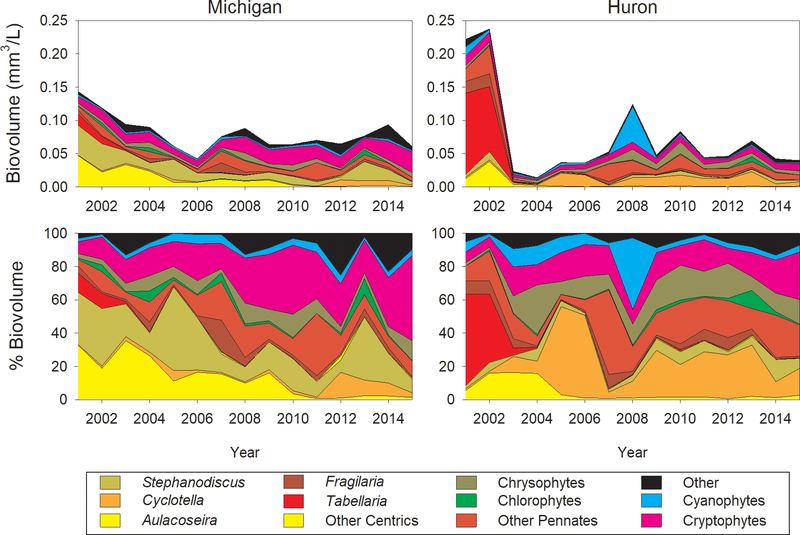
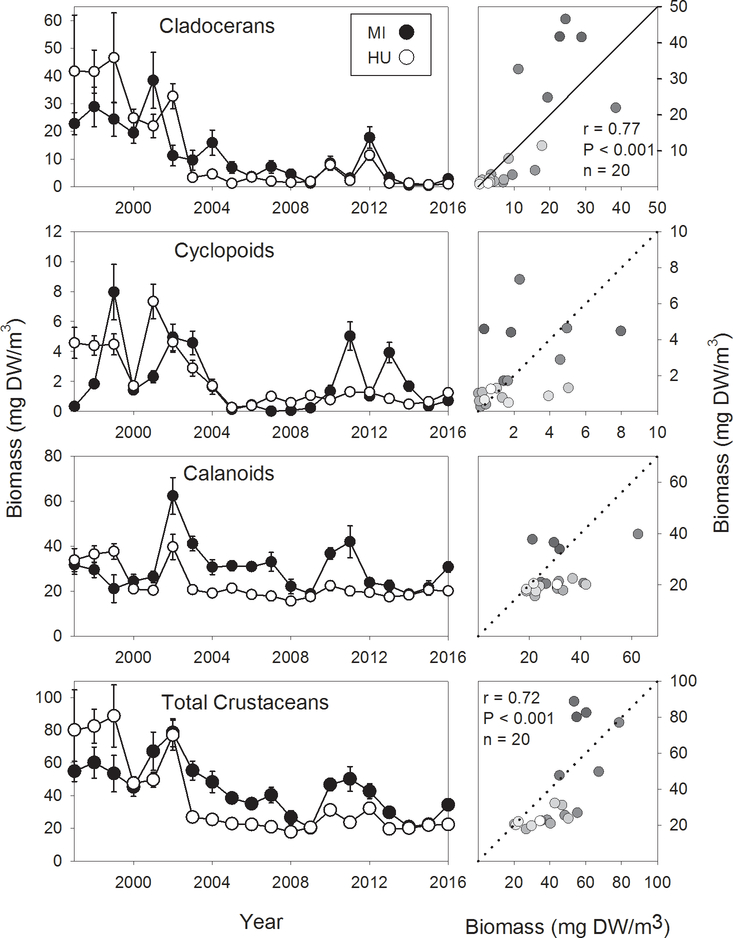
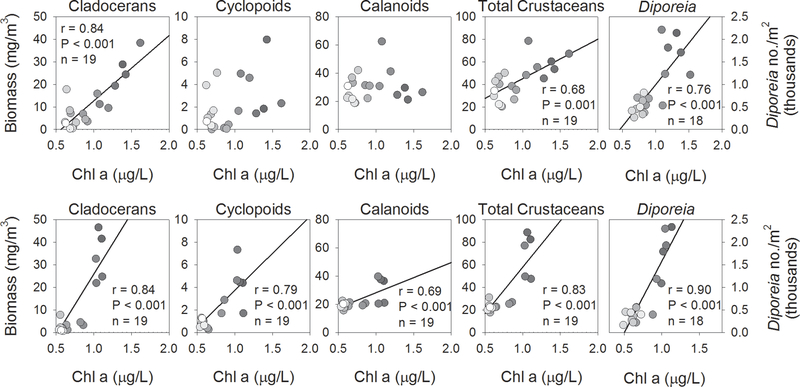
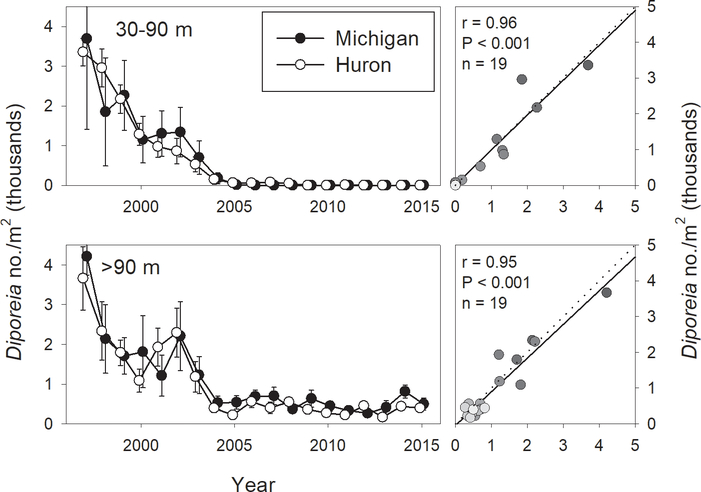
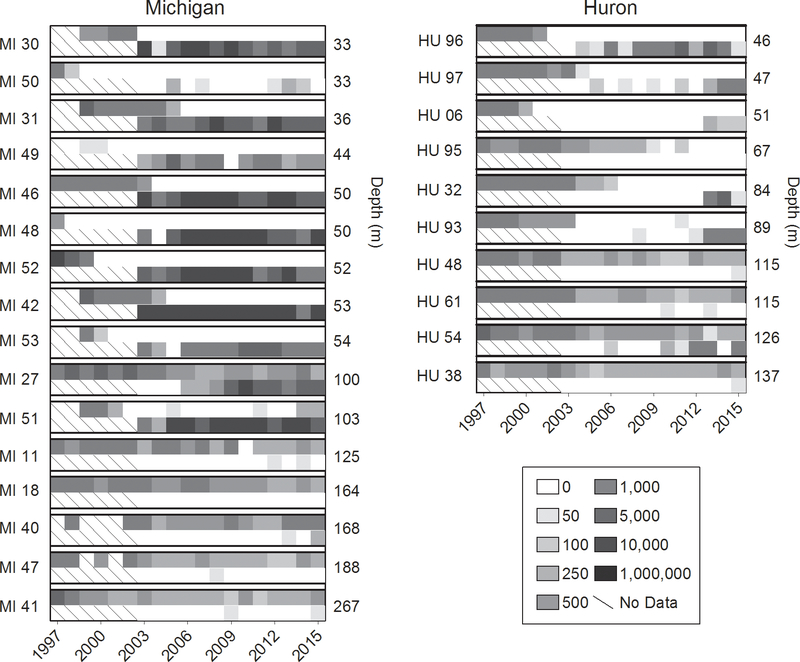
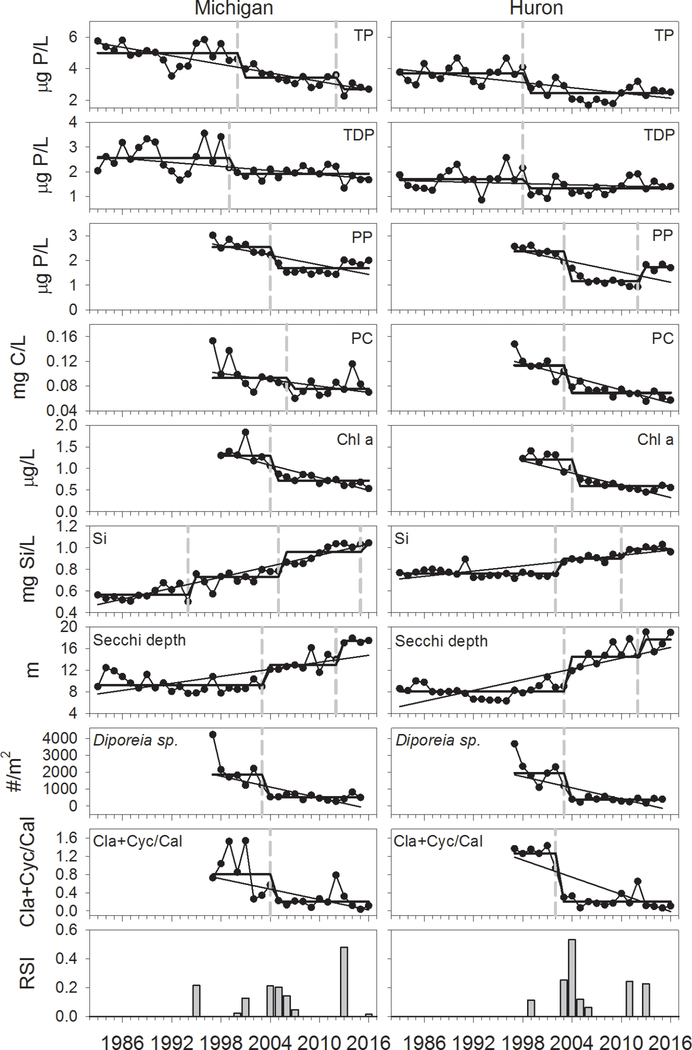
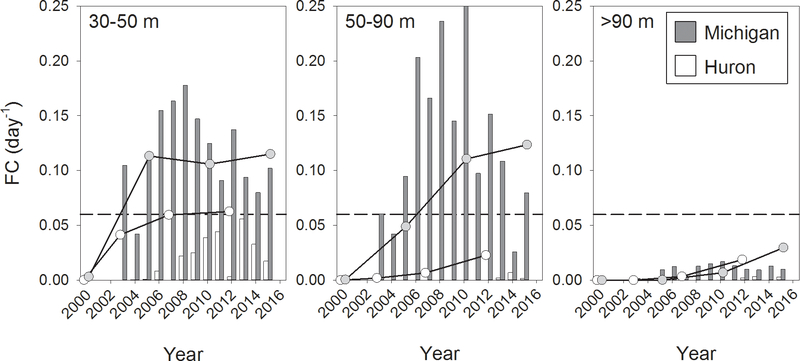
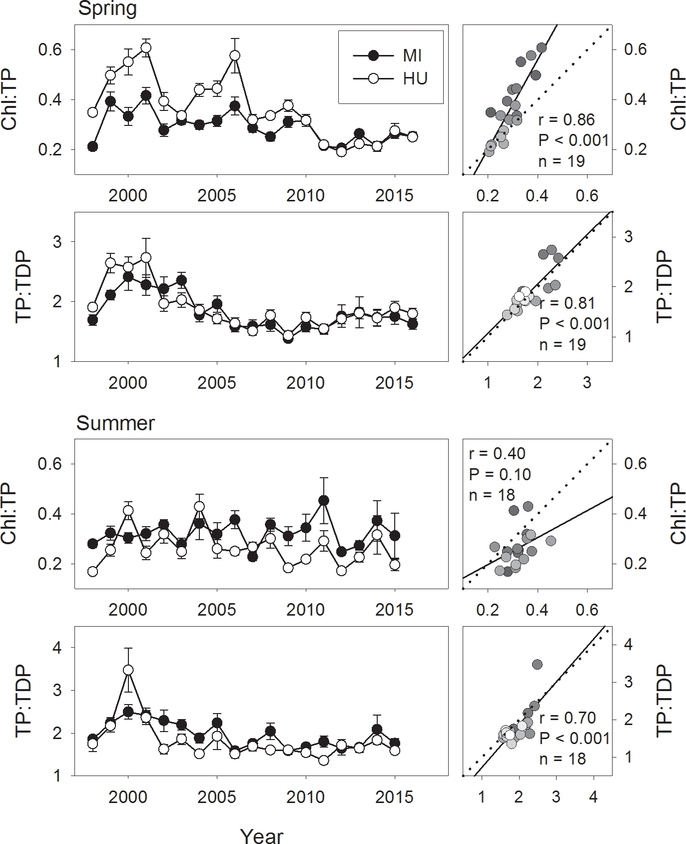
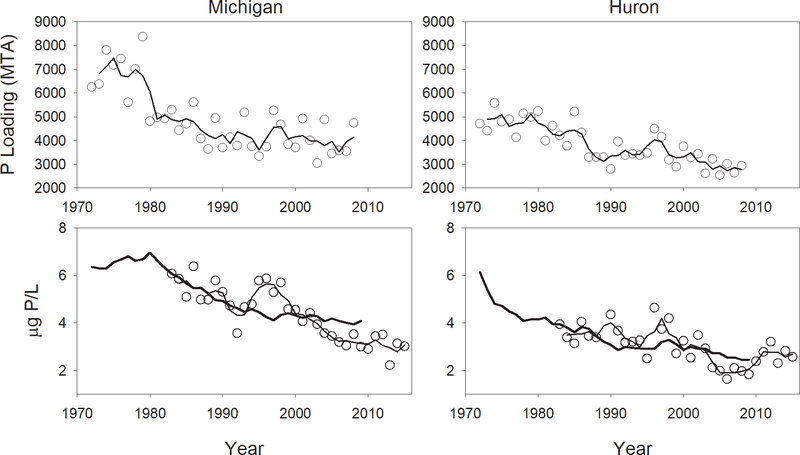
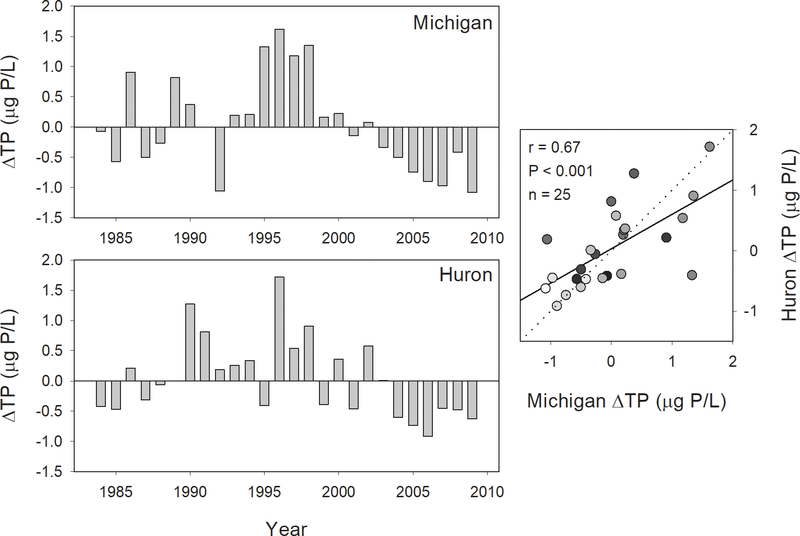
The lower food webs of Lake Huron and Lake Michigan have experienced similar reductions in the spring phytoplankton bloom and summer populations of Diporeia and cladocerans since the early 2000s. At the same time phosphorus concentrations have decreased and water clarity and silica concentrations have increased. Key periods of change, identified by using a method based on sequential t-tests, were 2003-2005 (Huron) and 2004-2006 (Michigan). Estimated filtration capacity suggests that dreissenid grazing would have been insufficient to directly impact phytoplankton in the deeper waters of either lake by this time (mid 2000s). Despite some evidence of decreased chlorophyll:TP ratios, consistent with grazing limitation of phytoplankton, the main impact of dreissenids on the offshore waters was probably remote, e.g., through interception of nutrients by nearshore populations. A mass balance model indicates that decreased phosphorus loading could not account for observed in-lake phosphorus declines. However, model-inferred internal phosphorus dynamics were strongly correlated between the lakes, with periods of increased internal loading in the 1990s, and increased phosphorus loss starting in 2000 in Lake Michigan and 2003 in Lake Huron, prior to dreissenid expansion into deep water of both lakes. This suggests a limited role for deep populations of dreissenids in the initial phosphorus declines in the lakes, and also suggests a role for meteorological influence on phosphorus dynamics. The high synchrony in lower trophic level changes between Lake Michigan and Lake Huron suggests that both lakes should be considered when investigating underlying causal factors of these changes.

Keywords: Diporeia; Lake Huron; Lake Michigan; chlorophyll; phosphorus; zooplankton.


Figures

Figure 1.
Figure 1.
Lake-wide average spring total phosphorus, total dissolved phosphorus, particulate phosphorus, particulate organic carbon, May chlorophyll a, spring soluble silica and spring Secchi depth for Lake Michigan and Lake Huron, 1983–2016. Bars indicate one standard error. Right hand plots show correlations of respective variables between Lake Michigan (x axis) and Lake Huron (y axis). Dotted line indicates 1:1 relationship; solid line indicates least-squares regression line, provided for reference. Gradation of symbol fills correspond to year, with lighter fills indicating more recent years. Correlation results are provided when significant (α = 0.05). Note that particulate phosphorus times series begins in 1996, chlorophyll a time series begins in 1998, Secchi depth time series extends to 2017.
Figure 2.
Figure 2.
Absolute and relative biovolume of spring (April) phytoplankton in Lake Michigan and Lake Huron, by dominant taxa and major taxonomic group, 2001–2015.
Figure 3.
Figure 3.
Summer (August) biomass of cladocerans, cyclopoids, calanoids, and total crustacean zooplankton for Lake Michigan and Lake Huron, 1997–2016. Right hand plots show correlations of respective variables between Lake Michigan (x axis) and Lake Huron (y axis). Dotted line indicates 1:1 relationship; solid line indicates least-squares regression line, provided for reference. Gradation of symbol fills correspond to year, with lighter fills indicating more recent years. Correlation results are provided when significant (α = 0.05).
Figure 4.
Figure 4.
Correlations between April-July chlorophyll a, estimated by remote sensing, and August zooplankton biomass, by major taxonomic group, and Diporeia from stations > 90 m, for Lake Michigan (top panels) and Lake Huron (bottom panels), 1997–2016. Statistical results are shown where correlations were significant (α = 0.05); solid line indicates least-squares regression line, provided for reference. Gradation of symbol fills correspond to year, with lighter fills indicating more recent years. Correlation results are provided when significant (α = 0.05).
Figure 5.
Figure 5.
Abundances of Diporeia in Lake Michigan and Lake Huron, 1997–2015, for 30–90 m and > 90 m. Right hand plots show correlations of respective variables between Lake Michigan (x axis) and Lake Huron (y axis). Dotted line indicates 1:1 relationship; solid line indicates least-squares regression line, provided for reference. Gradation of symbol fills correspond to year, with lighter fills indicating more recent years. Correlation results are provided when significant (α = 0.05).
Figure 6.
Figure 6.
Station-specific abundances (number/m2) of Diporeia (upper rows) and Dreissena (lower rows) in Lake Michigan and Lake Huron, 1997–2015. Hashes indicate no data. Station names are to the left of each plot, station depths to the right. Note that Dreissena was not enumerated in our samples until 2003.
Figure 7.
Figure 7.
Regime shift analysis of spring total phosphorus, total dissolved phosphorus, particulate phosphorus, particulate organic carbon, May chlorophyll a, spring soluble silica, spring Secchi depth, August profundal (> 90 m) Diporeia abundance, and ratio of August cladoceran and cyclopoid biomass to calanoid biomass for Lake Michigan and Lake Huron, 1983–2017. Dashed vertical lines indicate occurrences of shifts, straight lines indicate Sen-Thiel regressions, stepped lines indicate averages for each period. Bottom panel indicates regime shift values averaged across all variables.
Figure 8.
Figure 8.
Estimated fraction of water column cleared (FC) by Dreissena filtration in different depth zones of Lake Michigan and Lake Huron. Bars represent FC calculated from GLNPO data; lines represent FC estimated from more extensive NOAA/CSMI surveys. Dotted line corresponds to nominal average growth phytoplankton rate of 0.06 day−1 (Fahnenstiel et al., 2000). See text for details of calculations.
Figure 9.
Figure 9.
Spring (April) and summer (August) chlorophyll a:total phosphorus ratios and total phosphorus:total dissolved phosphorus ratios for Lake Michigan and Lake Huron, 1998–2016. Right hand plots show correlations of respective variables between Lake Michigan (x axis) and Lake Huron (y axis). Dotted line indicates 1:1 relationship; solid line indicates least-squares regression line, provided for reference. Gradation of symbol fills correspond to year, with lighter fills indicating more recent years. Correlation results are provided when significant (α = 0.05).
Figure 10.
Figure 10.
Upper panels: phosphorus loading into the main basins of Lake Michigan (left) and Lake Huron (right). Lines = 3 yr running average. Bottom panels: predicted in-lake TP based on loading (heavy lines), measured spring whole-lake averaged total phosphorus (symbols annual values, dashed line 3 yr running avg). See text for details of in-lake TP estimates.
Figure 11.
Figure 11.
Residuals of estimated and predicted total phosphorus in Lake Michigan and Lake Huron (left graphs) and correlation between residuals in Lake Michigan (x-axis) and Lake Huron (y-axis), 1983–2009 (right graph). Dotted line indicates 1:1 relationship; solid line indicates least-squares regression line, provided for reference. Gradation of symbol fills correspond to year, with lighter fills indicating more recent years.

References

    1. Ackerman JD, Loewen MR, Hamblin PF, 2001. Benthic–pelagic coupling over a zebra mussel reef in western Lake Erie. Limnol. Oceanogr 46, 892–904.
    1. APHA (American Public Health Association), 1985. Standard Methods for the Examination of Water and Wastewater. 16th ed. Washington, D.C.: American Public Health Association.
    1. Barbiero RP, Rockwell DC, Warren GJ, Tuchman ML, 2006. Changes in spring phytoplankton communities and nutrient dynamics in the eastern basin of Lake Erie since the invasion of Dreissena spp. Can. J Fish. Aquat. Sci 63: 1549–1563.
    1. Barbiero RP, Balcer M, Rockwell DC, Tuchman ML, 2009a. Recent shifts in the crustacean zooplankton community of Lake Huron. Can. J. Fish. Aquat. Sci 66, 816–828.
    1. Barbiero RP, Bunnell DB, Rockwell DC, Tuchman ML, 2009b. Recent increases in the large glacial-relict calanoid Limnocalanus macrurus in Lake Michigan. J. Great Lakes Res 35, 285–292.

LinkOut - more resources