. 2019 May 15:13:29.
doi: 10.3389/fncom.2019.00029. eCollection 2019.

Coding Capacity of Purkinje Cells With Different Schemes of Morphological Reduction

Affiliations

Coding Capacity of Purkinje Cells With Different Schemes of Morphological Reduction

Lingling An et al. Front Comput Neurosci. .

Abstract

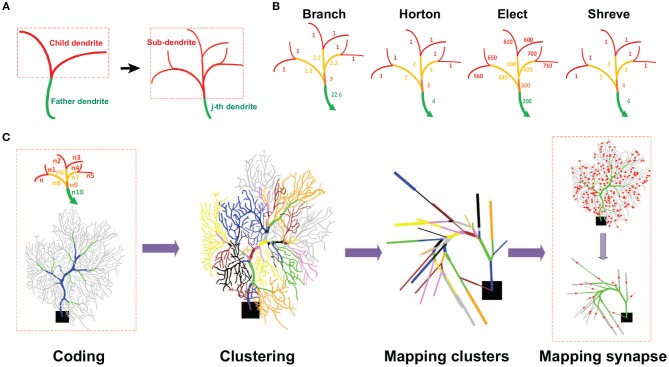
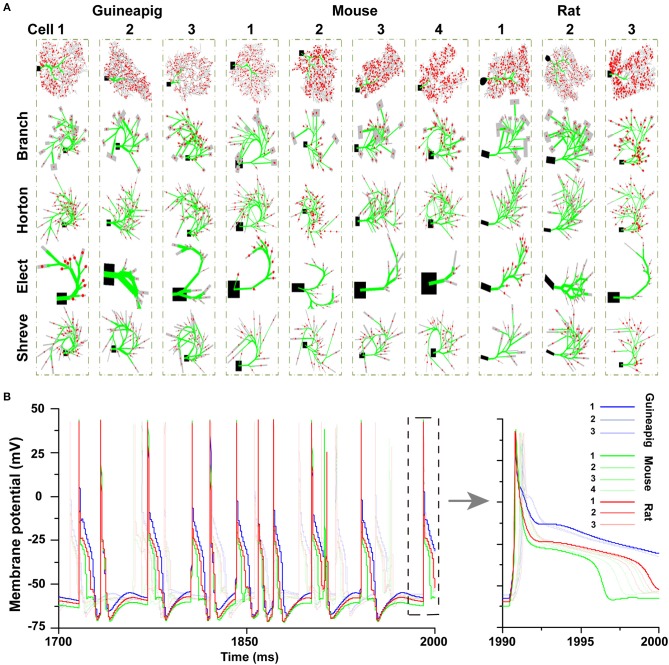
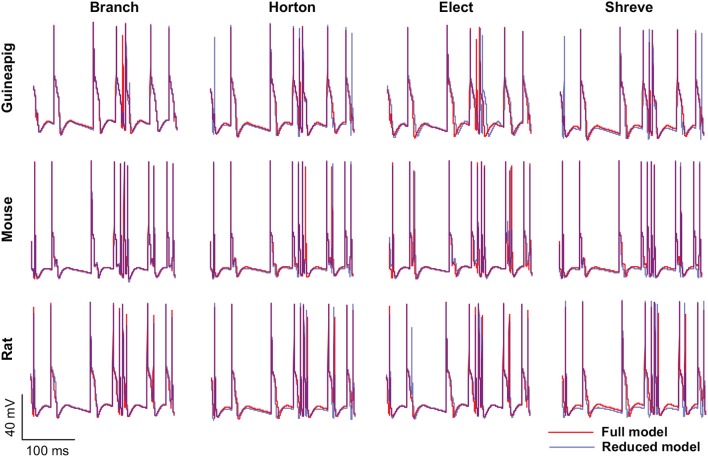
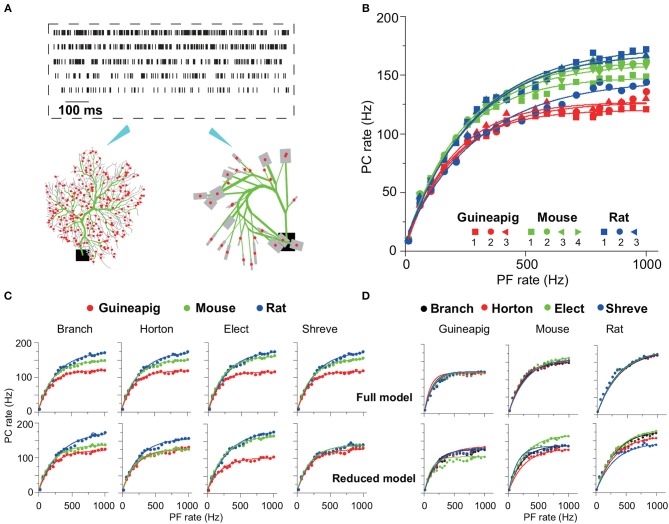
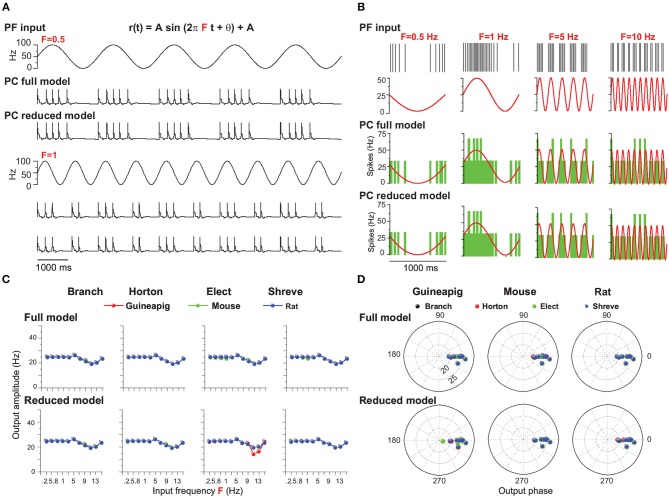
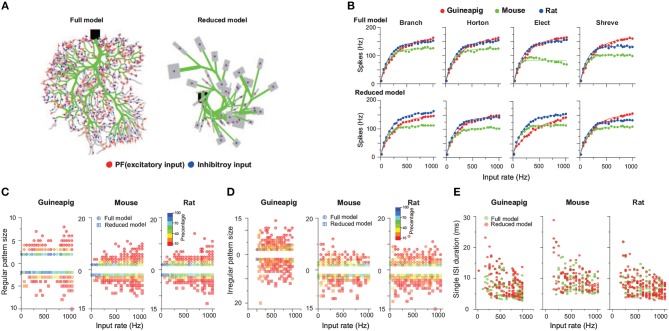
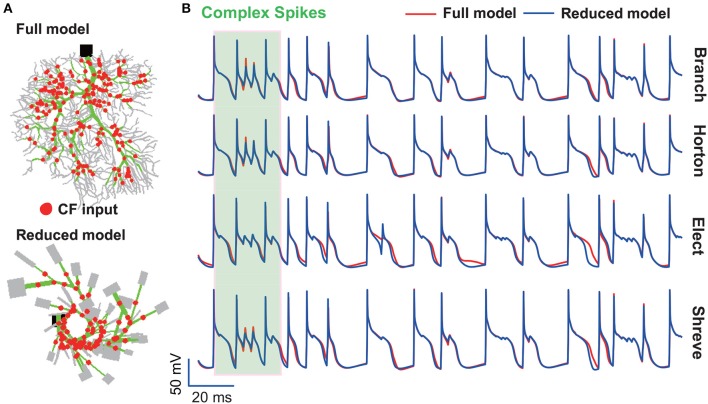
The brain as a neuronal system has very complex structures with a large diversity of neuronal types. The most basic complexity is seen from the structure of neuronal morphology, which usually has a complex tree-like structure with dendritic spines distributed in branches. To simulate a large-scale network with spiking neurons, the simple point neuron, such as the integrate-and-fire neuron, is often used. However, recent experimental evidence suggests that the computational ability of a single neuron is largely enhanced by its morphological structure, in particular, by various types of dendritic dynamics. As the morphology reduction of detailed biophysical models is a classic question in systems neuroscience, much effort has been taken to simulate a neuron with a few compartments to include the interaction between the soma and dendritic spines. Yet, novel reduction methods are still needed to deal with the complex dendritic tree. Here, using 10 individual Purkinje cells of the cerebellum from three species of guinea-pig, mouse and rat, we consider four types of reduction methods and study their effects on the coding capacity of Purkinje cells in terms of firing rate, timing coding, spiking pattern, and modulated firing under different stimulation protocols. We found that there is a variation of reduction performance depending on individual cells and species, however, all reduction methods can preserve, to some degree, firing activity of the full model of Purkinje cell. Therefore, when stimulating large-scale network of neurons, one has to choose a proper type of reduced neuronal model depending on the questions addressed. Among these reduction schemes, Branch method, that preserves the geometrical volume of neurons, can achieve the best balance among different performance measures of accuracy, simplification, and computational efficiency, and reproduce various phenomena shown in the full morphology model of Purkinje cells. Altogether, these results suggest that the Branch reduction scheme seems to provide a general guideline for reducing complex morphology into a few compartments without the loss of basic characteristics of the firing properties of neurons.

Keywords: Purkinje cell; dendritic model; multi-compartmental models; neuronal morphology; rate coding; temporal coding.


Figures

Figure 1
Figure 1
Schematic view of reduction process. (A) Illustration of a dendritic field. Each sub-branch has a father dendrite with several child dendrites. Each of them can be indexed as the j-th dendrite (green) with a set of sub-dendrites (red). (B) Illustration of different coding schemes of a neuronal morphological structure. Levels of dendrites are colored differently with terminal dendrites as red and non-terminal dendrites as other colors. The number of each dendrite is the order value obtained by different coding schemes. For instance, for the Branch model, the order value of non-terminal dendrites is the sum of all their sub-dendrite order values plus a weight as the number of sub-dendrites divided by 10. Thus, the order values of all terminal dendrites are 1. At the next level, the dendrites have an order value of 2.2 that is the sum of 2, from all their sub-dendrite order values, with 0.2 as a weight of the number of sub-dendrites divided by 10. So, the final order value at this level is 2.2. This process moves from the terminal or non-terminal dendrites level by level to obtain all the order values. Note Elect method operates in an opposite way. (C) Reduction process. Coding: The first step is to encode the morphological structure and distinguish different functional areas (Blue, Trunk. Green, Smooth. Gray, Spiny) of a neuron. Clustering: the second step is to set clusters according to the coding number. Mapping clusters: the third step is to map each cluster into a single compartment. Mapping synapses: the fourth step is to map synaptic locations in the reduced model. The red dots indicate synaptic locations in the spiny dendrites.
Figure 2
Figure 2
Detailed and simplified PC morphologies. (A) A total of 10 PCs from three species are reduced by four different schemes, Branch, Horton, Elect, and Shreve methods. Spiny dendrites in gray, smooth dendrites and initial major branches in green. Spiny dendrites receive 1,000 excitatory AMPA-type synapses from parallel fibers (red dots). (B) Hyperpolarization phases after spiking are different in 10 full PC morphologies. Poisson stimulation at 50 Hz.
Figure 3
Figure 3
Spiking dynamics of full and reduced PC models. Membrane potential traces recorded from the soma of three example PCs of guinea-pigs, mice and rats with full model (red) and four reduced models (blue). Poisson stimulation at 50 Hz.
Figure 4
Figure 4
PC firing responses in full and reduced models. (A) Schematic view of Poisson stimulation sequences from 60 to 260 Hz injected to spiny dendrites of full (left) and reduced (right) models. (B) Firing response curves of 10 PCs with full morphology. (C,D) Comparison of firing response curves of three example PCs from a guinea-pig, mouse and rat under four reduction schemes, Branch, Horton, Elect, and Shreve, respectively. PC curves are grouped by species in (C) and by reduction schemes in (D). Note that there are four PC response curves in one full model, since each is a realization of random distribution of PF input synapses. Solid curves in (B–D) are fitted exponential functions. Poisson stimulation in all cases.
Figure 5
Figure 5
PC temporal responses under Poisson and renewal stimulation with Branch method. (A) Schematic view of PF input (top) and PC output spike trains from full model (middle) and Branch model (bottom) from mouse. Poisson stimulation at 100 Hz. (B) ISI distribution of spike trains from PF (gray), PC full model (light red) and PC reduced model (green), respectively, under Poisson and renewal process stimulation for guinea-pig (top), mouse (middle), rat (bottom). All stimuli are at 50 Hz for 10 s. Similarity between the ISI distributions of full and reduced model measured by p-value, Wilcoxon Rank-sum test. Guinea-pig, 0.51; Mouse, 0.97; Rat 0.26 for Poisson stimulation, and Guinea-pig, 0.63; Mouse 0.93; Rat, 0.32 for renewal stimulation. (C) Distribution of COV2 values obtained from spike trains of PF inputs (left), PC full model (middle), and Branch model (right) from mouse with Poisson stimulation of different frequencies. (D) PCCOV2/PFCOV2 showing the regularity between PF inputs and PC outputs for full model (green) and reduced model (purple) of guinea-pig, mouse and rat. Poisson and renewal process stimulation with different frequencies from 10 to 1K Hz.
Figure 6
Figure 6
Membrane potential traces recorded from the soma of three example PCs of a guinea-pig, mouse and rat in the Branch model. Poisson stimulation at 500 Hz.
Figure 7
Figure 7
PC spiking pattern statistics with Branch method. (A) Illustration of regular and irregular spiking patterns from spike trains. Each black bar indicates a spike. The start of regular patterns is colored in red; pink indicates successive ISIs in regular patterns, an irregular pattern is in green, and single ISI is in blue. Mouse PC was used. (B) Statistics of regular pattern size across a range of Poisson and renewal process stimulation for a guinea-pig, mouse, and rat in both the full and reduced models. Percentage of different size indicated by different colors, as there are more patterns in a higher frequency. (C) Percentage of regular patterns at different stimulation frequencies. (D) Single ISI duration across a range of a Poisson stimulation. (E) Statistics of irregular pattern size across a range of Poisson stimulation. Percentage of different size indicated by different colors.
Figure 8
Figure 8
PC firing modulated by sinusoidal PF inputs with different amplitudes. (A) Illustration of PF inputs and PC outputs. PF sinusoidal input at 1 Hz frequency with amplitude 20 (top) and 50 (bottom). Modulated PC firing voltage traces over three cycles of input for full model and Branch model. (B) Similar to (A) with four different amplitudes of 20, 50, 80, and 100 Hz inputs. (top) PF input spike trains and modulated firing rates. PC spike responses from the (middle) full model and (bottom) Branch model. Mouse PC used in (A,B). (C) Comparison of modulation amplitudes of PF input vs. PC output in full and reduced models of four reduced schemes for the guinea-pig (red), mouse (green), and rat (blue), respectively. (D) Similar to (C), but for phase change of PC firing modulation for full model and reduced models. Sinusoidal stimulation frequency is 1Hz in all cases.
Figure 9
Figure 9
PC firing modulated by sinusoidal PF inputs with different frequencies. (A) Illustration of PF inputs and PC outputs. PF sinusoidal input with amplitude 50 at frequencies of 0.5 Hz (top) and 1 (bottom). Modulated PC firing voltage traces over five cycles of input for full model and Branch model. (B) Similar to (A) with four different frequencies of 0.5, 1, 5, and 10 Hz inputs. (top) PF input spike trains and modulated firing rate. PC spike responses from the (middle) full model and (bottom) Branch model. Mouse PC used in (A,B). (C) Modulation amplitudes of PC output in full and reduced models of four reduced schemes for the guinea-pig (red), mouse (green), and rat (blue), respectively, at different PF input frequencies. (D) Similar to (C), but for phase change of PC firing modulation for the full and reduced models. PF sinusoidal stimulation amplitude is 25 Hz in (B–D).
Figure 10
Figure 10
PC firing activities with 500 inhibitory and 1,000 excitatory inputs in Poisson stimulation. (A) Full (left) and Branch (right) models receive excitatory (red) and inhibitory (blue) synapses. (B) Comparison of firing response curves of three example PCs from the guinea-pig, mouse and ratt under four reduction schemes, Branch, Horton, Elect and Shreve, respectively. (C) Statistics of regular pattern size across a range of Poisson stimulation for the guinea-pig, mouse, and rat in the full and Branch models. Percentage of different size is indicated by different colors. (D) Similar as (C), but for irregular patterns. (E) Single ISI duration across a range of Poisson stimulation.
Figure 11
Figure 11
Complex spikes reproduced by reduced models. (A) Full and reduced morphology of the guinea-pig receiving CF (red dot) synapses. (B) Membrane potential traces recorded from the soma of guinea-pig PC in full (red) and four reduced models (blue). The shaded part indicates complex spikes. Poisson stimulation at 200 Hz.

Similar articles

Cited by

References

    1. Achard P., Schutter E. D. (2008). Calcium, synaptic plasticity and intrinsic homeostasis in purkinje neuron models. Front. Comput. Neurosci. 2:8. 10.3389/neuro.10.008.2008 - DOI - PMC - PubMed
    1. Amir K., Zee D. S. (2011). Cerebellum and ocular motor control. Front. Neurol. 2:53 10.3389/fneur.2011.00053 - DOI - PMC - PubMed
    1. Amsalem O., Eyal G., Rogozinski N., Segev I. (2018). An efficient analytical reduction of nonlinear detailed neuron models. bioRxiv. 10.1101/506485 - DOI - PMC - PubMed
    1. Armin B., Stemmler M. B., Herz A. V. M., Arnd R. (2012). Automated optimization of a reduced layer 5 pyramidal cell model based on experimental data. J. Neurosci. Methods 210, 22–34. 10.1016/j.jneumeth.2012.04.006 - DOI - PubMed
    1. Barmack N. H., Yakhnitsa V. (2008). Functions of interneurons in mouse cerebellum. J. Neurosci. 28, 1140–1152. 10.1523/JNEUROSCI.3942-07.2008 - DOI - PMC - PubMed