

Accelerated Deficits of Spatial Learning and Memory Resulting From Prenatal Inflammatory Insult Are Correlated With Abnormal Phosphorylation and Methylation of Histone 3 in CD-1 Mice
- PMID: 31156421
- PMCID: PMC6531990
- DOI: 10.3389/fnagi.2019.00114
Accelerated Deficits of Spatial Learning and Memory Resulting From Prenatal Inflammatory Insult Are Correlated With Abnormal Phosphorylation and Methylation of Histone 3 in CD-1 Mice
Abstract
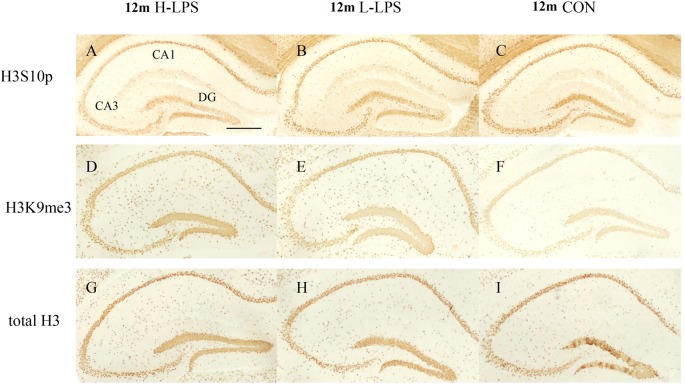
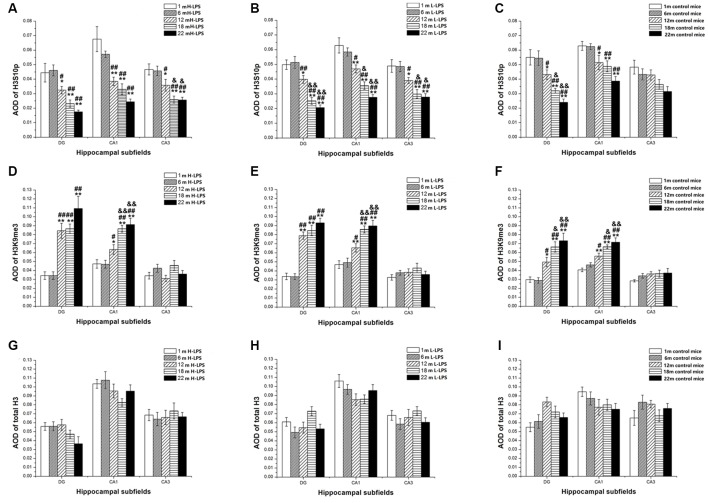
Gestational infection causes various neurological deficits in offspring, such as age-related spatial learning and memory (SLM) decline. How inflammation causes age-related SLM dysfunction remains unknown. Previous research has indicated that histone modifications, such as phosphorylation of H3S10 (H3S10p) and trimethylation of H3K9 (H3K9me3) may be involved. In our study, pregnant mice received an intraperitoneal injection of lipopolysaccharide (LPS, 50 or 25 μg/kg) or normal saline during gestational days 15-17. After normal parturition, the offspring were randomly separated into 1-, 6-, 12-, 18-, and 22-month-old groups. SLM performance was assessed using a radial six-arm water maze (RAWM). The hippocampal levels of H3S10p and H3K9me3 were detected using an immunohistochemical method. The results indicated that the offspring had significantly impaired SLM, with decreased H3S10p and increased H3K9me3 levels from 12 months onward. Maternal LPS exposure during late gestation significantly and dose-dependently exacerbated the age-related impairment of SLM, with the decrease in H3S10p and increase in H3K9me3 beginning at 12 months in the offspring. The histone modifications (H3S10p and H3K9me3) were significantly correlated with impairment of SLM. Our findings suggest that prenatal exposure to inflammation could exacerbate age-related impairments of SLM and changes in histone modifications in CD-1 mice from 12 months onward, and SLM impairment might be linked to decreased H3S10p and increased H3K9me3.
Keywords: aging; histone; lipopolysaccharide; memory; methylation; phosphorylation.
Figures


Similar articles
-
Effects of gestational inflammation on age-related cognitive decline and hippocampal Gdnf-GFRα1 levels in F1 and F2 generations of CD-1 Mice.BMC Neurosci. 2023 Apr 13;24(1):26. doi: 10.1186/s12868-023-00793-5. BMC Neurosci. 2023. PMID: 37055728 Free PMC article.
-
Maternal inflammation linearly exacerbates offspring age-related changes of spatial learning and memory, and neurobiology until senectitude.Behav Brain Res. 2016 Jun 1;306:178-96. doi: 10.1016/j.bbr.2016.03.011. Epub 2016 Mar 16. Behav Brain Res. 2016. PMID: 26992827
-
A Long-Term Enriched Environment Ameliorates the Accelerated Age-Related Memory Impairment Induced by Gestational Administration of Lipopolysaccharide: Role of Plastic Mitochondrial Quality Control.Front Cell Neurosci. 2021 Feb 3;14:559182. doi: 10.3389/fncel.2020.559182. eCollection 2020. Front Cell Neurosci. 2021. PMID: 33613195 Free PMC article.
-
Maternal inflammation induces spatial learning and memory impairment in the F1 and F2 generations of mice via sex-specific epigenetic mechanisms.Brain Res Bull. 2022 Oct 1;188:143-154. doi: 10.1016/j.brainresbull.2022.08.001. Epub 2022 Aug 3. Brain Res Bull. 2022. PMID: 35931406
-
Acceleration of age-related learning and memory decline in middle-aged CD-1 mice due to maternal exposure to lipopolysaccharide during late pregnancy.Behav Brain Res. 2011 Apr 15;218(2):267-79. doi: 10.1016/j.bbr.2010.11.001. Epub 2010 Nov 9. Behav Brain Res. 2011. PMID: 21070822
Cited by
-
Effects of gestational inflammation on age-related cognitive decline and hippocampal Gdnf-GFRα1 levels in F1 and F2 generations of CD-1 Mice.BMC Neurosci. 2023 Apr 13;24(1):26. doi: 10.1186/s12868-023-00793-5. BMC Neurosci. 2023. PMID: 37055728 Free PMC article.
-
Neuroinflammaging: A Tight Line Between Normal Aging and Age-Related Neurodegenerative Disorders.Aging Dis. 2024 Aug 1;15(4):1726-1747. doi: 10.14336/AD.2023.1001. Aging Dis. 2024. PMID: 38300639 Free PMC article. Review.
-
Maternal dietary omega-3 deficiency worsens the deleterious effects of prenatal inflammation on the gut-brain axis in the offspring across lifetime.Neuropsychopharmacology. 2021 Feb;46(3):579-602. doi: 10.1038/s41386-020-00793-7. Epub 2020 Aug 11. Neuropsychopharmacology. 2021. PMID: 32781459 Free PMC article.
-
Effects of Embryonic Inflammation and Adolescent Psychosocial Environment on Cognition and Hippocampal Staufen in Middle-Aged Mice.Front Aging Neurosci. 2020 Sep 11;12:578719. doi: 10.3389/fnagi.2020.578719. eCollection 2020. Front Aging Neurosci. 2020. PMID: 33024434 Free PMC article.
-
Environmental enrichment improves declined cognition induced by prenatal inflammatory exposure in aged CD-1 mice: Role of NGPF2 and PSD-95.Front Aging Neurosci. 2022 Nov 21;14:1021237. doi: 10.3389/fnagi.2022.1021237. eCollection 2022. Front Aging Neurosci. 2022. PMID: 36479357 Free PMC article.
References
LinkOut - more resources
Full Text Sources