. 2019 May 15:10:1080.
doi: 10.3389/fmicb.2019.01080. eCollection 2019.

The Soil Microbiome of GLORIA Mountain Summits in the Swiss Alps

Affiliations

The Soil Microbiome of GLORIA Mountain Summits in the Swiss Alps

Magdalene Adamczyk et al. Front Microbiol. .

Abstract

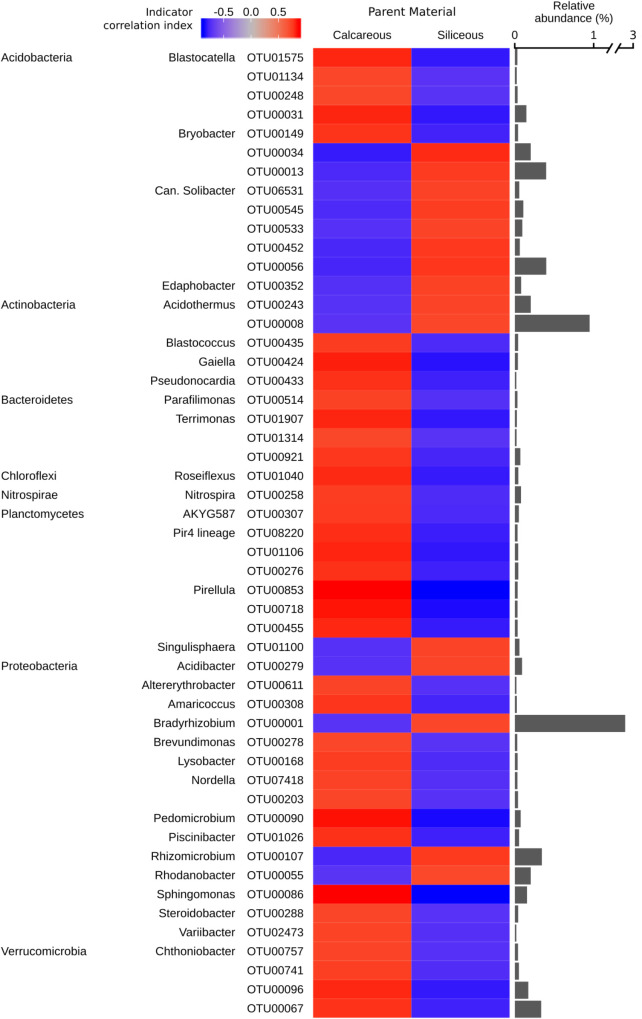
While vegetation has intensively been surveyed on mountain summits, limited knowledge exists about the diversity and community structure of soil biota. Here, we study how climatic variables, vegetation, parent material, soil properties, and slope aspect affect the soil microbiome on 10 GLORIA (Global Observation Research Initiative in Alpine environments) mountain summits ranging from the lower alpine to the nival zone in Switzerland. At these summits we sampled soils from all four aspects and examined how the bacterial and fungal communities vary by using Illumina MiSeq sequencing. We found that mountain summit soils contain highly diverse microbial communities with a total of 10,406 bacterial and 6,291 fungal taxa. Bacterial α-diversity increased with increasing soil pH and decreased with increasing elevation, whereas fungal α-diversity did not change significantly. Soil pH was the strongest predictor for microbial β-diversity. Bacterial and fungal community structures exhibited a significant positive relationship with plant communities, indicating that summits with a more distinct plant composition also revealed more distinct microbial communities. The influence of elevation was stronger than aspect on the soil microbiome. Several microbial taxa responded to elevation and soil pH. Chloroflexi and Mucoromycota were significantly more abundant on summits at higher elevations, whereas the relative abundance of Basidiomycota and Agaricomycetes decreased with elevation. Most bacterial OTUs belonging to the phylum Acidobacteria were indicators for siliceous parent material and several OTUs belonging to the phylum Planctomycetes were associated with calcareous soils. The trends for fungi were less clear. Indicator OTUs belonging to the genera Mortierella and Naganishia showed a mixed response to parent material, demonstrating their ubiquitous and opportunistic behaviour in soils. Overall, fungal communities responded weakly to abiotic and biotic factors. In contrast, bacterial communities were strongly influenced by environmental changes suggesting they will be strongly affected by future climate change and associated temperature increase and an upward migration of vegetation. Our results provide the first insights into the soil microbiome of mountain summits in the European Alps that are shaped as a result of highly variable local environmental conditions and may help to predict responses of the soil biota to global climate change.

Keywords: GLORIA; alpine; bacteria; climate change; fungi; mountain summit; soil.


Conflict of interest statement

The authors declare that the research was conducted in the absence of any commercial or financial relationships that could be construed as a potential conflict of interest.

Figures

FIGURE 1
FIGURE 1
Relative abundances of (A) bacterial and (B) fungal most abundant classes (>1%) across different summits. “Other” represents all classes with relative abundances < 1%. Summits are grouped by regions and ordered by increasing elevation (left–right) within. Region abbreviations: SN1 = Swiss National Park, calcareous parent material; SN2 = Swiss National Park, siliceous parent material; VAL = Valais, siliceous parent material. Summit abbreviations: MBU = Munt Buffalora; MCH = Munt Chavagl; PMU = Piz Murter; MCS = Mot sper Chamana Sesvenna; MIN = Minschuns; MDG = Mot dal Gajer; LAL = La Ly; BRU = Mont Brulé; PAR = Pointe du Parc; BOV = Pointe de Boveire.
FIGURE 2
FIGURE 2
Variation of α-diversity of bacterial and fungal communities at different summits. Shown are (A) bacterial richness, (B) fungal richness, (C) bacterial Shannon index and (D) fungal Shannon index. Summits are grouped by regions and ordered by increasing elevation (left–right) within. Region abbreviations: SN1 = Swiss National Park, calcareous parent material; SN2 = Swiss National Park, siliceous parent material; VAL = Valais, siliceous parent material. Summit abbreviations: MBU = Munt Buffalora; MCH = Munt Chavagl; PMU = Piz Murter; MCS = Mot sper Chamana Sesvenna; MIN = Minschuns; MDG = Mot dal Gajer; LAL = La Ly; BRU = Mont Brulé; PAR = Pointe du Parc; BOV = Pointe de Boveire.
FIGURE 3
FIGURE 3
Relationships of bacterial and fungal observed richness with elevation and selected environmental variables (A–H). Regression lines were fitted using linear mixed-effects models with region/summit/aspect as random effects. Fungal observed richness was transformed using Tukey’s ladder of powers. Abbreviations: SOC, soil organic carbon; MWST, mean winter soil temperature; n.s., not significant. Summit abbreviations: MBU = Munt Buffalora; MCH = Munt Chavagl; PMU = Piz Murter; MCS = Mot sper Chamana Sesvenna; MIN = Minschuns; MDG = Mot dal Gajer; LAL = La Ly; BRU = Mont Brulé; PAR = Pointe du Parc; BOV = Pointe de Boveire. Colours correspond to regions: Red = SN1, Swiss National Park, calcareous parent material; Blue = SN2, Swiss National Park, siliceous parent material; Green = VAL, Valais, siliceous parent material.
FIGURE 4
FIGURE 4
Principal coordinate analysis (PCoA) of (A) bacteria and (B) fungal β-diversities based on Bray–Curtis distance matrices. Distances between symbols on the ordination plot reflect relative dissimilarities in community structures. The variation in microbial community structures explained by each PCoA axis is given in parentheses.
FIGURE 5
FIGURE 5
Comparison of α and β-diversities between microbial and plant communities. Upper scatterplots show relationships of plant richness with (A) bacterial richness (F = 1.04, p = 0.31) and (B) fungal richness (F = 0.48, p = 0.49). Lower plots show relationships of plant β-diversity with (C) bacterial β-diversity (ρ = 0.57, p = 0.001) and (D) fungal β-diversity (ρ = 0.47, p = 0.004). In (C,D) each point represents the dissimilarities (Bray–Curtis) of taxonomic composition between a pair of summits (colours represent regions of each summit). The significances of correlations of α-diversity were assessed applying ANOVA to the output of linear mixed-effects models (random effects: region/summit/aspect). The significances of the correlations for β-diversity were assessed by Mantel tests with 9,999 permutations based on Spearman’s rank method. Region abbreviations: SN1 = Swiss National Park, calcareous parent material; SN2 = Swiss National Park, siliceous parent material; VAL = Valais, siliceous parent material. Summit abbreviations: MBU = Munt Buffalora; MCH = Munt Chavagl; PMU = Piz Murter; MCS = Mot sper Chamana Sesvenna; MIN = Minschuns; MDG = Mot dal Gajer; LAL = La Ly; BRU = Mont Brulé; PAR = Pointe du Parc; BOV = Pointe de Boveire.
FIGURE 6
FIGURE 6
Bacterial genera identified as significant indicators (q < 0.05) of calcareous or siliceous parent material (strength of correlation index > 0.75), grouped by phyla. The colour of the heatmap represents the strength of indication. The bars represent the relative abundance of each indicator OTU in all the samples.(Indicator OTUs with a relative abundance of < 0.01% are not shown. Repeated phyla/genera names omitted for easier visualisation. Full taxonomic assignment, indicator and significance values of all bacterial OTUs are reported in Supplementary Data S4.)
FIGURE 7
FIGURE 7
Fungal genera identified as significant indicators (q < 0.05) of calcareous or siliceous parent material (strength of correlation index > 0.4), grouped by phyla. The colour of the heatmap represents the strength of indication. The bars represent the relative abundance of each indicator OTU in all the samples. Indicator OTUs with a relative abundance of < 0.01% are not shown. Repeated phyla/genera names omitted for easier visualisation. Full taxonomic assignment, indicator and significance values of all fungal OTUs are reported in Supplementary Data S5.

Similar articles

Cited by

References

    1. Barry R. G. (2008). Mountain Weather and Climate 3rd Edn. New York, NY: Cambridge University Press.
    1. Barton H. A., Giarrizzo J. G., Suarez P., Robertson C. E., Broering M. J., Banks E. D., et al. (2014). Microbial diversity in a Venezuelan orthoquartzite cave is dominated by the Chloroflexi (Class Ktedonobacterales) and Thaumarchaeota Group I.1c. Front. Microbiol. 5:615. 10.3389/fmicb.2014.00615 - DOI - PMC - PubMed
    1. Bödeker C., Schüler M., Reintjes G., Jeske O., van Teeseling M. C., Jogler M., et al. (2017). Determining the bacterial cell biology of Planctomycetes. Nat. Commun. 8:14853. 10.1038/ncomms14853 - DOI - PMC - PubMed
    1. Bridge P. D., Newsham K. K. (2009). Soil fungal community composition at Mars Oasis, a southern maritime Antarctic site, assessed by PCR amplification and cloning. Fungal Ecol. 2 66–74. 10.1016/j.funeco.2008.10.008 - DOI
    1. Brunner I., Frey B., Hartmann M., Zimmermann S., Graf F., Suz L. M., et al. (2017). Ecology of alpine macrofungi - combining historical with recent data. Front. Microbiol. 8:2066. 10.3389/fmicb.2017.02066 - DOI - PMC - PubMed

LinkOut - more resources