

Immunomodulatory Effects and Induction of Apoptosis by Different Molecular Weight Chitosan Oligosaccharides in Head Kidney Macrophages From Blunt Snout Bream (Megalobrama amblycephala)
- PMID: 31156612
- PMCID: PMC6530513
- DOI: 10.3389/fimmu.2019.00869
Immunomodulatory Effects and Induction of Apoptosis by Different Molecular Weight Chitosan Oligosaccharides in Head Kidney Macrophages From Blunt Snout Bream (Megalobrama amblycephala)
Abstract
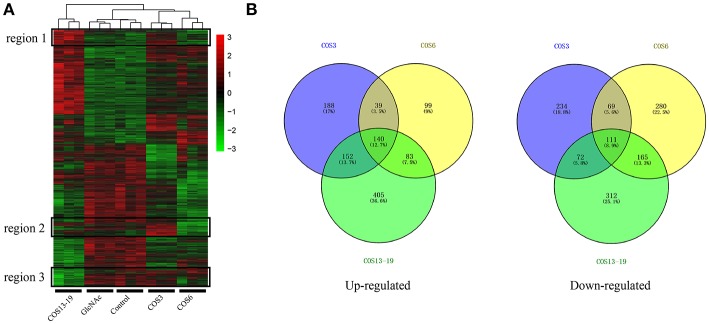
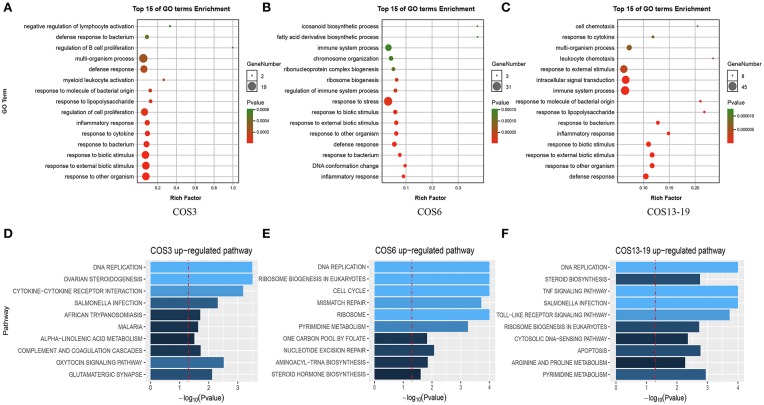
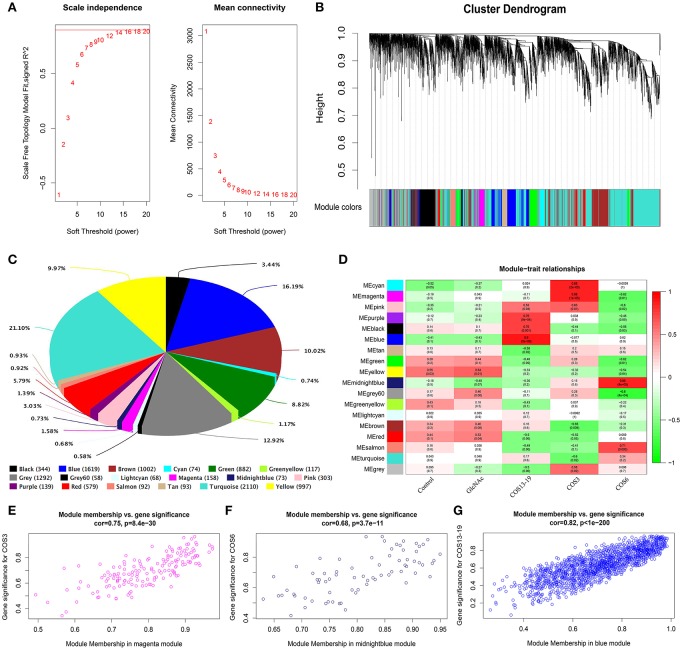
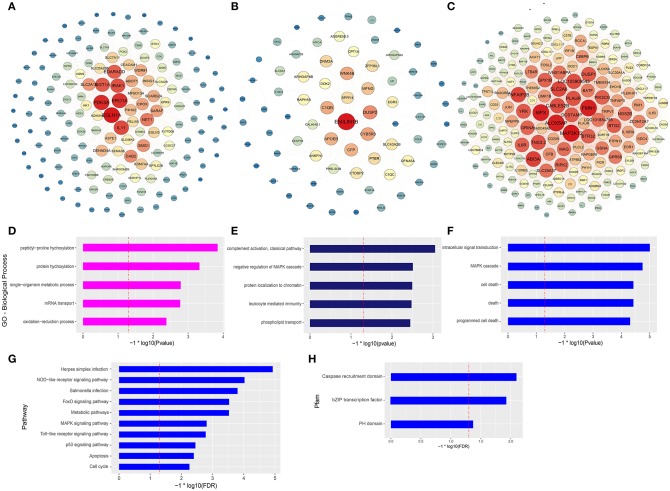
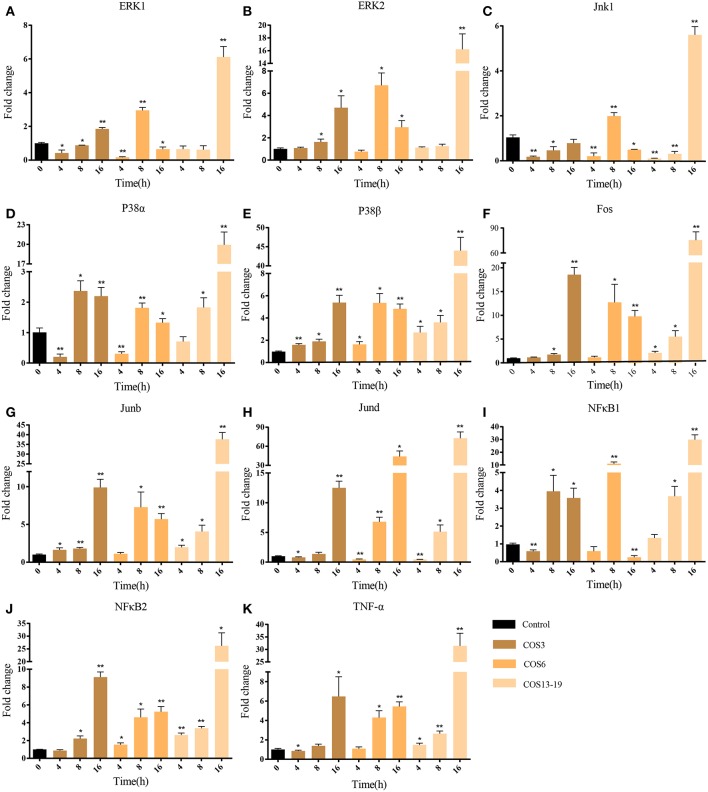
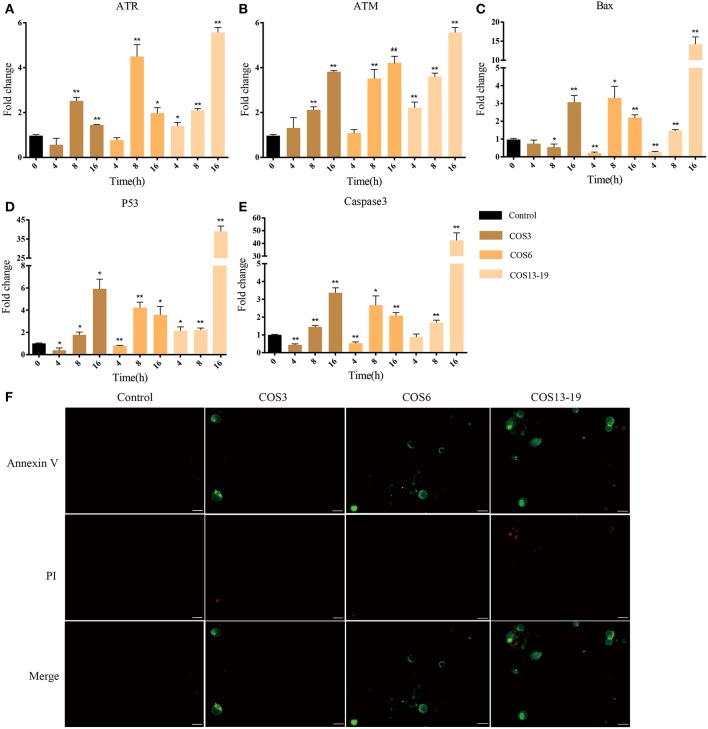
Prophylactic administration of immunopotentiators has been tested and practiced as one of the most promising disease prevention methods in aquaculture. Chitosan oligosaccharide (COS), as an ideal immunopotentiator, is mainly used as feed additives in aquaculture, and the antimicrobial and immune enhancement effects are highly correlated with molecular weight (MW), but little is known about the mechanisms in teleost. Here, we isolated and purified macrophages in head kidney from blunt snout bream (Megalobrama amblycephala), stimulated them with three different MW (~500 Da, ~1000 Da and 2000~3000 Da) COSs, performed RNA-sequencing, global transcriptional analyses, and verification by quantitative real-time PCR (qRT-PCR) and immunofluorescent staining methods. Differential expression gene (DEG) analysis indicated that gene expression patterns are different and the proportion of unique genes are relatively high in different treatment groups. Biological process and gene set enrichment analysis (GSEA) demonstrated that all three COSs activate resting macrophages, but the degrees are different. Weighted gene co-expression network analysis (WGCNA) reflected gene modules correlated to MW, the module hub genes and top GO terms showed the activation of macrophage was positively correlated with the MW, and larger MW COS activated cell death associated GO terms. Further use of the screening and enrichment functions of STRING and Pfam databases discovered that apoptosis-related pathways and protein families were activated, such as the P53 pathway and caspase protein family. qRT-PCR results showed that as the stimulation time extends, the innate immune-related and P53 pathways are gradually activated, and the degree of activation is positively correlated with the stimulation time. In addition, apoptosis was detected by immunofluorescent staining in three groups. Therefore, the use of COS has two sides-it can activate the immune system against pathogen invasion, but with the increase in stimulation time and MW, macrophage apoptosis is induced, which may be caused by abnormal replication of DNA and excessive inflammation. This study provides a theoretical basis for the rational use of COS as an immunopotentiator in aquaculture.
Keywords: Chitosan oligosaccharide; Megalobrama amblycephala; P53 pathway; apoptosis; macrophage; transcriptome.
Figures
Similar articles
-
Mannose Receptor Mediates the Activation of Chitooligosaccharides on Blunt Snout Bream (Megalobrama amblycephala) Macrophages.Front Immunol. 2021 Aug 2;12:686846. doi: 10.3389/fimmu.2021.686846. eCollection 2021. Front Immunol. 2021. PMID: 34408745 Free PMC article.
-
Transcriptome analysis and microsatellite discovery in the blunt snout bream (Megalobrama amblycephala) after challenge with Aeromonas hydrophila.Fish Shellfish Immunol. 2015 Jul;45(1):72-82. doi: 10.1016/j.fsi.2015.01.034. Epub 2015 Feb 12. Fish Shellfish Immunol. 2015. PMID: 25681750
-
Dietary Mannan Oligosaccharides Enhance the Non-Specific Immunity, Intestinal Health, and Resistance Capacity of Juvenile Blunt Snout Bream (Megalobrama amblycephala) Against Aeromonas hydrophila.Front Immunol. 2022 Jun 15;13:863657. doi: 10.3389/fimmu.2022.863657. eCollection 2022. Front Immunol. 2022. PMID: 35784342 Free PMC article.
-
Chitosan oligosaccharide (COS): An overview.Int J Biol Macromol. 2019 May 15;129:827-843. doi: 10.1016/j.ijbiomac.2019.01.192. Epub 2019 Jan 29. Int J Biol Macromol. 2019. PMID: 30708011 Review.
-
Chitin, chitosan and chitooligosaccharides as potential growth promoters and immunostimulants in aquaculture: A comprehensive review.Int J Biol Macromol. 2023 Nov 1;251:126285. doi: 10.1016/j.ijbiomac.2023.126285. Epub 2023 Aug 14. Int J Biol Macromol. 2023. PMID: 37582433 Review.
Cited by
-
Chromatin accessibility and differentially expressed genes profiling in large yellow croaker (Larimichthys crocea) head kidney cells following iridovirus infection.Front Immunol. 2025 Jan 30;16:1513966. doi: 10.3389/fimmu.2025.1513966. eCollection 2025. Front Immunol. 2025. PMID: 39949772 Free PMC article.
-
Network Pharmacology Combined with an Experimental Validation Study to Reveal the Effect and Mechanism of Eucommia ulmoides Leaf Polysaccharide against Immunomodulation.Foods. 2023 Mar 2;12(5):1062. doi: 10.3390/foods12051062. Foods. 2023. PMID: 36900578 Free PMC article.
-
Mannose Receptor Mediates the Activation of Chitooligosaccharides on Blunt Snout Bream (Megalobrama amblycephala) Macrophages.Front Immunol. 2021 Aug 2;12:686846. doi: 10.3389/fimmu.2021.686846. eCollection 2021. Front Immunol. 2021. PMID: 34408745 Free PMC article.
-
Serine Metabolism Tunes Immune Responses To Promote Oreochromis niloticus Survival upon Edwardsiella tarda Infection.mSystems. 2021 Aug 31;6(4):e0042621. doi: 10.1128/mSystems.00426-21. Epub 2021 Aug 24. mSystems. 2021. PMID: 34427522 Free PMC article.
-
Designing and the anticancer activity of chitosan and chitosan oligosaccharide lactate nanobeads loaded with Biginelli hybrid.RSC Adv. 2024 Oct 4;14(43):31526-31534. doi: 10.1039/d4ra05783j. eCollection 2024 Oct 1. RSC Adv. 2024. PMID: 39372042 Free PMC article.
References
-
- Sakai M. Current research status of fish Immunostimulants. Aquaculture. (1999) 172:63–92. 10.1016/S0044-8486(98)00436-0 - DOI
Publication types
MeSH terms
Substances
LinkOut - more resources
Full Text Sources
Research Materials
Miscellaneous