. 2019 May 16:10:549.
doi: 10.3389/fpls.2019.00549. eCollection 2019.

Genome-Wide Characterization and Expression Analysis of Soybean TGA Transcription Factors Identified a Novel TGA Gene Involved in Drought and Salt Tolerance

Affiliations

Genome-Wide Characterization and Expression Analysis of Soybean TGA Transcription Factors Identified a Novel TGA Gene Involved in Drought and Salt Tolerance

Bo Li et al. Front Plant Sci. .

Abstract

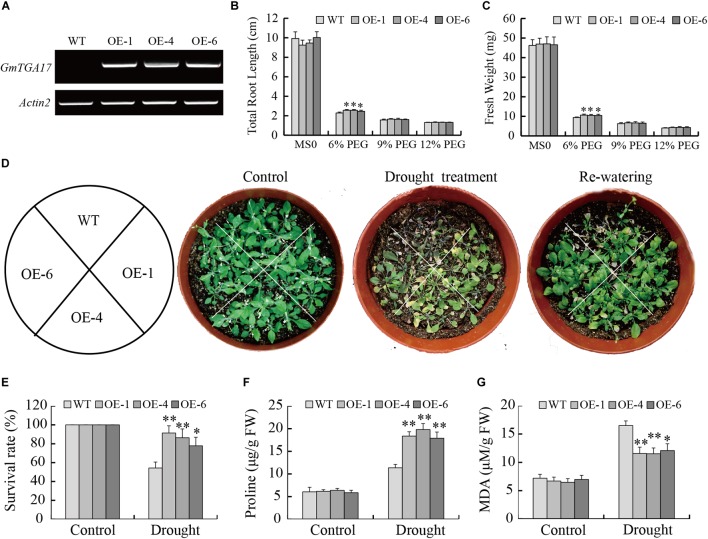
The TGA transcription factors, a subfamily of bZIP group D, play crucial roles in various biological processes, including the regulation of growth and development as well as responses to pathogens and abiotic stress. In this study, 27 TGA genes were identified in the soybean genome. The expression patterns of GmTGA genes showed that several GmTGA genes are differentially expressed under drought and salt stress conditions. Among them, GmTGA17 was strongly induced by both stress, which were verificated by the promoter-GUS fusion assay. GmTGA17 encodes a nuclear-localized protein with transcriptional activation activity. Heterologous and homologous overexpression of GmTGA17 enhanced tolerance to drought and salt stress in both transgeinc Arabidopsis plants and soybean hairy roots. However, RNAi hairy roots silenced for GmTGA17 exhibited an increased sensitivity to drought and salt stress. In response to drought or salt stress, transgenic Arabidopsis plants had an increased chlorophyll and proline contents, a higher ABA content, a decreased MDA content, a reduced water loss rate, and an altered expression of ABA- responsive marker genes compared with WT plants. In addition, transgenic Arabidopsis plants were more sensitive to ABA in stomatal closure. Similarly, measurement of physiological parameters showed an increase in chlorophyll and proline contents, with a decrease in MDA content in soybean seedlings with overexpression hairy roots after drought and salt stress treatments. The opposite results for each measurement were observed in RNAi lines. This study provides new insights for functional analysis of soybean TGA transcription factors in abiotic stress.

Keywords: TGA transcription factor; abiotic stress response; drought and salt tolerance; molecular characterization; soybean.


Figures

FIGURE 1
FIGURE 1
Phylogenetic analyses of TGA proteins from Arabidopsis, rice and soybean. Each clade is marked by a separate color.
FIGURE 2
FIGURE 2
Expression profiles of soybean TGA genes in seven different tissues of soybean. Different colors in map represent gene transcript abundance values. The color scale is shown in the bar at bottom of figure.
FIGURE 3
FIGURE 3
Expression profiles of soybean TGA genes under drought stress conditions. The expression levels were normalized to that of CYP2. Values are means and SD obtained from four biological replicates. The asterisks indicate a statistical significance (P < 0.05 and ∗∗P < 0.01) compared with the corresponding controls.
FIGURE 4
FIGURE 4
Expression profiles of soybean TGA genes under salt stress conditions. The expression levels were normalized to that of CYP2. Values are means and SD obtained from four biological replicates. The asterisks indicate a statistical significance (P < 0.05 and ∗∗P < 0.01) compared with the corresponding controls.
FIGURE 5
FIGURE 5
Subcellular localization and transcription activation analysis of GmTGA17. (A) Co-localization of GmTGA17. The recombinant plasmids of GmTGA17-GFP and NtTGA2.2-RFP were co-transformed into Arabidopsis protoplasts. Results were detected with confocal microscopy. Scale bars = 10 μm. (B) Transcriptional activity analysis of GmTGA17 in yeast cells. pGBKT7-AtDREB2A and pGBKT7 were used as positive and negative controls, respectively. (C) Transient expression assay in Arabidopsis protoplasts investigating the transcriptional activation activity of GmTGA17. The relative LUC activities in each sample was normalized relative to that of the internal control. Values are the mean ± SD of three independent replicates and the asterisks indicate a significant difference (∗∗P < 0.01) compared with the corresponding controls.
FIGURE 6
FIGURE 6
Expression of the GUS reporter gene under the control of GmTGA17 promoter in transgenic soybean hairy roots. (A) Histochemical assay and (B) relative expression of GUS. The GmTGA17pro-GUS transgenic soybean hairy roots were treated with distilled water, 10% (m/v) PEG6000, or 100 mM NaCl for 6 h before being subjected to histochemical and expression analysis. The expression level of CYP2 was used as quantitative control. Values are means and SD obtained from four biological replicates. The asterisks indicate a statistical significance (∗∗P < 0.01) compared with the corresponding controls.
FIGURE 7
FIGURE 7
Heterologous overexpression of GmTGA17 in Arabidopsis enhanced drought tolerance. (A) Semi-qRT-PCR analysis of GmTGA17 expression levels in T3 transgenic Arabidopsis lines. (B) Total root length and (C) fresh weight of WT and transgenic lines exposed to 0, 6, 9, and 12% (m/v) PEG6000 for 8 days. (D) Phenotypes of WT and transgenic plants grown in soil under drought stress: control, treated for 2 weeks and re-watered for 1 week. (E) Survival rates was counted after 1 week of recovery. (F) Proline and (G) MDA contents were measured 10 days after treatment. All values are presented as means of three independent replicates (n = 40). The error bars indicate SD. The asterisks denote a significant difference (P < 0.05 and ∗∗P < 0.01) compared with the corresponding controls.
FIGURE 8
FIGURE 8
Response of WT and transgenic Arabidopsis plants to NaCl treatment. (A) Phenotypes of WT and transgenic seedlings under NaCl treatment. The photographs were taken after 8 days of treatment. (B) Total root length and (C) fresh weight of WT and transgenic lines exposed to 0, 50, 75, and 100 mM NaCl for 8 days. Scale bars = 1 cm. All values are presented as means of three independent replicates (n = 30). The error bars indicate SD. The asterisks denote a significant difference (P < 0.05) compared with the corresponding controls.
FIGURE 9
FIGURE 9
Enhance salt tolerance mediated by heterologous overexpression of GmTGA17 in Arabidopsis. (A) Phenotypes of WT and transgenic plants grown in soil under high salinity treatment conditions. The photographs were taken after 1 week of treatment. (B) Survival rates was counted after 1 week of treatment. (C) Chlorophyll content was measured 5 days after treatment. All values are presented as means of three independent replicates (n = 40). The error bars indicate SD. The asterisks denote a significant difference (P < 0.05 and ∗∗P < 0.01) compared with the corresponding controls.
FIGURE 10
FIGURE 10
GmTGA17 promotes ABA-induced stomatal closure. (A) Water loss from detached leaves of transgenic Arabidopsis lines and WT. The water loss of 1.0 g detached leaves from different lines was expressed as the percentage of initial fresh weight. Values are presented as means of three independent replicates. The error bars indicate SD. (B) Endogenous ABA content in leaves of transgenic Arabidopsis lines and WT plants before and after different abiotic stress treatments. ELISA was used to measure ABA content in leaves of transgenic Arabidopsis lines and WT plants with drought treatment for 10 days or salt treatment for 5 days. Values are presented as means ± SD of three independent replicates. The asterisks denote a significant difference (P < 0.05 and ∗∗P < 0.01) compared with the corresponding controls. (C,D) ABA-mediated stomatal closure. Rosette leaves from 3-week-old transgenic Arabidopsis lines and WT plants were treated with stomatal opening solution and in ABA solution (0, 10 or 15 μM) for another 3 h. Scale bars = 10 μm. Data are means of three independent replicates (n = 40). The error bars indicate SD. The asterisks denote a significant difference (P < 0.05 and ∗∗P < 0.01) compared with the corresponding controls.
FIGURE 11
FIGURE 11
The expressions of several ABA-responsive genes in transgenic Arabidopsis lines and WT plants following drought and salt stress. qRT-PCR was used to detect expression levels of stress-related genes in transgenic Arabidopsis lines and WT plants with drought treatment for 10 days or salt treatment for 5 days. Values are means and SD obtained from four biological replicates. The asterisks indicate a statistical significance (P < 0.05 and ∗∗P < 0.01) compared with the corresponding controls.
FIGURE 12
FIGURE 12
Performance of GmTGA17 transgenic soybean hairy roots under drought and salt stress. (A) Phenotypes of plants with transgenic soybean hairy roots under PEG and high salinity treatments. (B) Transgenic hairy root images: control and after treatment. Scale bars = 1 cm. (C) Relative GmTGA17 expression in roots overexpressing GmTGA17, RNA interference hairy roots, and control roots as shown by qRT-PCR. qRT-PCR quantifications were normalized to the expression of CYP2. Values are means and SD obtained from four biological replicates. The asterisks indicate a statistical significance (∗∗P < 0.01) compared with the corresponding controls. (D,E) Total root length and total root surface were measured 10 days after treatments (F–H) Chlorophyll, proline, and MDA contents in leaves of plants with transgenic hairy roots were measured 1 week after treatments. All values are presented as means of three independent replicates (n > 45). The error bars indicate SD. The asterisks denote a significant difference (P < 0.05 and ∗∗P < 0.01) compared with the corresponding controls.

Similar articles

Cited by

References

    1. Alvarez J. M., Riveras E., Vidal E. A., Gras D. E., Contreras-Lopez O., Tamayo K. P., et al. (2014). Systems approach identifies TGA1 and TGA4 transcription factor as important regulatory components of the nitrate response of Arabidopsis thaliana. Plant J. 80 1–13. 10.1111/tpj.12618 - DOI - PubMed
    1. Arnon D. I. (1949). Copper enzymes in isolated chloroplasts. Polyphenoloxidase in Beta vulgaris. Plant Physiol. 24 1–15. 10.1104/pp.24.1.1 - DOI - PMC - PubMed
    1. Baker S. S.Thomashow M. F. (1994). The 5′-region of Arabidopsis thaliana cor15a has cis-acting elements that confer cold-, drought-and ABA-regulated gene expression. Plant Mol. Biol. 24 701–713. 10.1007/BF00029852 - DOI - PubMed
    1. Bates L. S., Waldren R. P., Teare I. D. (1973). Rapid determination of free proline for water-stress studies. Plant Soil 39 205–207. 10.1007/BF00018060 - DOI - PubMed
    1. Busk P. K., Pagès M. (1998). Regulation of abscisic acid-induced transcription. Plant Mol. Biol. 37 425–435. 10.1023/A:1006058700720 - DOI - PubMed

LinkOut - more resources