. 2019 Apr 26;15(3):251-256.
doi: 10.1038/s41567-018-0356-9. Epub 2018 Nov 26.

Emergence of three-dimensional order and structure in growing biofilms

Affiliations

Emergence of three-dimensional order and structure in growing biofilms

Raimo Hartmann et al. Nat Phys. .

Abstract

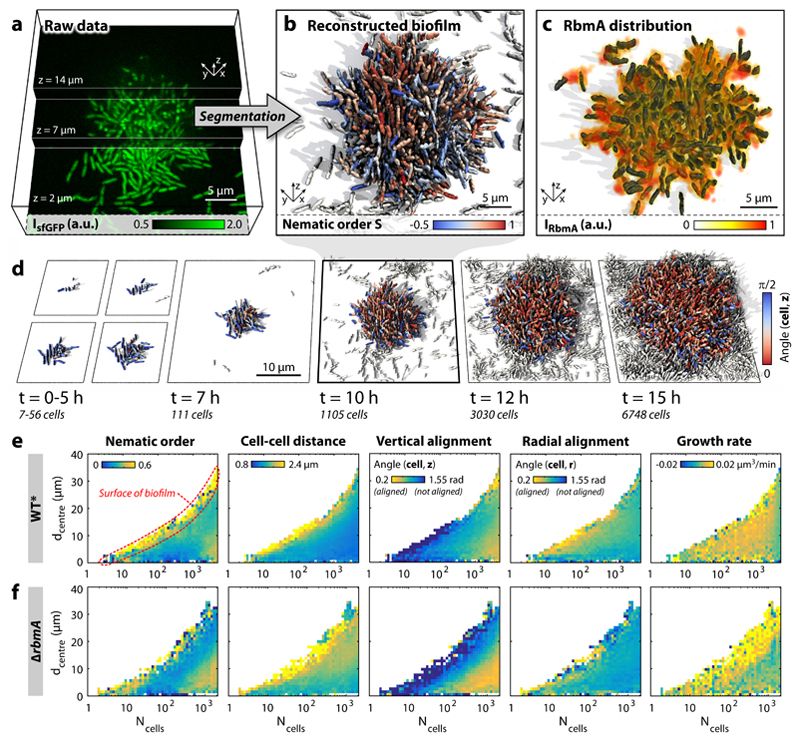
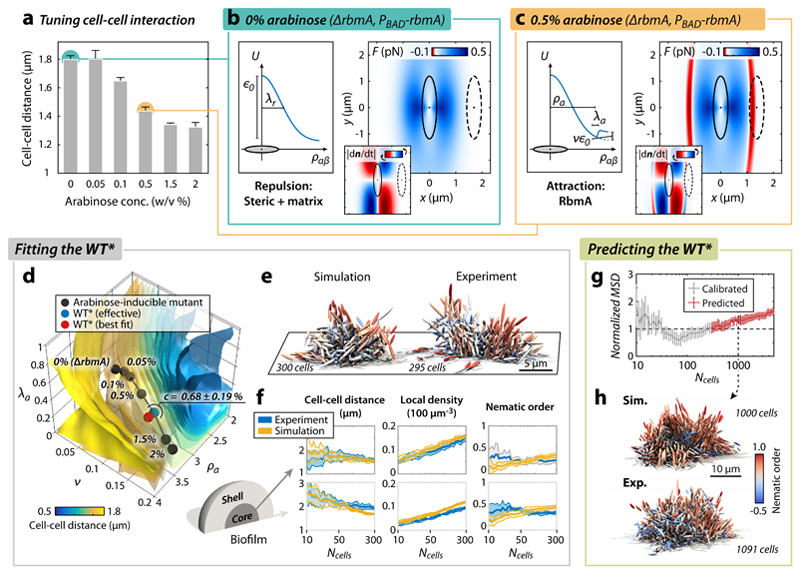
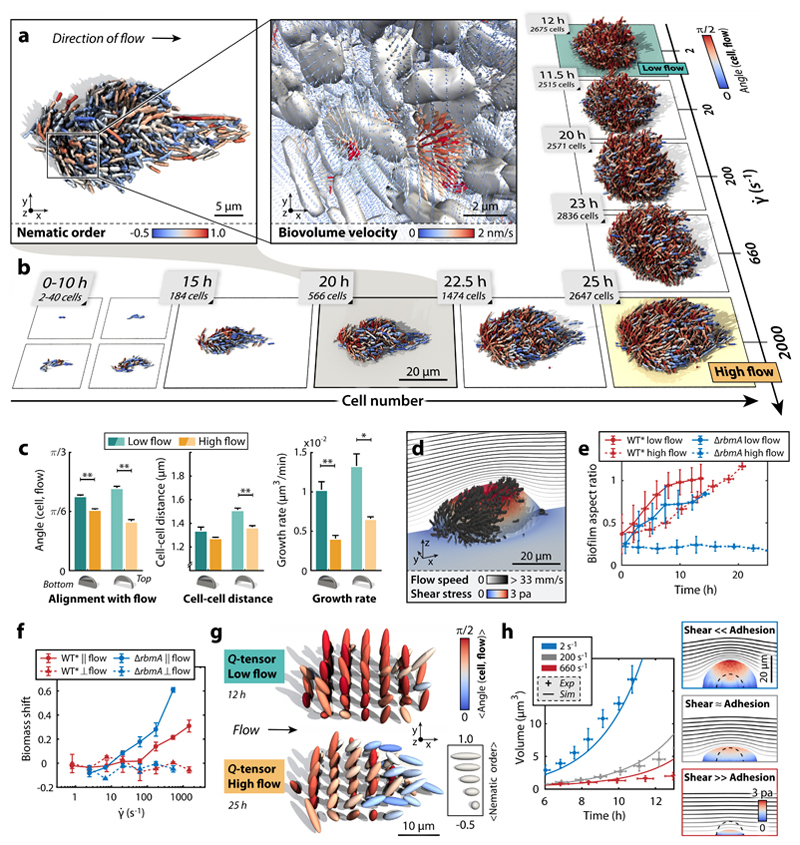
Surface-attached bacterial biofilms are self-replicating active liquid crystals and the dominant form of bacterial life on earth (1-4). In conventional liquid crystals and solid-state materials, the interaction potentials between the molecules that comprise the system determine the material properties. However, for growth-active biofilms it is unclear whether potential-based descriptions can account for the experimentally observed morphologies, and which potentials would be relevant. Here, we overcame previous limitations of single-cell imaging techniques (5,6) to reconstruct and track all individual cells inside growing three-dimensional (3D) biofilms with up to 10,000 individuals. Based on these data, we identify, constrain, and provide a microscopic basis for an effective cell-cell interaction potential, which captures and predicts the growth dynamics, emergent architecture, and local liquid crystalline order of Vibrio cholerae biofilms. Furthermore, we show how external fluid flows control the microscopic structure and 3D morphology of biofilms. Our analysis implies that local cellular order and global biofilm architecture in these active bacterial communities can arise from mechanical cell-cell interactions, which cells can modulate by regulating the production of particular matrix components. These results establish an experimentally validated foundation for improved continuum theories of active matter and thereby contribute to solving the important problem of controlling biofilm growth.


Conflict of interest statement

Competing financial interests The authors declare no competing financial interest.

Figures

Figure 1
Figure 1. Dynamics of V. cholerae biofilm formation.
a, Cells constitutively expressing a green fluorescent protein (sfGFP) were imaged with spinning disc confocal microscopy. Images at three different z-planes are highlighted. b, 3D reconstruction of the biofilm shown in panel a, where each cell is coloured according to the nematic order parameter S=<3/2(n^i·n^j)21/2> in its vicinity. High time resolution (Δt = 5–10 min) imaging allowed us to track cell lineages and discriminate cells (white) which are not direct descendants of the biofilm founder cell. c, The extracellular matrix protein RbmA mediates cell-cell adhesion and is distributed throughout the biofilm, as visualized by immunofluorescence. d, Time-resolved WT* biofilm growth series. Each cell is coloured according to the cellular alignment with the z-axis (for the ΔrbmA mutant see Supplementary Fig. 6). e-f, Heatmaps showing spatially resolved single-cell measurements of different biofilm structural properties inside WT* (e) and ΔrbmA (f) biofilms, which are used to characterize biofilm formation (n > 3 biofilms, standard deviations are shown in Supplementary Figs. 5 and 7 and the differences among both strains are highlighted in Supplementary Fig. 8), as a function of the distance to the biofilm centre (dcentre) and the number of cells inside the biofilm (Ncells).
Figure 2
Figure 2. Biofilm architecture development is captured by an effective mechanical cell-cell interaction potential.
a, Increased RbmA production (achieved by increasing arabinose concentration, see Methods) decreases the average cell-cell distance in biofilms. Without arabinose, no RbmA is produced and the biofilm architecture is identical to the ΔrbmA mutant (n > 3 biofilms). b, Cell-cell interaction inside ΔrbmA mutant biofilms lacking cell-cell adhesion, modelled by the repulsive interaction potential (left) and the resulting cell-cell interaction forces (right) for the best-fit potential and the most prominent cellular orientation (red: attractive, blue: repulsive). Inset: rotational interaction dynamics (red: clockwise rotation, blue: counter-clockwise rotation). For more details and additional orientations see Supplementary Figs. 18 and 19. The dashed cell is plotted at the average cell-cell distance obtained from the corresponding experiment in panel a. c, The cell-cell interaction potential (left) and force (right) resulting from the best-fit potential for biofilms with a particular level of cell-cell adhesion (0.5% arabinose). RbmA-mediated cell-cell adhesion gives rise to an attractive part (red), acting within the range of the experimentally determined average cell-cell distance (dashed cell). d, Best-fit simulation parameters for varying RbmA and arabinose concentrations (black dots) follow a line in (v, λa, λa, ρa)-parameter space and cross isosurfaces of average cell-cell distance (see colour bar, and compare with panel a; for more details about the fitting see Supplementary Fig. 23). The RbmA level of the WT* biofilms is inferred in terms of an effective arabinose concentration by locating the WT* along the line of different arabinose concentrations (blue point), which is very close to the best fit of the WT* (red point). e, Simulated (best fit) vs. experimental WT* biofilm. f, Comparison of biofilm architectural properties for the WT* experiment (blue) and the WT* simulation prediction (yellow). The architectural properties are spatially resolved for the core (left) and shell (right) of the biofilm (experiment: n = 7; simulation: n = 10). g,h, Simulation predictions of large (Ncells = 1000) WT* biofilms (based on the WT*-interaction potential calibrated with Ncells < 300) show quantitative (g) and qualitative (h) agreement with experiments (experiment: n = 4; simulation: n = 10). All error bars correspond to standard errors.
Figure 3
Figure 3. Biofilm architecture is shaped by external shear flow.
a, WT* biofilms grown under strong shear (γ˙=2000s-1) display droplet-like shapes. Inset: Biovolume flux field inside the biofilm (see Supplementary Information). b, WT* biofilms in high shear (γ˙=2000s-1) display strong alignment with flow throughout growth, yet biofilms grown in flow with low shear (γ˙=2200s-1) do not show strong architectural modifications. c, Quantification of the effect of shear on biofilm architecture: measurements of cellular alignment with flow, cell-cell distance, and cell growth rate at the bottom and top of biofilms with sizes of Ncells ~800 cells show that WT* biofilms in high shear are smaller, more compact, and display stronger flow-alignment. Statistical significance: * is p < 0.05 and ** is p < 0.01 (t-test); error bars are standard error (n = 4 biofilms, error bars: standard errors). d, Simulated shear stress distribution for a WT* biofilm, demonstrating that the region of highest shear is at the top of the biofilm. The streamlines indicate the profile of the external flow. e, Biofilm aspect ratio (height/width) increases in time for WT* (red) biofilms, but decreases for ΔrbmA mutant biofilms (blue) in high flow owing to shear-induced erosion (n = 4, error bars: standard deviations). f, Biomass shift is defined as the fraction of the average total biomass flux through planes parallel (‖) or perpendicular (⊥) to flow (see Supplementary Fig. 2 for details). Positive biomass shift along the flow direction at higher shear rates indicates anisotropic biofilm expansion towards the downstream direction of the external flow. Zero biomass shift perpendicular to the flow indicates no directional bias (n ≥ 3, error bars: standard errors). g, The tensorial nematic order parameter (Q-tensor, see Supplementary Information) and cellular alignment with the flow direction were measured at equally spaced points inside biofilms at low and high shear rates, indicating the regions in which cells are predominantly aligned with the flow and each other. h, Biofilm volumetric growth for ΔrbmA mutant biofilms is captured by a continuum model (see Supplementary Information) with varying ratios of shear-induced erosion and cell-cell adhesion (experiment: n = 4, error bars: standard deviations).

References

    1. Zhou S, Sokolov A, Lavrentovich OD, Aranson IS. Living liquid crystals. Proc Natl Acad Sci USA. 2014;111:1265–1270. - PMC - PubMed
    1. Hagan MF, Baskaran A. Emergent self-organization in active materials. Curr Opin Cell Biol. 2016;38:74–80. - PubMed
    1. Doostmohammadi A, Adamer MF, Thampi SP, Yeomans JM. Stabilization of active matter by flow-vortex lattices and defect ordering. Nat Commun. 2016;7:1–9. - PMC - PubMed
    1. Volfson D, Cookson S, Hasty J, Tsimring LS. Biomechanical ordering of dense cell populations. Proc Natl Acad Sci USA. 2008;105:15346–15351. - PMC - PubMed
    1. Drescher K, et al. Architectural transitions in Vibrio cholerae biofilms at single-cell resolution. Proc Natl Acad Sci USA. 2016;113:E2066–E2072. - PMC - PubMed