. 2019 May 14:9:393.
doi: 10.3389/fonc.2019.00393. eCollection 2019.

The Oncogene IARS2 Promotes Non-small Cell Lung Cancer Tumorigenesis by Activating the AKT/MTOR Pathway

Affiliations

The Oncogene IARS2 Promotes Non-small Cell Lung Cancer Tumorigenesis by Activating the AKT/MTOR Pathway

Xin Di et al. Front Oncol. .

Abstract

A limited number of studies have indicated an association between isoleucyl-tRNA synthetase 2 (IARS2) and tumorigenesis. We evaluated IARS2 protein expression in lung tumor tissues and paired non-tumor tissues. We found higher IARS2 expression in the tumor tissues, which was associated with the late Tumor and Node stages of the Tumor, Node, Metastasis staging system. Silencing IARS2 inhibited the activity of A549 and H1299 cells, resulting in G0/G1 stasis of A549 cells and mitochondrial apoptosis. IARS2 silencing was also found to inhibit NSCLC tumor growth in nude mice. Complementary DNA microarray analysis revealed 742 differentially expressed genes (507 upregulated and 235 downregulated) in IARS2-silenced A549 cells compared to controls. Ingenuity Pathway Analysis of the differential expression data suggested that multiple pathways are associated with IARS2 silencing in NSCLC cells; upstream analysis predicted the activation or inhibition of transcriptional regulators. Correlation analysis revealed that AKT and MTOR activities were significantly inhibited in IARS2-silenced cells, but were partially restored by the AKT-stimulating agent SC79. IARS2 appears to regulate lung cancer cell proliferation via the AKT/MTOR pathway. Our results help clarify the complex roles of IARS2 in tumorigenesis and suggest that it may be a novel regulator of lung cancer development.

Keywords: AKT; cDNA microarray; ingenuity pathway analysis; isoleucyl-tRNA synthetase 2; lung cancer; mammalian target of rapamycin; tumorigenesis.


Figures

Figure 1
Figure 1
Western blotting of IARS2 protein expression in representative tissue samples from NSCLC (T) and non-tumor specimens (N). Total protein was extracted, subjected to western blotting analysis, and quantified using Image J software. (A) Squamous cell carcinoma tissue. (B) Adenocarcinoma tissue.
Figure 2
Figure 2
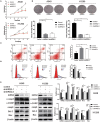
Effects of IARS2 knockdown on cell proliferation, cell cycle progression and apoptosis in NSCLC cells. (A) Cell Counting Kit-8 assay was used to evaluate A549 and H1299 cell growth after IARS2 knockdown. (B) Colony formation assay was used to evaluate A549 and H1299 cell growth after IARS2 knockdown. (C) Apoptosis was evaluated using flow cytometry in IARS2 knockdown and control A549 cells. Representative flow-cytograms are shown, and apoptotic rates were derived as percentages of Annexin V-PE positive cells. (D) Cell cycle was assessed in A549 cells using flow cytometry after transfection with the indicated shRNAs. Representative flow-cytograms are shown, as well as diagrams quantifying cell fractions in the G0/G1, S, and G2/M phases. (E) Differential expression of apoptosis regulatory proteins associated with IARS2 knockdown. Western blotting analysis was performed to compare expression levels of various apoptosis-related proteins between the IARS2 and control groups. *p < 0.05 compared with the control group.
Figure 3
Figure 3
Heat map of the 2-way hierarchical clustering of genes and samples. Each row represents a gene and each column represents a sample. The gene clustering tree is shown on the left and the sample clustering tree appears at the top. Red, up-regulated in the IARS2-silenced vs. control cells; green down-regulated in the IARS2-silenced vs. control cells.
Figure 4
Figure 4
(A) Classical pathway enrichment analysis. The orange label indicates pathway activation (z-score >0), the blue label indicates pathway suppression (z-score < 0), and the shades of orange and blue indicate the degree of activation or inhibition (the absolute value of the z-score). The ratio represents the number of differentially expressed genes in this signaling pathway and the number of all genes in the pathway. (B) Disease and functional enrichment analysis statistics. This figure shows the differentially expressed genes in the IARS2-silenced cells that are significantly enriched in disease and function. The abscissa is the name of the path and the ordinate is the level of significance of the enrichment (the negative logarithm of the base 10).
Figure 5
Figure 5
Disease and function heat map. This figure demonstrates the relationships between changes in differentially expressed gene levels and the activation and inhibition of diseases and functions. Orange indicates that the disease or functional status is activated (z-score >0), blue indicates that the disease or functional status is suppressed (z-score < 0), and gray indicates that the disease or functional status was not determined (z-score cannot be calculated).
Figure 6
Figure 6
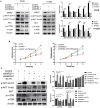
Correlation between IARS2 and AKT/MTOR signaling. (A) IARS2 activated AKT/MTOR signaling in A549 and H1299 cells. (B,C) The AKT activator SC79 partially restored AKT/MTOR signaling in A549 cells. CCK-8 assays and western blotting were performed to determine protein phosphorylation status after exposure to SC79 (5 μg/mL; 48 and 1 h, respectively). *, #p < 0.05. (*comparison with the control group; #comparison with the applied sc79 group).
Figure 7
Figure 7
IARS2 silencing inhibits tumor growth in vivo. (A) Xenografts from mice in each group. (B) Tumor volumes were measured at the indicated times. (C) Mean weights of tumors obtained from mice. *p < 0.05 compared with the control group. (D)Western blotting analyses of protein expression in tumour tissues.

References

    1. Bray F, Ferlay J, Soerjomataram I, Siegel RL, Torre LA, Jemal A. Global cancer statistics 2018: GLOBOCAN estimates of incidence and mortality worldwide for 36 cancers in 185 countries. CA Cancer J Clin. (2018) 68:394–424. 10.3322/caac.21492 - DOI - PubMed
    1. McIntyre A, Ganti AK. Lung cancer-A global perspective. J Surg Oncol. (2017) 115:550–4. 10.1002/jso.24532 - DOI - PubMed
    1. Cheng TY, Cramb SM, Baade PD, Youlden DR, Nwogu C, Reid ME. The international epidemiology of lung cancer: latest trends, disparities, and tumor characteristics. J Thorac Oncol. (2016) 11:1653–71. 10.1016/j.jtho.2016.05.021 - DOI - PMC - PubMed
    1. Brown MV, Reader JS, Tzima E. Mammalian aminoacyl-tRNA synthetases: cell signaling functions of the protein translation machinery. Vascul Pharmacol. (2010) 52:21–6. 10.1016/j.vph.2009.11.009 - DOI - PubMed
    1. Kim S, You S, Hwang D. Aminoacyl-tRNA synthetases and tumorigenesis: more than housekeeping. Nat Rev Cancer. (2011) 11:708–18. 10.1038/nrc3124 - DOI - PubMed