. 2018 Jun;2(6):172-181.
doi: 10.1029/2018GH000136. Epub 2018 May 23.

Impact of California Fires on Local and Regional Air Quality: The Role of a Low-Cost Sensor Network and Satellite Observations

Affiliations

Impact of California Fires on Local and Regional Air Quality: The Role of a Low-Cost Sensor Network and Satellite Observations

P Gupta et al. Geohealth. 2018 Jun.

Abstract

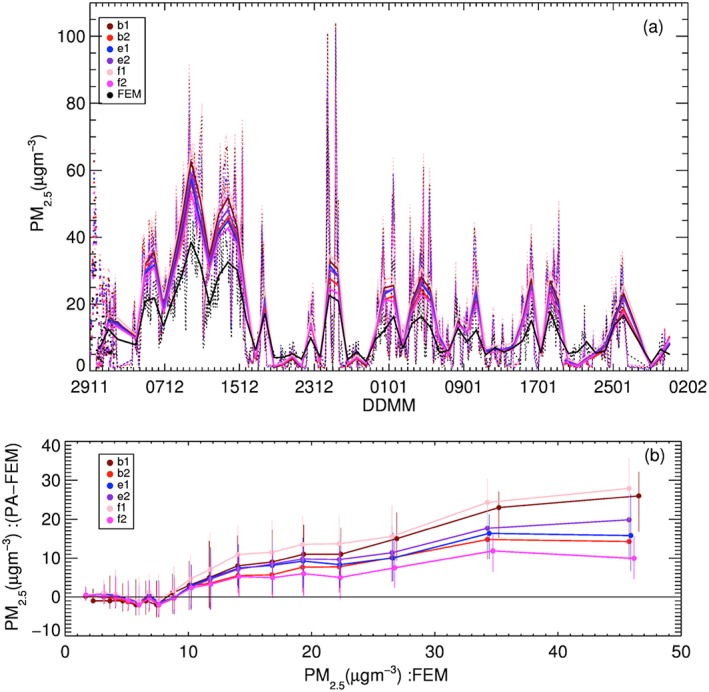
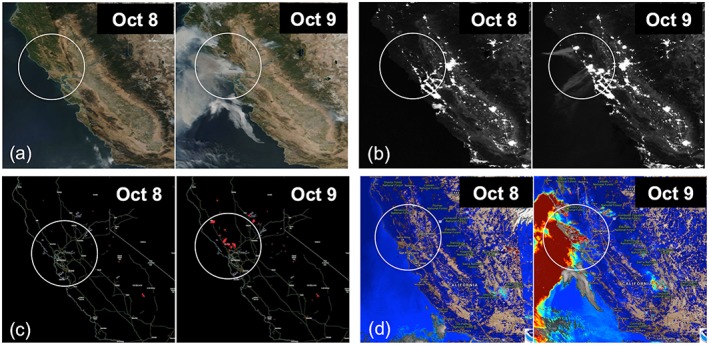
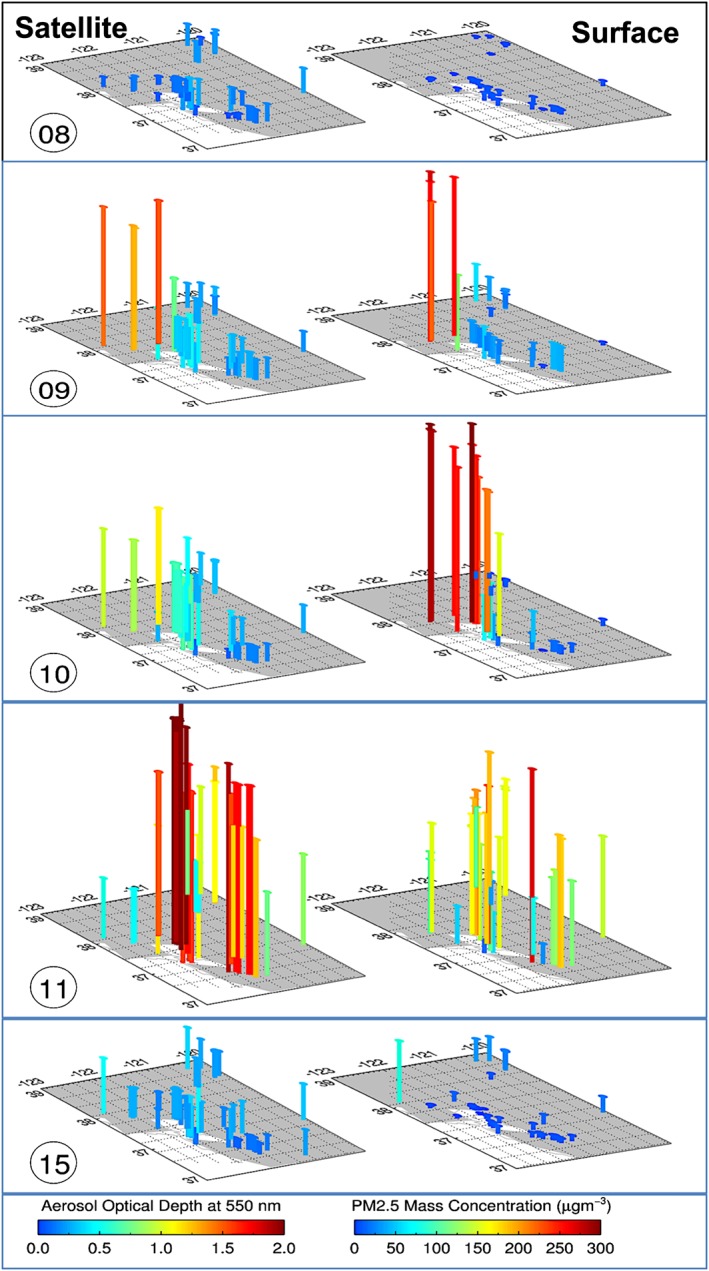
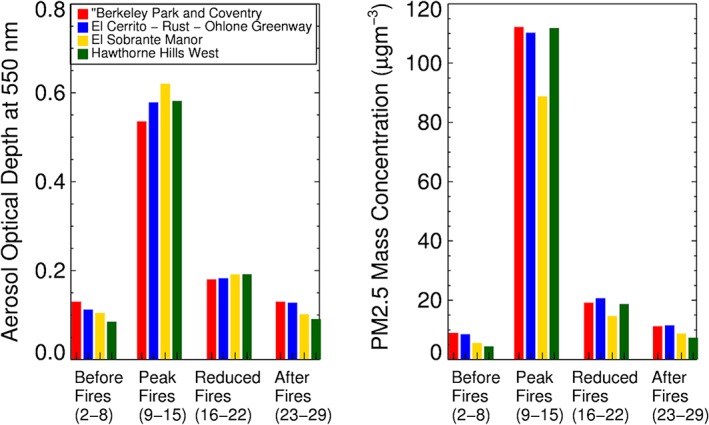
PM2.5, or fine particulate matter, is a category of air pollutant consisting of particles with effective aerodynamic diameter equal to or less than 2.5 μm. These particles have been linked to human health impacts as well as regional haze, visibility, and climate change issues. Due to cost and space restrictions, the U.S. Environmental Protection Agency monitoring network remains spatially sparse. To increase the spatial resolution of monitoring, previous studies have used satellite data to estimate ground-level PM concentrations, despite these estimates being associated with moderate to large uncertainties when relating a column measure of aerosol (aerosol optical depth) with surface measurements. To this end, we discuss a low-cost air quality monitor (LCAQM) network deployed in California. In this study, we present an application of LCAQM and satellite data for quantifying the impact of wildfires in California during October 2017. The impacts of fires on PM2.5 concentration at varying temporal (hourly, daily, and weekly) and spatial (local to regional) scales have been evaluated. Comparison between low-cost air quality sensors and reference-grade air quality instruments shows expected performance with moderate to high uncertainties. The LCAQM measurements, in the absence of federal equivalent method data, were also found to be very useful in developing statistical models to convert aerosol optical depth into PM2.5 with performance of satellite-derived PM2.5, similar to that obtained using the federal equivalent method data. This paper also highlights challenges associated with both LCAQM and satellite-based PM2.5 measurements, which require further investigation and research.


Figures

Figure 1
Figure 1
Intercomparison between PA‐II and FEM measurements of PM2.5 (a) hourly (dotted lines) and daily (solid line) mean PM2.5 from six different PA‐II nodes and FEM (black) over 8 weeks of field testing in the South Coast Air Quality Management District facility; (b) Bin‐averaged bias in PM2.5 from PA‐II nodes as a function of PM2.5 values from FEM. The three PA‐II units contained six sensors, identified as b1, b2, e1, e2, f1, and f2. PA = PurpleAir; FEM = federal equivalent method.
Figure 2
Figure 2
The figures show images by Visible Infrared Imaging Radiometer Suite taken on 8 October (before the fires started) and 9 October (after the fires started) in Northern CA. The observation presented here includes (a) RGB images, (b) Visible Infrared Imaging Radiometer Suite night lights, (c) thermal anomaly or fire detection, and (d) aerosol optical depth at 550 nm. The RGB, night lights, and fire images are obtained from National Aeronautics and Space Administration's worldview, whereas aerosol optical depth images were obtained from National Oceanic and Atmospheric Administration's e‐IDEA tool.
Figure 3
Figure 3
Time series of aerosol optical depth and PM2.5 in Bay Area before, during, and after, the fires. The left panels show Moderate resolution Imaging Spectroradiometer‐Aqua aerosol optical depths and the right panels show PM2.5 from low‐cost air quality monitor. The number inside the circle shows date in October 2017. The date 8 October is before fire, 9–11 October is during the fire, and 15 October is toward the end of the fires.
Figure 4
Figure 4
The impact of fires on local air quality conditions at weekly scale. The bar charts show weekly averaged aerosol optical depth (left) and PM2.5 (right) at selected low‐cost air quality monitor locations close to fires in Northern CA. These stations are located southeast of fires.
Figure 5
Figure 5
Aerosol optical depth‐PM2.5 relationship and satellite estimated PM2.5 in California over low‐cost air quality monitor (LCAQM) and EPA networks. (a) Linear correlation coefficient (R) over LCAQM; (b) Number of collocated aerosol optical depth‐PM2.5 pairs over LCAQM; (c, d) EPA measured weekly averaged PM2.5 before the fires started (1–8 October) and during the fires (9–16 October); (e,f) Satellite estimated PM2.5 over EPA network for the same period as in (c) and (d); and (g,h) Satellite estimated PM2.5 showing regional distribution before and during fires. EPA = Environmental Protection Agency.

References

    1. Black, C. , Tesfaigzi, Y. , Bassein, J. A. , & Miller, L. A. (2017). Wildfire smoke exposure and human health: Significant gaps in research for a growing public health issue. Environmental Toxicology and Pharmacology, 55, 186–195. 10.1016/j.etap.2017.08.022 - DOI - PMC - PubMed
    1. Buchard, V. , da Silva, A. M. , Colarco, P. R. , Darmenov, A. , Randles, C. A. , Govindaraju, R. , et al. (2015). Using the OMI aerosol index and absorption aerosol optical depth to evaluate the NASA MERRA aerosol reanalysis. Atmospheric Chemistry and Physics, 15(10), 5743–5760. 10.5194/acp-15-5743-2015 - DOI
    1. CALFIRE (2017, October 30, 2017). California statewide fire summary. Retrieved from http://calfire.ca.gov/communications/communications_StatewideFireSummary
    1. Cascio, W. E. (2018). Wildland fire smoke and human health. Science of the Total Environment, 624, 586–595. 10.1016/j.scitotenv.2017.12.086 - DOI - PMC - PubMed
    1. Fann, N. , Alman, B. , Broome, R. A. , Morgan, G. G. , Johnston, F. H. , Pouliot, G. , & Rappold, A. G. (2018). The health impacts and economic value of wildland fire episodes in the U.S.: 2008–2012. Science of the Total Environment, 610‐611, 802–809. 10.1016/j.scitotenv.2017.08.024 - DOI - PMC - PubMed

LinkOut - more resources