

FUNDUS AUTOFLUORESCENCE PATTERNS IN CENTRAL SEROUS CHORIORETINOPATHY
- PMID: 31157711
- PMCID: PMC7302330
- DOI: 10.1097/IAE.0000000000002580
FUNDUS AUTOFLUORESCENCE PATTERNS IN CENTRAL SEROUS CHORIORETINOPATHY
Abstract
Purpose: To investigate the patterns of fundus autofluorescence (FAF) abnormalities in patients with central serous chorioretinopathy (CSC).
Methods: This cross-sectional observational study included 126 eyes of 118 patients who were diagnosed with central serous chorioretinopathy from December 2006 to April 2012 at Kyung Hee University Hospital, Seoul, Korea. Fundus autofluorescence patterns were analyzed with spectral domain optical coherence tomography and visual acuity.
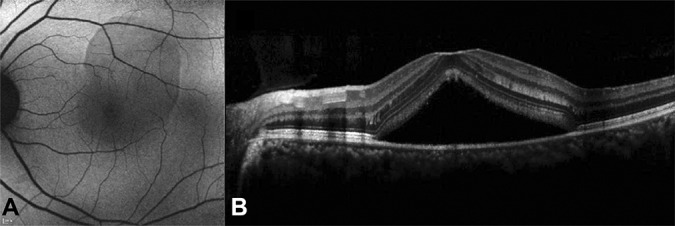
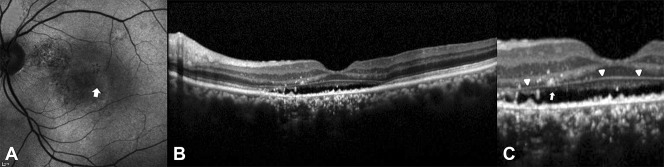
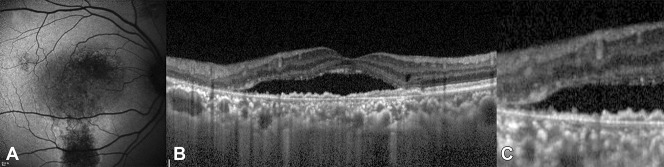
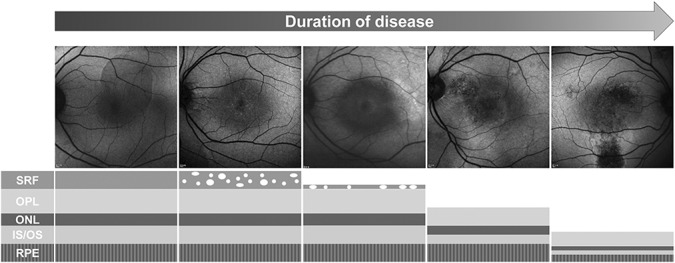
Results: Fundus autofluorescence patterns were grouped as blocked (38.9%), mottled (8.7%), hyper (31.0%), hyper/hypo (13.5%), or descending tract (8.0%). The duration of symptoms was 7.8 (±20.4), 28.3 (±31.8), 42.5 (±69.1), 163.8 (±183.5), and 174.5 (±162.3) days in the blocked, mottled, hyper, descending tract, and hyper/hypo groups, respectively (P < 0.001). The blocked FAF group had the best visual acuity (P = 0.011). The intact ellipsoid zone on the spectral domain optical coherence tomography was mostly found in the blocked FAF group (P < 0.001), and the disrupted ellipsoid zone was commonly exhibited in the hyper/hypo and descending tract groups. Disrupted external limiting membrane line on the spectral domain optical coherence tomography was seen in two patients of the descending tract group only.
Conclusion: The FAF abnormalities in central serous chorioretinopathy show multiple patterns and are related with the chronicity and visual acuity. Fundus autofluorescence patterns in central serous chorioretinopathy are helpful when considering the timing of treatment and predicting the disease status.
Conflict of interest statement
None of the authors has any financial/conflicting interests to disclose.
Figures


Similar articles
-
Central serous chorioretinopathy fundus autofluorescence comparison with two different confocal scanning laser ophthalmoscopes.Graefes Arch Clin Exp Ophthalmol. 2015 Dec;253(12):2121-7. doi: 10.1007/s00417-015-2958-6. Epub 2015 Feb 18. Graefes Arch Clin Exp Ophthalmol. 2015. PMID: 25690981
-
THE EFFECT OF PHOTOPIGMENT BLEACHING ON FUNDUS AUTOFLUORESCENCE IN ACUTE CENTRAL SEROUS CHORIORETINOPATHY.Retina. 2017 Mar;37(3):568-577. doi: 10.1097/IAE.0000000000001170. Retina. 2017. PMID: 27429375
-
FUNDUS AUTOFLUORESCENCE LIFETIMES AND CENTRAL SEROUS CHORIORETINOPATHY.Retina. 2017 Nov;37(11):2151-2161. doi: 10.1097/IAE.0000000000001452. Retina. 2017. PMID: 28099314 Free PMC article. Clinical Trial.
-
Central Serous Chorioretinopathy.Dev Ophthalmol. 2017;58:27-38. doi: 10.1159/000455267. Epub 2017 Mar 28. Dev Ophthalmol. 2017. PMID: 28351043 Review.
-
Morphologic features of large choroidal vessel layer: age-related macular degeneration, polypoidal choroidal vasculopathy, and central serous chorioretinopathy.Graefes Arch Clin Exp Ophthalmol. 2018 Dec;256(12):2309-2317. doi: 10.1007/s00417-018-4143-1. Epub 2018 Sep 27. Graefes Arch Clin Exp Ophthalmol. 2018. PMID: 30259090 Review.
Cited by
-
Short-Wavelength and Infrared Autofluorescence Imaging in Pachychoroid Neovasculopathy.Vision (Basel). 2025 Apr 21;9(2):38. doi: 10.3390/vision9020038. Vision (Basel). 2025. PMID: 40265406 Free PMC article.
-
Dark-Field Scanning Laser Ophthalmoscopy for Prediction of Central Serous Chorioretinopathy Responsiveness to Laser Therapy.J Curr Ophthalmol. 2022 Jan 6;33(4):461-467. doi: 10.4103/joco.joco_257_21. eCollection 2021 Oct-Dec. J Curr Ophthalmol. 2022. PMID: 35128195 Free PMC article.
-
Central Serous Chorioretinopathy by Autofluorescence, Enface and SLO-Retromode Imaging.Life (Basel). 2023 Jun 17;13(6):1407. doi: 10.3390/life13061407. Life (Basel). 2023. PMID: 37374191 Free PMC article.
-
Association between subretinal fluid duration in central serous chorioretinopathy and chorioretinal structure in unaffected fellow eyes.Sci Rep. 2025 Mar 31;15(1):10977. doi: 10.1038/s41598-025-95725-0. Sci Rep. 2025. PMID: 40164826 Free PMC article.
-
Association of Near-Infrared and Short-Wavelength Autofluorescence With the Retinal Sensitivity in Eyes With Resolved Central Serous Chorioretinopathy.Invest Ophthalmol Vis Sci. 2021 Mar 1;62(3):36. doi: 10.1167/iovs.62.3.36. Invest Ophthalmol Vis Sci. 2021. PMID: 33764400 Free PMC article.
References
-
- Gass JD. Pathogenesis of disciform detachment of the neuroepithelium. Am J Ophthalmol 1967;63:1–139. - PubMed
-
- Ojima Y, Hangai M, Sasahara M, et al. Three-dimensional imaging of the foveal photoreceptor layer in central serous chorioretinopathy using high-speed optical coherence tomography. Ophthalmology 2007;114:2197–2207. - PubMed
Publication types
MeSH terms
LinkOut - more resources
Full Text Sources
Miscellaneous
