

Plasma Glycosaminoglycans as Diagnostic and Prognostic Biomarkers in Surgically Treated Renal Cell Carcinoma
- PMID: 31158075
- PMCID: PMC8253162
- DOI: 10.1016/j.euo.2018.04.015
Plasma Glycosaminoglycans as Diagnostic and Prognostic Biomarkers in Surgically Treated Renal Cell Carcinoma
Abstract
Background: Plasma glycosaminoglycan (GAG) measurements, when aggregated into diagnostic scores, accurately distinguish metastatic clear-cell renal cell carcinoma (RCC) from healthy samples and correlate with prognosis. However, it is unknown if GAG scores can detect RCC in earlier stages or if they correlate with prognosis after surgery.
Objective: To explore the sensitivity and specificity of plasma GAGs for detection of early-stage RCC and prediction of recurrence and death after RCC surgery.
Design, setting, and participants: This was a retrospective case-control study consisting of a consecutive series of 175 RCC patients surgically treated between May 2011 and February 2014 and 19 healthy controls.
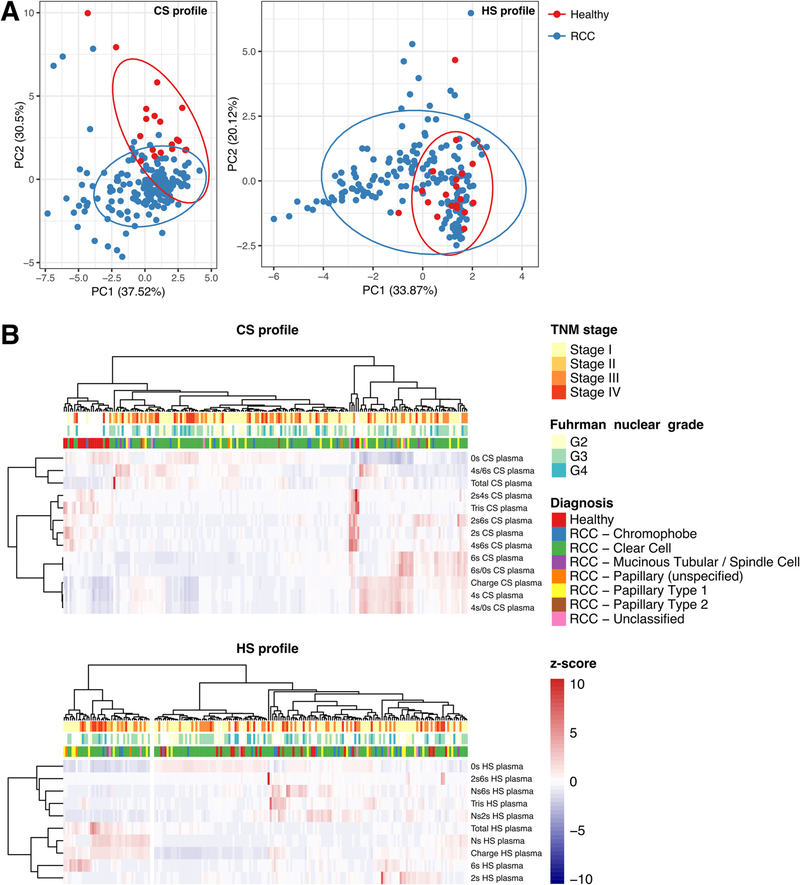
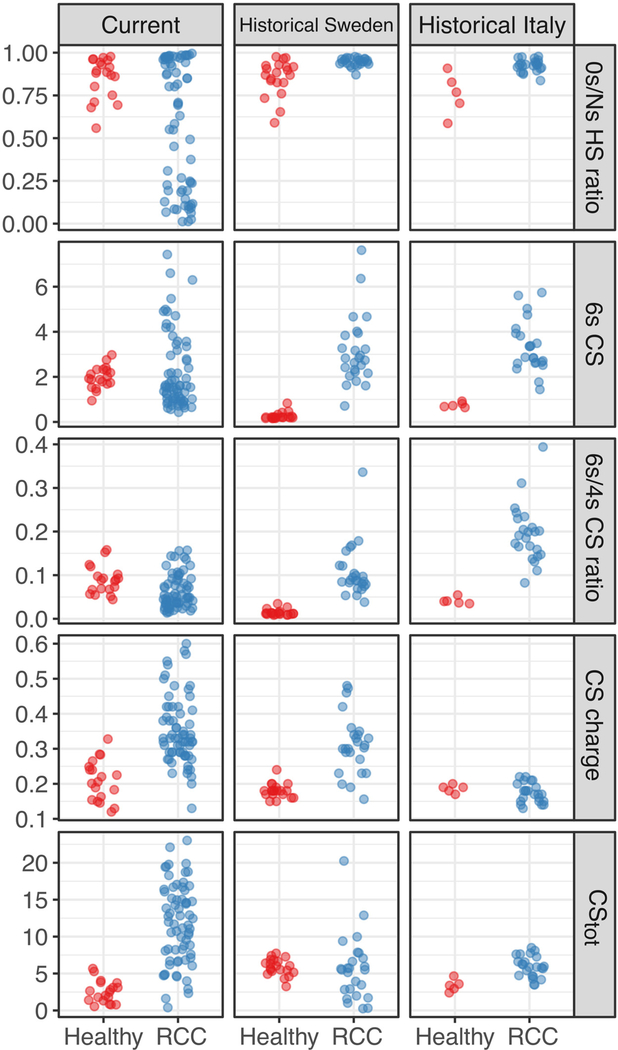
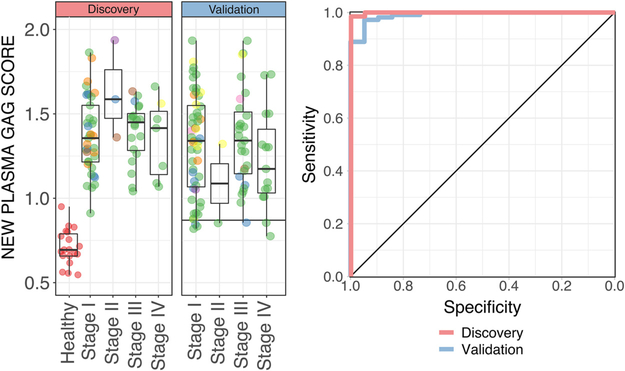
Outcome measurements and statistical analysis: Plasma GAGs in preoperative and postoperative RCC and healthy samples were measured using capillary electrophoresis with laser-induced fluorescence in a single blinded laboratory. A discovery set was first analyzed to update the historical GAG score. The sensitivity of the new GAG score for RCC detection versus healthy subjects was validated using the remaining samples. The correlation of the new GAG score to histopathologic variables, overall survival, and recurrence-free survival was evaluated using nonparametric and log-rank tests and multivariable Cox regression analyses.
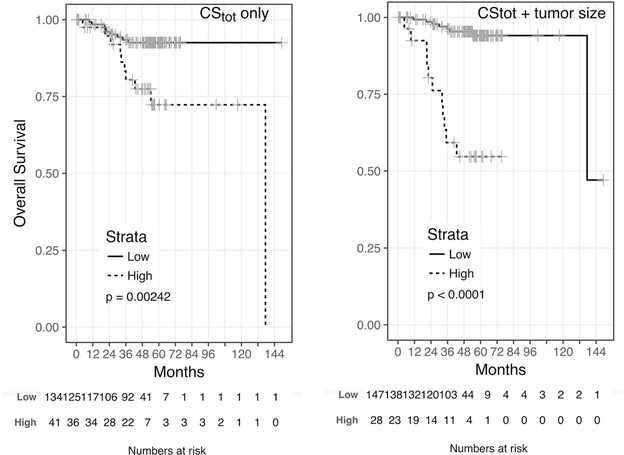
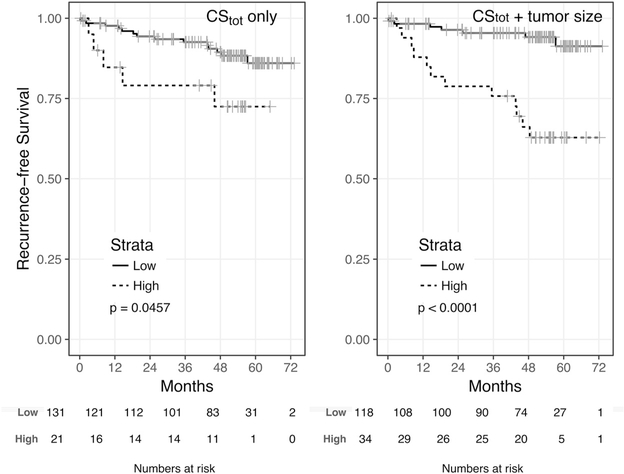
Results and limitations: The RCC cohort included 94 stage I, 58 stage II-III, and 22 stage IV cases. In the first discovery set (n=67), the new GAG score distinguished RCC from healthy samples with an area under the receiver operating characteristic curve (AUC) of 0.999. In the validation set (n=108), the GAG score achieved an AUC of 0.991, with 93.5% sensitivity. GAG scores were elevated in RCC compared to healthy samples, irrespective of and uncorrelated to stage, grade, histology, age, or gender. The total chondroitin sulfate concentration was an independent prognostic factor for both overall and recurrence-free survival (hazard ratios 1.51 and 1.25) with high concordance when combined with variables available at pathologic diagnosis (C-index 0.926 and 0.849) or preoperatively (C-index 0.846 and 0.736). Limitations of the study include its retrospective nature and moderate variability in GAG laboratory measurements.
Conclusions: Plasma GAGs are highly sensitive diagnostic and prognostic biomarkers in surgically treated RCC independent of stage, grade, or histology. Prospective validation studies on GAG scores for early detection, prediction, and surveillance for RCC recurrence are thus warranted.
Patient summary: In this study, we examined if a new molecular blood test can detect renal cell carcinoma in the early stages and predict if the cancer might relapse after surgery. The trial is registered on ClinicalTrial.gov as NCT03471897.
Keywords: Diagnostic biomarkers; Liquid biopsy; Prognostic biomarkers; Renal cell carcinoma.
Copyright © 2018 European Association of Urology. Published by Elsevier B.V. All rights reserved.
Figures
References
-
- Ferlay J, Soerjomataram I, Dikshit R, et al. Cancer incidence and mortality worldwide: sources, methods and major patterns in GLOBOCAN 2012. Int J Cancer 2015;136:E359–86. - PubMed
-
- Belldegrun AS, Klatte T, Shuch B, et al. Cancer-specific survival outcomes among patients treated during the cytokine era of kidney cancer (1989–2005): a benchmark for emerging targeted cancer therapies. Cancer 2008;113:2457–63. - PubMed
-
- Dabestani S, Thorstenson A, Lindblad P, et al. Renal cell carcinoma recurrences and metastases in primary non-metastatic patients: a population-based study. World J Urol 2016;34:1081–6. - PubMed
-
- Kuijpers YA, Meijer RP, Jonges GN, et al. Potentially curable recurrent disease after surgically managed non-metastatic renal cell carcinoma in low-, intermediate- and high-risk patients. World J Urol 2016;34:1073–9. - PubMed
Publication types
MeSH terms
Substances
Associated data
Grants and funding
LinkOut - more resources
Full Text Sources
Other Literature Sources
Medical
