. 2019 Jun 3;15(6):e1007092.
doi: 10.1371/journal.pcbi.1007092. eCollection 2019 Jun.

Emergent decision-making behaviour and rhythm generation in a computational model of the ventromedial nucleus of the hypothalamus

Affiliations

Emergent decision-making behaviour and rhythm generation in a computational model of the ventromedial nucleus of the hypothalamus

Duncan J MacGregor et al. PLoS Comput Biol. .

Abstract

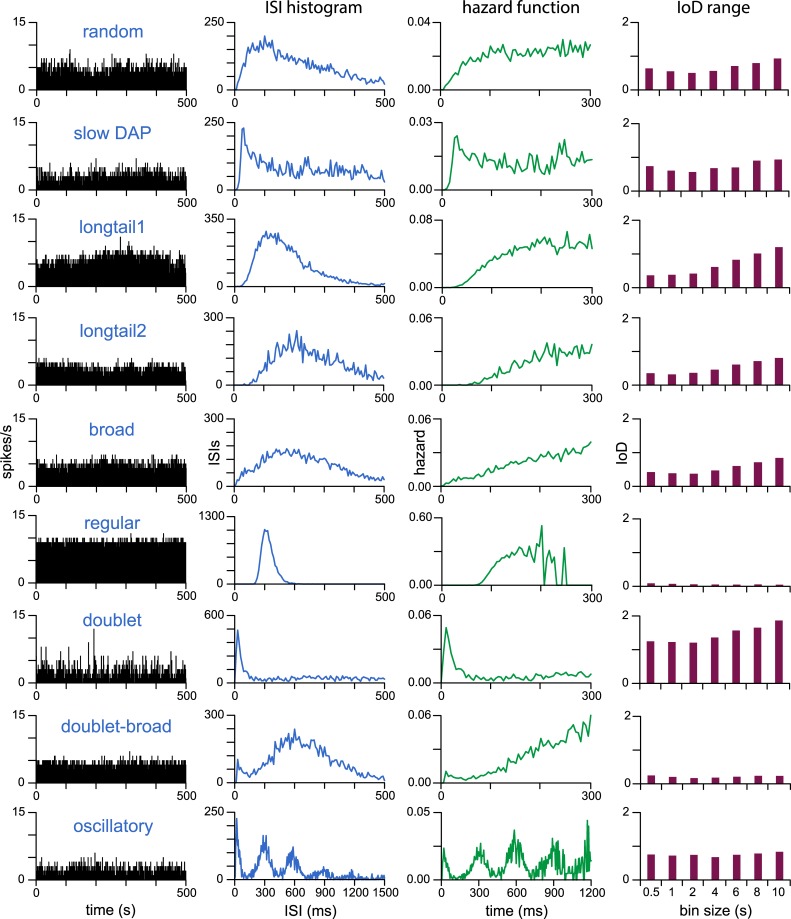
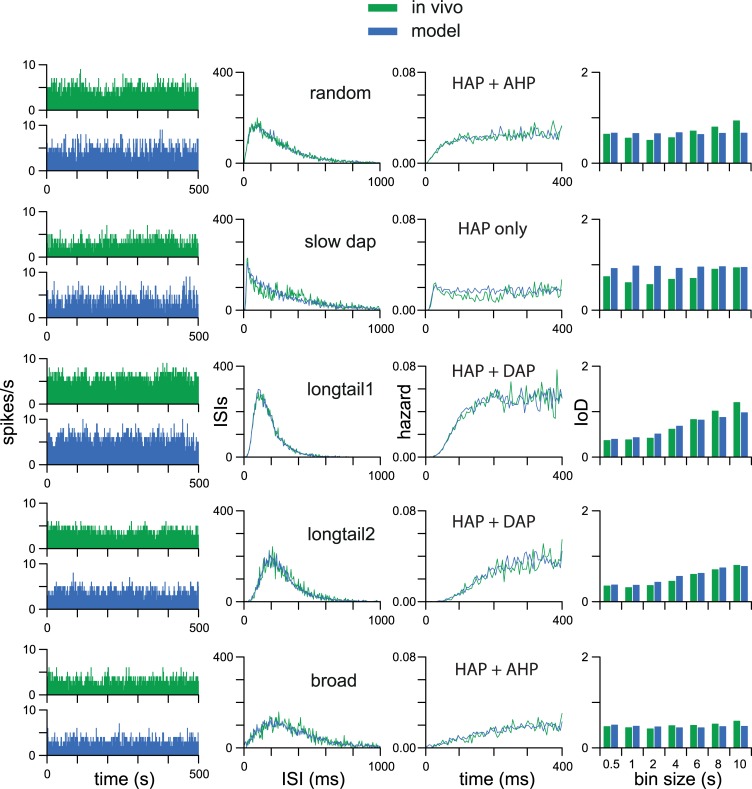
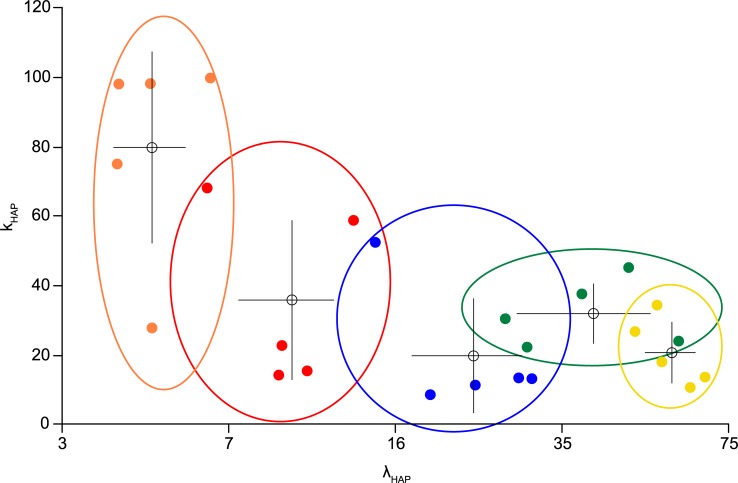
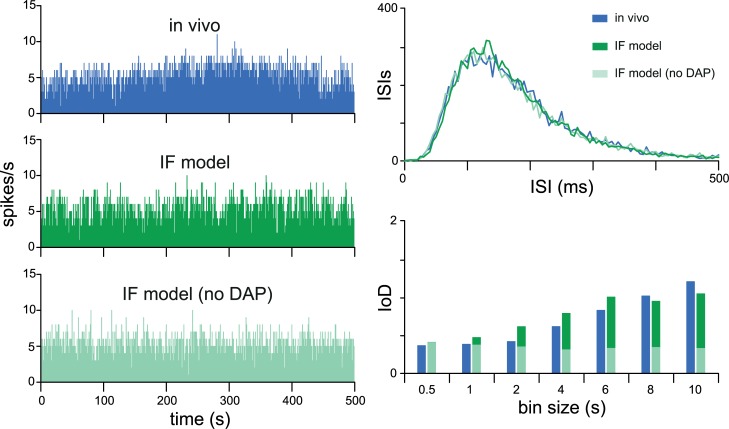
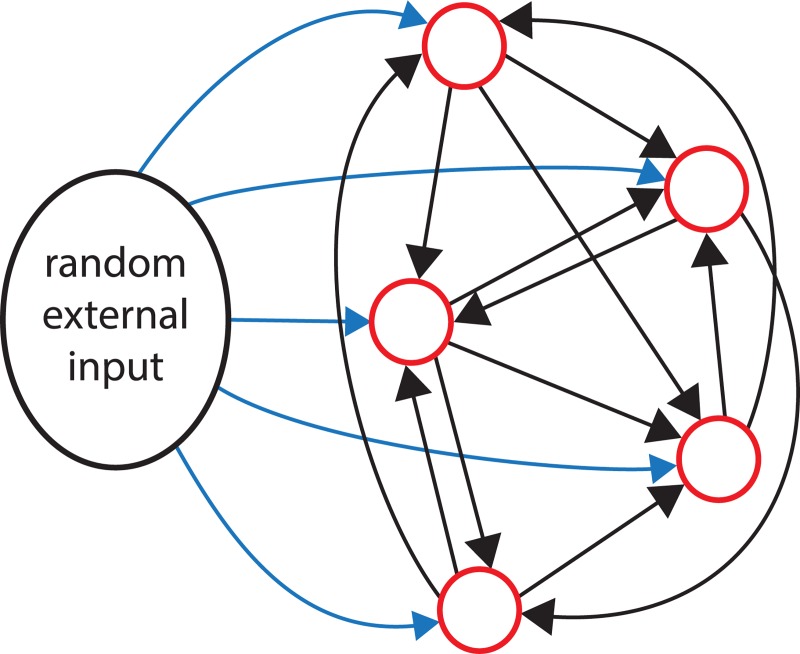
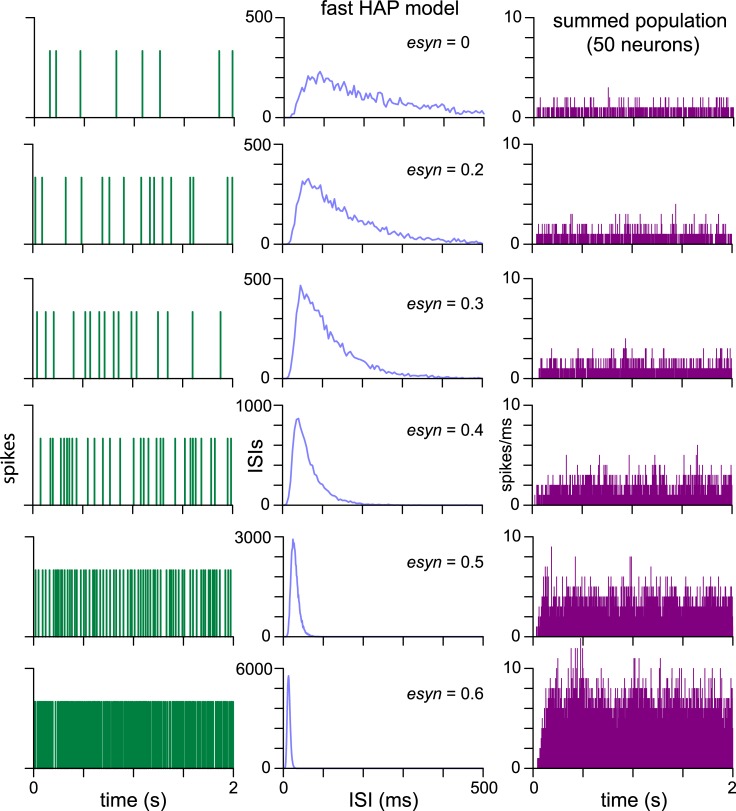
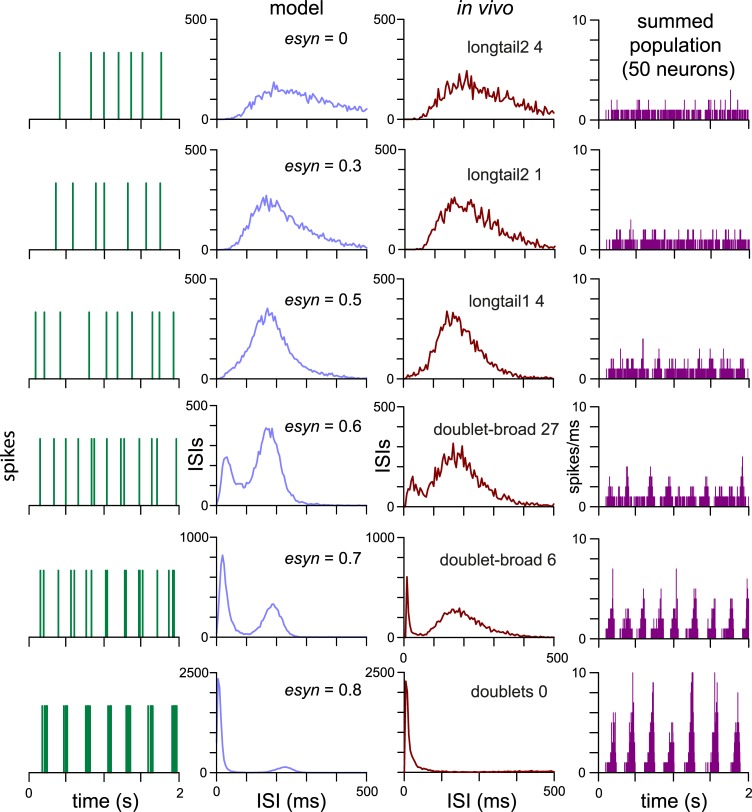
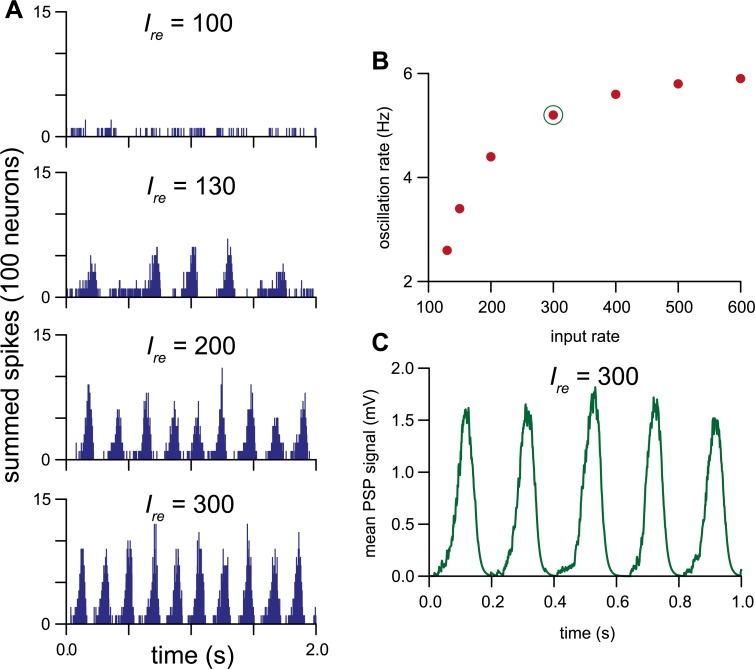
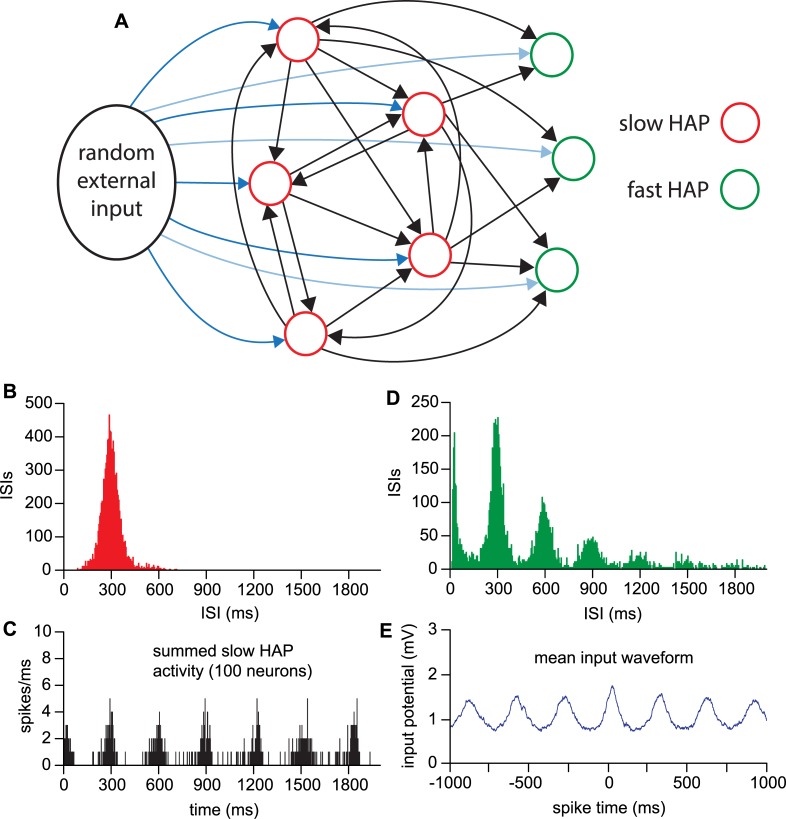
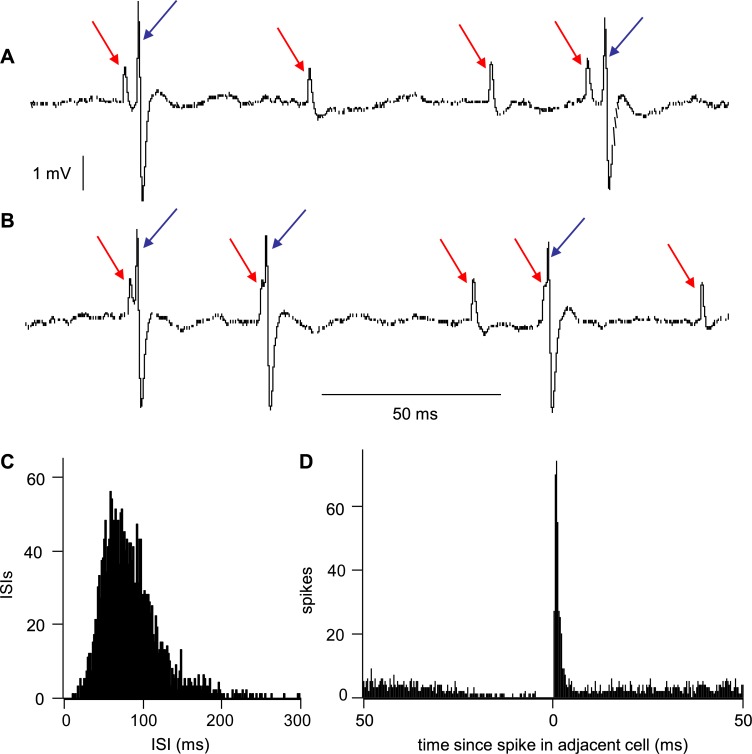
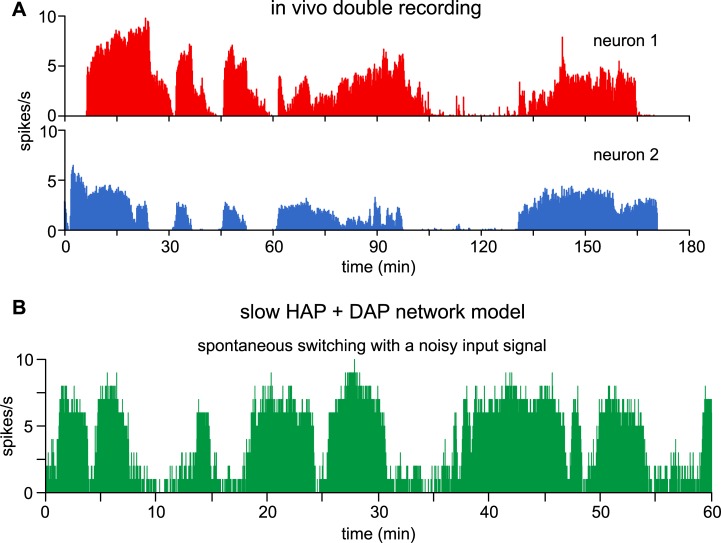
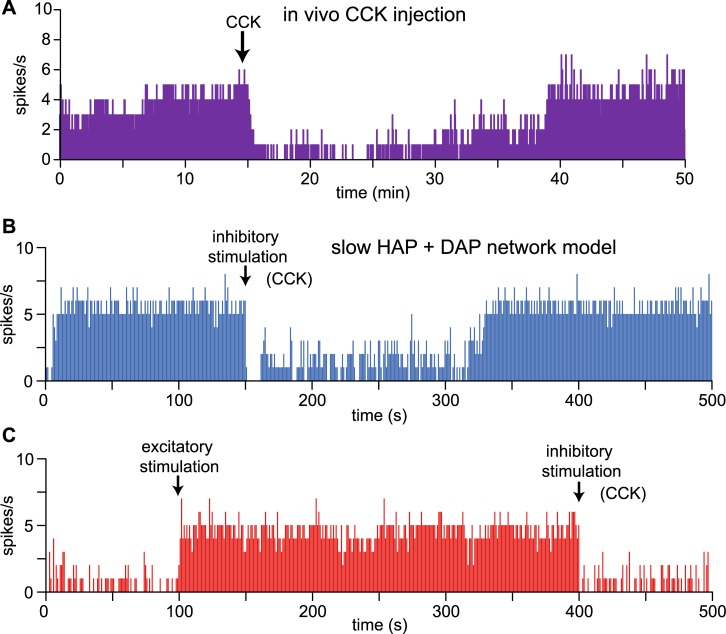
The ventromedial nucleus of the hypothalamus (VMN) has an important role in diverse behaviours. The common involvement in these of sex steroids, nutritionally-related signals, and emotional inputs from other brain areas, suggests that, at any given time, its output is in one of a discrete number of possible states corresponding to discrete motivational drives. Here we explored how networks of VMN neurons might generate such a decision-making architecture. We began with minimalist assumptions about the intrinsic properties of VMN neurons inferred from electrophysiological recordings of these neurons in rats in vivo, using an integrate-and-fire based model modified to simulate activity-dependent post-spike changes in neuronal excitability. We used a genetic algorithm based method to fit model parameters to the statistical features of spike patterning in each cell. The spike patterns in both recorded cells and model cells were assessed by analysis of interspike interval distributions and of the index of dispersion of firing rate over different binwidths. Simpler patterned cells could be closely matched by single neuron models incorporating a hyperpolarising afterpotential and either a slow afterhyperpolarisation or a depolarising afterpotential, but many others could not. We then constructed network models with the challenge of explaining the more complex patterns. We assumed that neurons of a given type (with heterogeneity introduced by independently random patterns of external input) were mutually interconnected at random by excitatory synaptic connections (with a variable delay and a random chance of failure). Simple network models of one or two cell types were able to explain the more complex patterns. We then explored the information processing features of such networks that might be relevant for a decision-making network. We concluded that rhythm generation (in the slow theta range) and bistability arise as emergent properties of networks of heterogeneous VMN neurons.


Conflict of interest statement

The authors have declared that no competing interests exist.

Figures

Fig 1
Fig 1. Neural subtypes in the VMN identified by spike patterning.
Typical examples of each cell type previously identified [20] from 271 in vivo extracellular recordings of the VMN. The left column shows extracts of firing rate in 1-s bins, to the right of these are the corresponding ISI distribution constructed in 10-ms bins over 500 s of spontaneous activity, the corresponding hazard function, and the IoD range. Cells were classified on the basis of ISI analysis. “random”, “slow DAP”, “longtail” (type 1 and 2), and “broad” cells show mostly random patterning subject to varying lengths of post-spike refractory period. “Regular” cells show highly regular spike intervals. “doublet”, “doublet-broad”, and “oscillatory” cells show more complex patterning including short bursts and bimodal ISI histograms. The oscillatory cells have multimodal ISI distributions. Many cells show an increasing IoD range, indicating either a noisy input signal or some positive feedback mechanism, generated either by an intrinsic post-spike depolarisation or network mutual excitation.
Fig 2
Fig 2. Single neuron model fits.
Using automated fitting we produced close matches to the spike patterning of “random”, “slow DAP”, “longtail1”, “longtail2”, and “broad” type VMN neurons, using a single neuron integrate-and-fire based model receiving random synaptic input at a fixed rate. Each row shows a single neuron and its best model fit. The 1-s binned spike rate (1st column) shows the match to spiking rate and variability but not detailed patterning. The fit is measured using a weighted sum of the match to the ISI distribution (2nd column), the hazard function (3rd column), and the IoD range (4th column). The best fits use either just an HAP, an HAP and an AHP, or an HAP and a DAP, indicated in the 3rd column. The early mode in the ISI distribution of the “random” and “slow DAP” type neurons indicates a short refractory period, corresponding with a faster (shorter half-life) HAP fit than in the “longtail1”, “longtail2”, and “broad” type neurons.
Fig 3
Fig 3. HAP parameter range across cell types and single neuron fits.
Each cloud shows five sample fits (each dot a fit) colour coded according to the previously classified VMN cell types (Fig 2). Plotting fits using the HAP fit parameters (kHAP and λHAP), defining the HAP magnitude and half-life, shows a good correlation with cell type. The x-axis is plotted on a natural log scale. The coloured dots show individual cell fits. The white dots and crosses show the mean and standard deviations. The cloud ovals show the range. Longer half-life values tend to correlate with a smaller magnitude. The clouds show overlap, but overall the results are consistent with previous classification, and consistent with the inference that the dominant intrinsic property which differentiates spike patterning across these types is the HAP.
Fig 4
Fig 4. Using a DAP to fit an increasing IoD range.
Noise or variability in the spike rate is measured using the IoD. The presence of a large AHP results in a decreasing IoD range, where variability is less at larger binwidths [21]. An increasing IoD range can be mimicked either by a highly variable input signal, or by the amplification of variability due to the action of a DAP. The green in vivo example here is a “random” type cell which shows an increasing IoD range. The ISI distribution can be closely matched by a model neuron with only an HAP (red data), but to also fit the increasing IoD range requires a model neuron with a DAP as well as an HAP (blue data).
Fig 5
Fig 5. Single cell-type excitatory network.
In this network model, identical model neurons are randomly connected, with a chance of connection from one neuron to another defined by esyn1. Connection can independently go in both directions. Network synaptic transmission is modelled by a single spike generating a single EPSP in connected neurons, subject to random transmission failure (0.5 chance), and fixed random transmission delay within a defined range, usually 5–15 ms. Neurons also receive randomly timed external synaptic input at a defined rate, of mixed EPSPs and IPSPs.
Fig 6
Fig 6. Increasing connection density in an excitatory ‘fast HAP’ network.
Each row illustrates a single network model of 50 slow HAP neurons, with connection probability (esyn1) increasing down the rows. All other neuron model parameters are fixed. In each row, the first and second columns show the spiking and ISI distribution for one neuron in the network. Neurons within each network show very similar patterning, with some small variation due to the random connections and random external input signal. The third column shows the summed activity of all neurons in the network. As esyn1 increases, the spike rate increases, the ISI distribution becomes less skewed and the amplitude of the mode increases, but there is otherwise no change in spike patterning. At higher connectivity the summed population activity (right column) shows the shift from slow to fast spiking sustained by the network.
Fig 7
Fig 7. Increasing connection density in an excitatory ‘slow HAP’ network.
Each row illustrates a single network model of 50 slow HAP neurons, with connection probability (esyn1) increasing down the rows. All other neuron model parameters are fixed. The example data for each network (1st and 2nd column) shows the spiking and ISI distribution for a typical single neuron. Neurons within each network model show very similar patterning, with some small variation due to the random connections and random external input signal. The in vivo column shows recorded VMN cells which have not been directly fitted, but which show patterning very similar to those of neurons in the corresponding network model. As esyn1 increases, the ISI distribution becomes less skewed and the amplitude of the mode increases until a second mode appears, accompanied by the appearance of short bursts. As the second ISI mode grows and dominates, the bursts become faster and more regular, matching “doublet” type VMN cells. The population column (far right) shows the summed spiking activity of the 50 neurons. The noisy synchronisation of the network produces conical peaks that form oscillations.
Fig 8
Fig 8. Excitatory network functioning as a signal generator.
A network of 100 slow HAP neurons with esyn1 = 0.35 (similar to esyn1 = 0.7 in a 50 neuron network) tested with increasing rates of random input signal. (A) Summed activity of the neurons in the network, in 1-ms bins. As the input rate increases, a rhythmic population signal appears. (B) The rhythmic signal increases in oscillation frequency over a range from ~2.5 to 6 Hz as the input rate increases. (C) The green trace simulates the average postsynaptic signal generated by the neurons in the network in the condition indicated by the green circled dot in B.
Fig 9
Fig 9. Two cell-type oscillatory network.
(A) A network of 100 slow HAP neurons (esyn1 = 0.35) is extended by adding receiving fast HAP neurons (connection probability from slow HAP neurons esyn12 = 0.2), which also receive their own random external input. (B) The slow HAP neurons synchronise to generate a 3 Hz rhythmic signal; these neurons each now show a unimodal symmetrical ISI distribution with a mode corresponding to the frequency of the generated rhythm. These distributions are very like those of “regular” VMN neurons. (C) The summed activity of the slow HAP neurons shows that the activity of these neurons in the network is approximately synchronous. Synchrony is deliberately reduced by increasing the random element of the transmission delay (synrange) to produce more oscillatory summed activity. (D) The fast HAP neurons that receive this rhythmic input, combined with a random external input, display multimodal ISI distributions very like those of “oscillatory” neurons in the VMN. (E) The mean input waveform shows the mean model voltage over all spikes (at time 0) in a single fast HAP neuron, closely matching the mean waveform analysis applied to in vivo “oscillatory” neuron data in Fig 8A2 of [20] that showed a subthreshold 3 Hz rhythm.
Fig 10
Fig 10. Synchronous spiking in the VMN.
(A) Extract from the voltage trace of a recording of spike activity in the VMN (see [20]). In this recording, two cells were recorded that were clearly distinguished by spike height and waveform; the smaller spikes are arrowed in red, the larger spikes in blue. (B) Virtually all of the larger spikes was immediately preceded–with a slightly variable latency–by a smaller spike. (C) ISI distribution of the cell with the larger spikes, constructed over 300 s. This distribution is typical of “longtail1” cells in the VMN [20]. (D) Cross-correlation of 300 s of activity of the two cells distinguished by different spike heights–times of the smaller spike as a function of time relative to the larger spikes.
Fig 11
Fig 11. Spontaneous bistable activity in VMN neurons in vivo and in the model.
(A) The double recording shows an example of two VMN neurons, recorded with a single electrode, showing loosely synchronous spiking activity with spontaneous switching between slow and fast spiking states. (B) An excitatory network model of slow HAP neurons with the addition to each neuron of a DAP generates bistable activity, with switching triggered by changes in external input activity. A noisy, rather than fixed Ire (mean Ire = 100) produces spontaneous switching between slow and fast spiking states, similar to the in vivo examples in A.
Fig 12
Fig 12. Stimulated bistable switching activity in VMN neurons in vivo and in the model.
(A) Most VMN neurons are inhibited after systemic injections of CCK. In this neuron, as in many others of the VMN [27], CCK triggers the switch from a fast spiking to a slow spiking state which is maintained well beyond the duration of CCK action (systemically applied CCK disappears from plasma with a half-life of ~ 5 min). (B) In the same network model of Fig 11B, with a fixed input rate (Ire = 100), 2-s negative and positive perturbations (middle and lower panel) (Ire -50, Ire +50) were used to simulate inhibitory, and in (C) both stimulatory and inhibitory injected signals such as CCK or ghrelin, matching the stimulation-triggered switching between states observed in vivo.

Similar articles

Cited by

References

    1. King BM. The rise, fall, and resurrection of the ventromedial hypothalamus in the regulation of feeding behavior and body weight. Physiol Behav. 2006;87: 221–244. 10.1016/j.physbeh.2005.10.007 - DOI - PubMed
    1. Chowdhury GMI, Wang P, Ciardi A, Mamillapalli R, Johnson J, Zhu W, et al. Impaired Glutamatergic Neurotransmission in the Ventromedial Hypothalamus May Contribute to Defective Counterregulation in Recurrently Hypoglycemic Rats. Diabetes. 2017;66: 1979–1989. 10.2337/db16-1589 - DOI - PMC - PubMed
    1. Coutinho EA, Okamoto S, Ishikawa AW, Yokota S, Wada N, Hirabayashi T, et al. Activation of SF1 Neurons in the Ventromedial Hypothalamus by DREADD Technology Increases Insulin Sensitivity in Peripheral Tissues. Diabetes. 2017;66: 2372–2386. 10.2337/db16-1344 - DOI - PubMed
    1. Felsted JA, Chien C-H, Wang D, Panessiti M, Ameroso D, Greenberg A, et al. Alpha2delta-1 in SF1+ Neurons of the Ventromedial Hypothalamus Is an Essential Regulator of Glucose and Lipid Homeostasis. Cell Rep. 2017;21: 2737–2747. 10.1016/j.celrep.2017.11.048 - DOI - PMC - PubMed
    1. Fujikawa T, Castorena CM, Pearson M, Kusminski CM, Ahmed N, Battiprolu PK, et al. SF-1 expression in the hypothalamus is required for beneficial metabolic effects of exercise. eLife. 2016;5 10.7554/eLife.18206 - DOI - PMC - PubMed

Publication types