

Novel aspects of the role of the liver in carbohydrate metabolism
- PMID: 31158368
- PMCID: PMC7216693
- DOI: 10.1016/j.metabol.2019.05.011
Novel aspects of the role of the liver in carbohydrate metabolism
Abstract
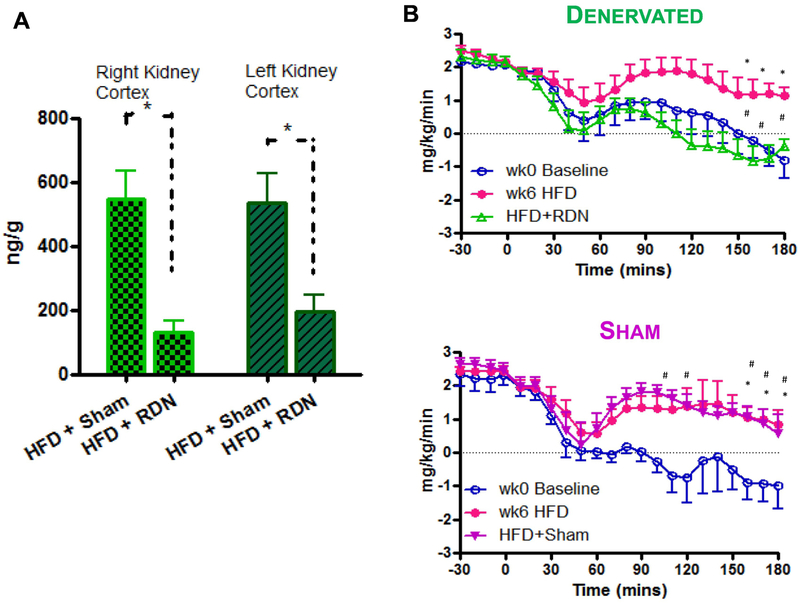
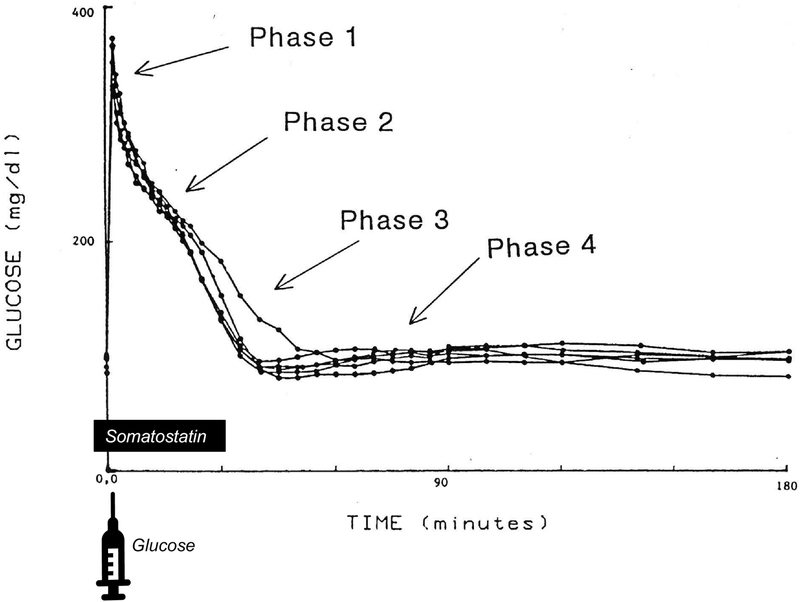
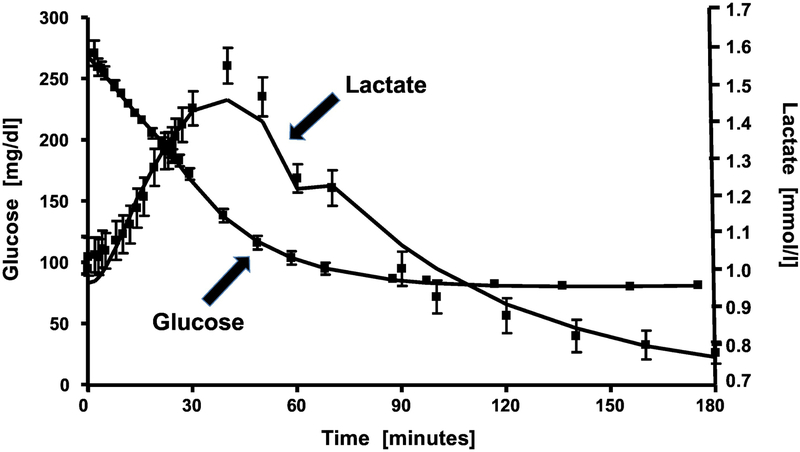
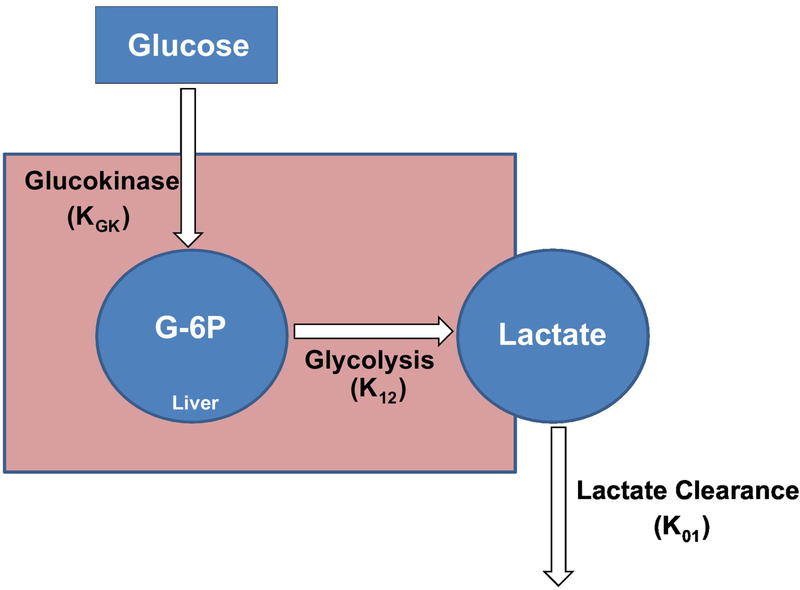
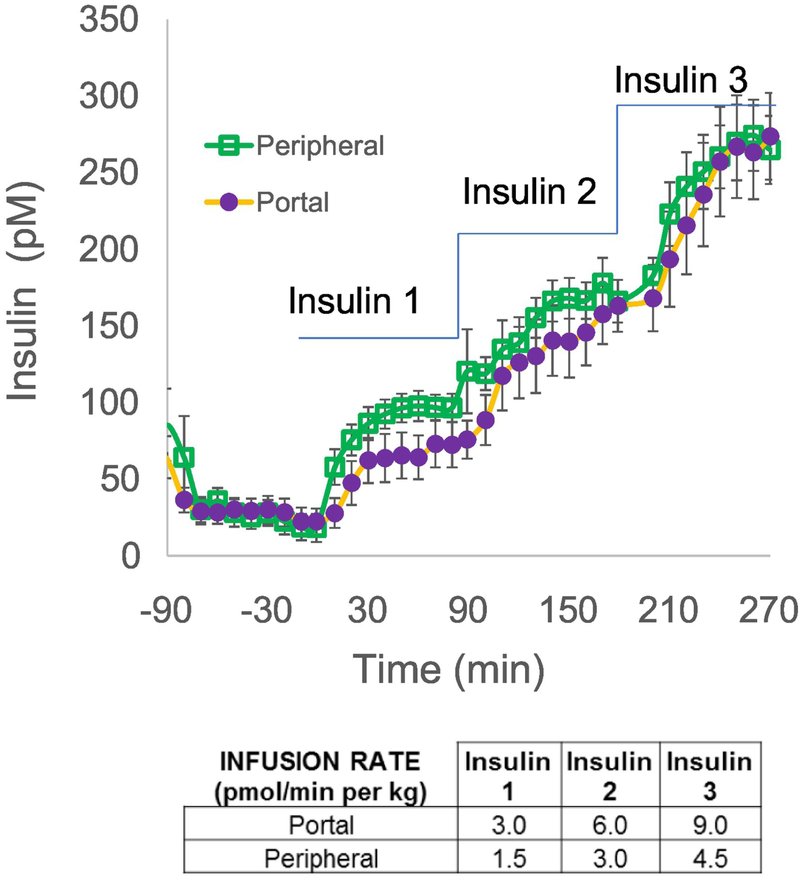
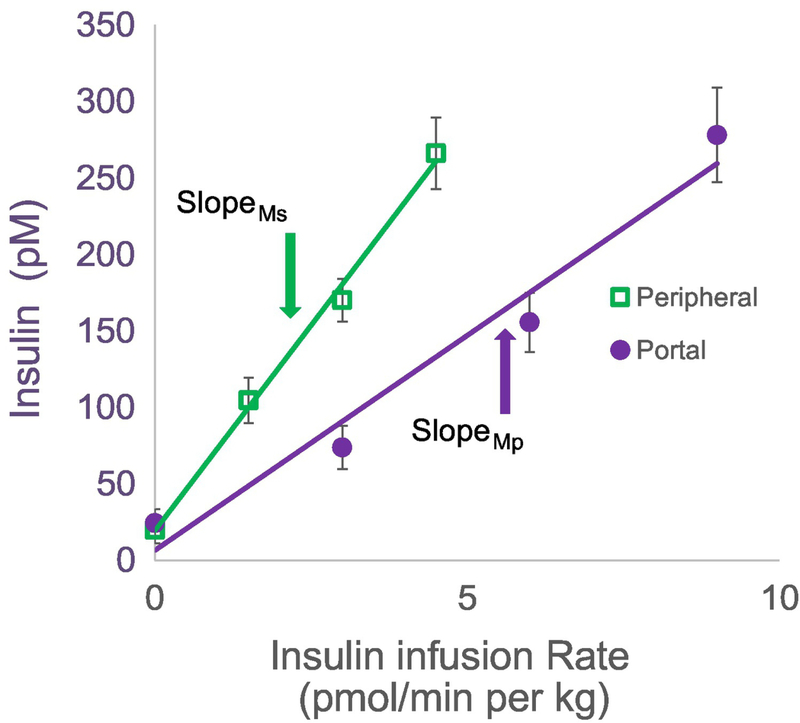
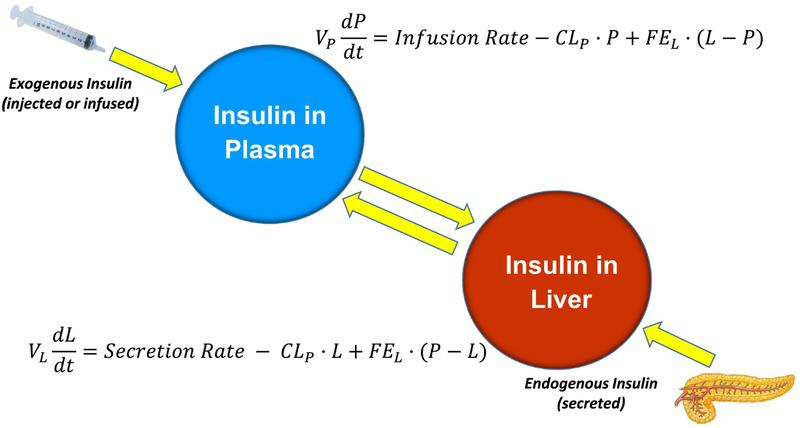
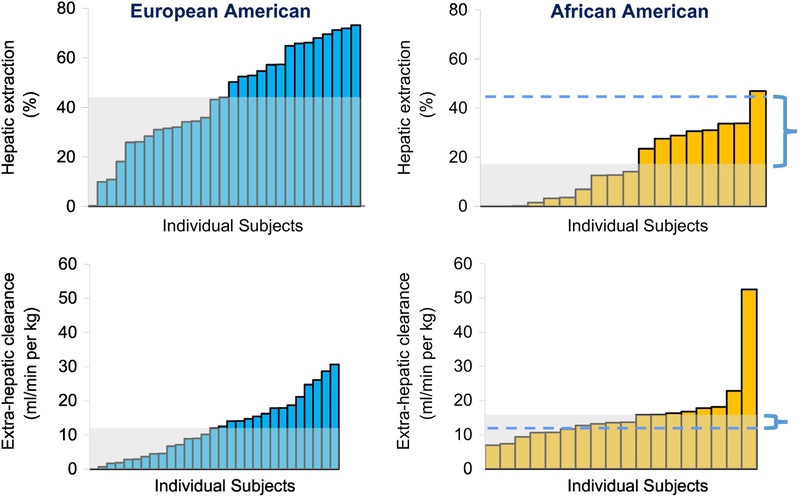
Malfunction of the liver is a central factor in metabolic disease. Glucose production by liver is complex and controlled via indirect mechanisms; insulin regulates adipose tissue lipolysis, and free fatty acids in turn regulate liver glucose output. This latter concept is confirmed by studies in L-Akt-Foxo1 knockout mice. The adipocyte is a likely locus of hepatic insulin resistance. Also, kidneys play a role in regulating glucose production; denervated kidneys abrogate the effect of fat feeding to cause insulin resistance. Glucose itself is an important regulator of liver metabolism ("glucose effectiveness"); after entering liver, glucose is phosphorylated and can be exported as lactate. Using the dynamic glucose/lactate relationship, we have been able to estimate glucose effectiveness in intact animals and human subjects. Families have been identified with a glucokinase regulatory protein defect; modeling demonstrates elevated glucokinase activity. Insulin clearance by liver is highly variable among normal individuals, and is under environmental control: high fat diet reduces clearance by 30%. Liver insulin clearance is significantly lower in African American (AA) adults and children compared to European American participants, accounting for fasting hyperinsulinemia in AA. We hypothesize that reduced hepatic insulin clearance causes peripheral insulin resistance and increased Type 2 diabetes in AA.
Copyright © 2019 Elsevier Inc. All rights reserved.
Figures
References
-
- Jastrow M: The liver in antiquity and the beginning of anatomy. Trans Col Phys Phila 1907;39:117–138
-
- Cherrington AD, Vranic M: Role of glucagon and insulin in control of glucose turnover. Metabolism 1971;20:625–628 - PubMed
-
- Corvera S, Huerta-Bahena J, Pelton JT, Hruby VJ, Trivedi D, Garcia-Sainz JA: Metabolic effects and cyclic AMP levels produced by glucagon, (1-N alpha-Trinitrophenylhistidine,12-homoarginine)glucagon and forskolin in isolated rat hepatocytes. Biochim Biophys Acta 1984;804:434–441 - PubMed
-
- Gabbay RA, Lardy HA: Site of insulin inhibition of cAMP-stimulated glycogenolysis. J Biol Chem 1984;259:6052–6055 - PubMed
-
- Poy MN, Yang Y, Rezaei K, Fernstrom MA, Lee AD, Kido Y, Erickson SK, Najjar SM: CEACAM1 regulates insulin clearance in liver. Nature Gen 2002;30:270–276 - PubMed
Publication types
MeSH terms
Substances
Grants and funding
LinkOut - more resources
Full Text Sources
Research Materials
Miscellaneous
