. 2019 Jun;570(7762):462-467.
doi: 10.1038/s41586-019-1291-3. Epub 2019 Jun 3.

Mapping human microbiome drug metabolism by gut bacteria and their genes

Affiliations

Mapping human microbiome drug metabolism by gut bacteria and their genes

Michael Zimmermann et al. Nature. 2019 Jun.

Abstract

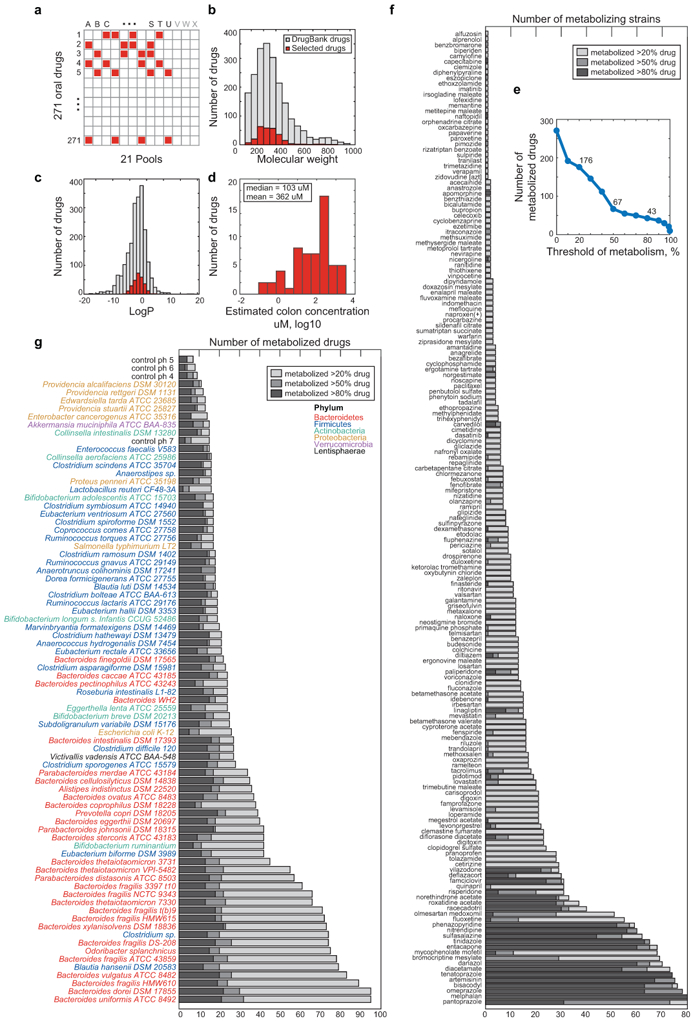
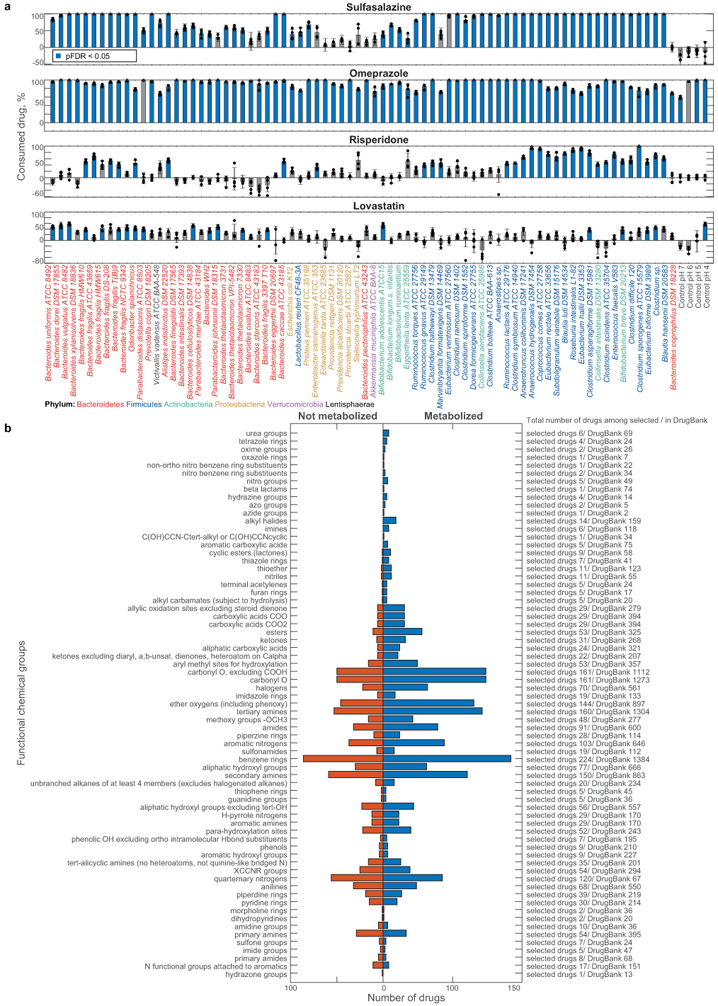
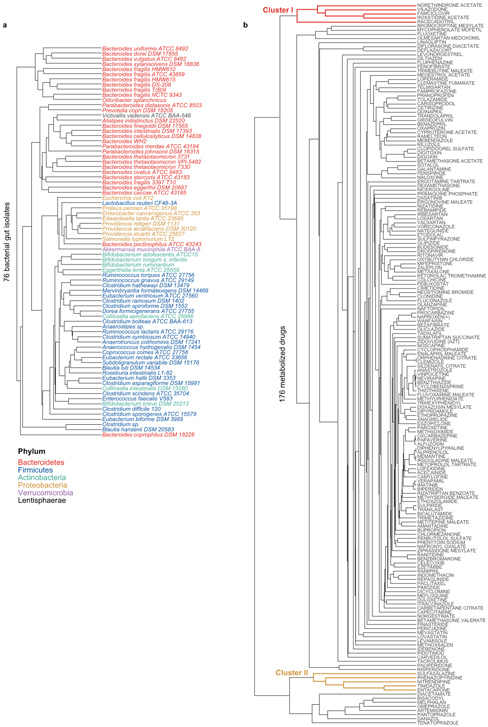
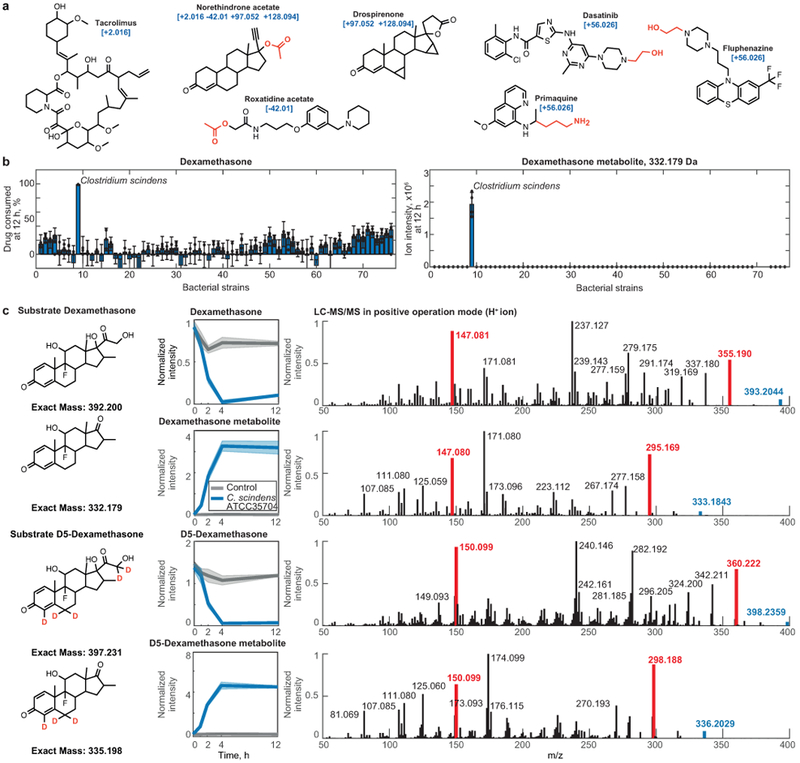
Individuals vary widely in their responses to medicinal drugs, which can be dangerous and expensive owing to treatment delays and adverse effects. Although increasing evidence implicates the gut microbiome in this variability, the molecular mechanisms involved remain largely unknown. Here we show, by measuring the ability of 76 human gut bacteria from diverse clades to metabolize 271 orally administered drugs, that many drugs are chemically modified by microorganisms. We combined high-throughput genetic analyses with mass spectrometry to systematically identify microbial gene products that metabolize drugs. These microbiome-encoded enzymes can directly and substantially affect intestinal and systemic drug metabolism in mice, and can explain the drug-metabolizing activities of human gut bacteria and communities on the basis of their genomic contents. These causal links between the gene content and metabolic activities of the microbiota connect interpersonal variability in microbiomes to interpersonal differences in drug metabolism, which has implications for medical therapy and drug development across multiple disease indications.


Figures

Extended Data Figure 1.
Extended Data Figure 1.. Setup of drug assay, characterization of tested drugs, and summary of metabolic bacteria-drug interactions.
a, Schematic representation of combinatorial pooling scheme using 21 drug pools (A-U) and 3 non-drug controls (V-X). Each of the 271 drugs is tested in quadruplicate (present in 4 pools) and any two drugs are tested in the same pool at most twice (Supplementary Table 2). b-c, Molecular weight (b) and LogP (c) distribution of 271 tested drugs (red) in comparison with 2099 clinically approved drugs (DrugBank). d, Distribution of predicted colon drug concentration for 58 of the 271 drugs tested (data from Maier et al.). The predicted median and mean concentration in the large intestine for these compounds is 103 uM and 362 uM, respectively, when each drug is administered at its standard oral dose. e, Number of drugs metabolized as a function of the selection threshold (metabolized fraction). f, Number of gut bacteria that metabolize a given drug. g, Number of drugs metabolized by each bacterial strain.
Extended Data Figure 2.
Extended Data Figure 2.. Metabolism of drugs previously reported to be transformed by bacteria and functional chemical group distribution.
a, Percent of consumption between 0 h and 12 h for each drug after incubation with each gut bacterial species/strain are shown. Bars and error bars depict the mean and STD of n=4 assay replicates. b, Distribution of functional chemical groups in drugs that are metabolized or not metabolized across the 76 tested bacterial strains. Abundance of each chemical group among the 271 selected drugs and 2099 clinical drugs (DrugBank) is indicated.
Extended Data Figure 3.
Extended Data Figure 3.. Hierarchical clustering of bacterial strains/species and drugs according to microbial drug metabolism.
a, Dendrogram of bacterial strains from Fig. 1c (X-axis). b, Dendrogram of drugs from Fig. 1c (Y-axis).
Extended Data Figure 4.
Extended Data Figure 4.. Structural drug features targeted for biotransformation and microbiome metabolism of dexamethasone.
a, Examples of drugs associated with a particular mass shift between a parent drug and its metabolite. Functional groups that are enriched in drugs undergoing a specific mass shift (Fig. 2d) are highlighted. b, Dexamethasone metabolism by each of the 76 tested bacterial strains. Bar plots and error bars represent mean and STD of n=4 assay replicates. c, Validation of C. scindens (ATCC 35704) desmolase activity by mass comparison of metabolites produced from either dexamethasone or D5-dexamethasone and their LC-MS/MS spectra. Shaded areas correspond to mean ± standard deviation, n=6 independent cultures. Highlighted in red are representative ion fragments to illustrate the loss of the dexamethasone side chain (labeled with 2 deuterium atoms, compared to the steroid backbone labeled with 3 deuterium atoms).
Extended Data Figure 5.
Extended Data Figure 5.. Microbial corticosteroid metabolism in vivo and in human gut communities.
a, Dexamethasone serum profile in conventional mice following a single oral dose of dexamethasone. Line depicts fit of first order drug elimination kinetics. n=4 mice of either gender were used for each time point. Data are provided in Supplementary Table 7. b, Dexamethasone and dexamethasone metabolite levels across tissues of germ-free and C. scindens (ATCC 35704) mono-colonized mice after 7 hours of drug exposure. Horizontal lines show mean values of n=6 animals. * p ≤ 0.05, ** ≤ 0.01, *** ≤ 0.001 (unpaired two-sided Student’s t-test). Data and p-values are provided in Supplementary Table 8. c, C. scindens (ATCC 35704) desmolase activity for different corticosteroids. Shaded areas correspond to mean ± standard deviation, n=6 independent cultures. d, Bacterial density of human gut communities. CFU, colony forming units measured by anaerobic culturing. Horizontal bars represent mean of n=4 independent cultures. e, Ex vivo dexamethasone metabolism of gut communities isolated from 28 humans (each color represents a different human donor, lines depict the mean of n=4 replicate assays). C. scindens species abundance (quantified by species-specific qPCR) is not sufficient to explain the dexamethasone-metabolizing activity of these human gut communities. Data are provided in Supplementary Table 9. f, Correlation between community CFU mL−1 values and dexamethasone (left) or androgen dexamethasone metabolite (right) consumption and production slopes after 12 hours of incubation with each of the 28 human gut communities. P-values were calculated for the null hypothesis that there is zero correlation against the two-sided alternative that there is non-zero correlation (also see methods).
Extended Data Figure 6.
Extended Data Figure 6.. Gain-of-function approach to identify microbial drug-metabolizing gene products: B. thetaiotaomicron diltiazem metabolism as an example.
a, Drugs metabolized by B. thetaiotaomicron and candidate drug metabolites identified by untargeted metabolomics. b, Identification of active 384-well library plates that include clones with diltiazem deacetylation activity. c, Mapping of diltiazem-converting activity within active plates to identify active clones. d, Four independent E. coli clones demonstrating gain of diltiazem-metabolizing activity carry inserts that map to the same region in the B. thetaiotaomicron genome. e, Validation of BT4096 activity by targeted expression of the open reading frame in E. coli. Shaded areas depict the mean and STD of independent cultures/assays (n=4). f, Bacterial load of gnotobiotic mice mono-colonized with either B. thetaiotaomicron wildtype or the bt4096 mutant strain. Horizontal bars represent mean of n=35 independent mice per group. P-value was calculated with unpaired two-sided Student’s t-test. g, In vitro enzyme assay with N-desmethyldiltiazem as substrate to demonstrate that BT4096 also deacetylates N-desmethyldiltiazem, which is the major metabolic product of murine diltiazem metabolism. Lines and shaded areas depict the mean and STD of n=4 assay replicates, respectively.
Extended Data Figure 7.
Extended Data Figure 7.. In vivo diltiazem metabolism and tandem mass spectrometry to validate metabolite identities.
a, Structures of diltiazem in vivo metabolites. b, Exemplary tandem-MS analysis to validate identities of diltiazem metabolites. LC-MS/MS data for all diltiazem metabolites are compiled in Supplementary Table 21. The experiment was performed n=3 times with comparable results.
Extended Data Figure 8.
Extended Data Figure 8.. bt4096-depended in vivo diltiazem metabolism.
a, Diltiazem and diltiazem metabolite kinetics in different tissues following a single oral dose of diltiazem in gnotobiotic mice mono-colonized with either B. thetaiotaomicron wildtype or the bt4096 mutant strain. b, Intestinal diltiazem and diltiazem metabolite levels following multiple oral doses of diltiazem in mice mono-colonized with either B. thetaiotaomicron wildtype or the bt4096 mutant strain. Five oral doses were administrated to animals in six hour intervals. Tissues were collected 12 hours after the last oral dose of diltiazem. For all mouse experiments: Horizontal lines show the mean of n=5 animals and times reflect hours after oral diltiazem administration. * p ≤ 0.05, ** ≤ 0.01, *** ≤ 0.001 (unpaired two-sided Student’s t-test with FDR correction for multiple hypotheses testing). Data and p-values are provided in Supplementary Tables 10-11.
Extended Data Figure 9.
Extended Data Figure 9.. Validation of identified drug-metabolizing gene products.
a, B. thetaiotaomicron gDNA fragments identified in norethindrone acetate and pericyazine metabolizing E. coli clones. b, All drug-metabolizing gain-of-function hits were validated by assays with E. coli expression constructs carrying PCR-amplified gene sequences and their combinations in case of operons (e.g., BT_2068–2066 metabolizing norethindrone). c, d, Levonorgestrel and progesterone-metabolizing activity of BT2068 shown by E. coli expressing bt2068 (c) and B. thetaiotaomicron wildtype, bt2068 mutant, and complemented strains (d). Promoter strengths for gene complementation are P1E6 > P4E5 >P2E5 > P5E4 >P1E4 > P2E3. e, Exemplary LC-MS/MS validation of O-acetyl-pericyazine. The experiment was performed n=3 times with comparable results. f, Enzymatic validation of O-acetyl- and O-propionyl-transferase activity using purified BT2367 and periciazine as substrate. e, Enzymatic validation of O-acyl-transferase activity of purified BT2367 using substrates structurally similar to pericyazine. While no acetyl-transferase activity could be measured for cyamemazine, aminopropylpiperidinol is converted to o-acetyl-aminopropylpiperidinol by BT2367. In (a-d) and (f-g), shaded areas depict the mean and STD of independent cultures/assays (n=4).
Extended Data Figure 10.
Extended Data Figure 10.. Identified drug-metabolizing gene products explain observed drug metabolism of gut bacteria.
a, Genome coverage and fragment size distribution in E. coli gain-of-function libraries specific for B. dorei (based on 78 sequenced clones) and C. aerofaciens (based on 81 sequenced clones). Both libraries contained ~37,000 clones. b, Network of enzyme-substrate-product drug metabolic interactions for B. dorei and C. aerofaciens. Each node represents an enzyme (rectangles), a drug substrate (hexagons) or a metabolite product (circles), and each edge represents a validated metabolic interaction (targeted cloning of the gene into E. coli results in metabolism of a given drug or production of a specific drug metabolite). c, Comparison between maximal BD03091 and CA01707 identity of a given bacterial strain and its metabolism of norethindrone acetate and tinidazole, respectively. d, e, Reciprocal BLAST analysis of identified drug-metabolizing proteins. Line-width depicts the % of length (d) and identity (e) of mutual protein sequence alignment. e, Specific drug metabolism rates of 67 genome sequenced gut bacteria and presence of homologs to respective drug-metabolizing gene products. Notably, roxatidine acetate, famciclovir, diacetamate and diltiazem (Fig. 5b) all undergo the same chemical transformation (deacetylation), yet distinct sets of gene products explain their microbial metabolism. Bars and error bars represent mean and STD of n=4 assay replicates. Gene locus tag abbreviations: BD: BACDOR; CA: COLAER.
Extended Data Figure 11.
Extended Data Figure 11.. Identified drug-metabolizing gene products explain observed drug metabolism of bacterial gut communities.
a-b, Diltiazem conversion to desacetyldiltiazem by 28 different human gut communities (each color represents a different human donor, lines depict the mean of n=4 assay replicates). Microbiota diltiazem-metabolizing activity does not correlate with either total bacterial culture densities or microbiota abundance of B. thetaiotaomicron (quantified by species-specific 16S-RNA qPCR). P-values were calculated for the null hypothesis that there is zero correlation against the two-sided alternative that there is non-zero correlation (also see methods). c, Composition and diversity of the 28 bacterial communities based on metagenomic sequencing. d, Correlation analysis between microbiota diltiazem-metabolizing activity and community CFU or metagenomic abundance of BT4096 homologs, diltiazem-metabolizing bacterial species, genera, and phyla identified in this study. e-f, Correlation analysis identical to (d) for the metabolism of norethindrone acetate and famciclovir by the 28 bacterial communities (each color represents a different human donor, lines depict the mean of n=4 replicate assays). P-values were calculated for the null hypothesis that there is zero correlation against the two-sided alternative that there is non-zero correlation (also see methods). Data are available in Supplementary Tables 16-19.
Fig. 1.
Fig. 1.. Drug-metabolizing activities of human gut bacteria.
a, Schematic representation of the assay. b, Chemical diversity of tested compounds compared to 2099 clinical drugs (DrugBank). c, Heatmap of the 176 drugs metabolized by at least one of the 76 human gut bacterial strains. Strains and drugs are arranged by hierarchical clustering according to metabolic activities. d, e, Examples of drugs that cluster together according to their metabolism. See methods and Supplementary Table 3 for statistics and reproducibility.
Fig. 2.
Fig. 2.. Bacteria-derived drug metabolites.
a, Representative volcano plot showing compounds detected by untargeted metabolomics associated with a specific drug metabolized by a given bacterial strain (e.g., diltiazem metabolism by B. thetaiotaomicron). The 4 pools containing a given drug are compared to all other pools (x-axis, fold change; y-axis, pFDR). Experimentally determined masses of diltiazem-associated compounds are indicated. Compounds significantly associated with diltiazem pools are shown in blue, others are in gray. b, Number of drug-specific compounds detected before (grey) and after (blue) measurement artifact elimination. c, Mass shifts detected between drugs and their specific metabolites. d, Chemical group enrichment analysis of drugs undergoing the same mass shift upon microbial conversion. Mass differences and chemical groups are arranged by hierarchical clustering according to the fraction of metabolized drugs containing a specific chemical group. See methods and Supplementary Tables 5-6 for statistics and reproducibility.
Fig. 3.
Fig. 3.. Identification and in vivo characterization of microbial drug-metabolizing gene products: B. thetaiotaomicron diltiazem metabolism as an example.
a, Scheme for generation of an arrayed gain-of-function library, source genome coverage, and insert size distribution of the B. thetaiotaomicron library. b, Mapping of active insert sequences to the B. thetaiotaomicron genome. c, Enzymatic validation using purified BT4096. d, Diltiazem-metabolizing activity of B. thetaiotaomicron wildtype, bt4096 mutant, and bt4096 complemented strains at different expression levels (promoter strength: P2E5 > P1E4 > P2E3). e, Intestinal kinetics of diltiazem and deacetylated diltiazem metabolites after single oral diltiazem administration to mice mono-colonized with either B. thetaiotaomicron wildtype or bt4096 mutant strains. f, Serum levels of diltiazem and deacetylated diltiazem metabolites after serial oral diltiazem administration to mice mono-colonized with either B. thetaiotaomicron wildtype or bt4096 mutant strains. In (c-d) shaded areas depict the mean and STD of independent assays/cultures (n=4). For (e-f): times reflect hours after oral diltiazem administration and horizontal lines depict the mean per timepoint. * p ≤ 0.05, ** ≤ 0.01, *** ≤ 0.001 (pFDR). See methods and Supplementary Tables 10-11 for statistics and reproducibility.
Fig. 4.
Fig. 4.. Genome-wide identification of drug-metabolizing gene products in B. thetaiotaomicron.
a, Network of enzyme-substrate-product drug metabolic interactions for B. thetaiotaomicron. Each node represents an enzyme (rectangles), a drug substrate (hexagons) or a metabolite product (circles), and each edge represents a validated metabolic interaction (targeted cloning of the gene into E. coli results in metabolism of a given drug or production of a specific drug metabolite). b, Norethindrone acetate-metabolizing activity of B. thetaiotaomicron wildtype, bt2068 mutant, and complemented strains. c, Pericyazine-metabolizing activity of B. thetaiotaomicron wildtype, bt2367 mutant, and complemented strains. In (b-c), promoter strengths are P1E6 > P4E5 >P2E5 > P5E4 >P1E4 > P2E3. Shaded areas depict the mean and STD of independent cultures (n=4). See methods for statistics and reproducibility.
Fig. 5.
Fig. 5.. Microbiome-encoded drug-metabolizing gene products explain drug metabolism of gut bacterial strains and communities.
a, Genes identified from libraries of B. thetaiotaomicron, B. dorei, and C. aerofaciens genomic DNA. b, Diltiazem metabolism rates for the 67 bacterial strains from Figure 1 with available genome sequences, presence of BT4096 homologs in their genomes, and comparison between maximal BT4096 identity and diltiazem metabolism of each strain. c, Gene set enrichment analysis for specific drug-metabolizing gene products and their combinations among the bacterial strains metabolizing each drug. Enrichment is shown for single (upper panel) and combined (lower panel) drug-metabolizing gene products among sets of bacterial strains metabolizing a given drug. d-e, Norethindrone acetate and tinidazole metabolism of the 67 genome-sequenced gut bacteria and presence of homologs of identified drug-metabolizing gene products. f, Diltiazem conversion to desacetyldiltiazem by 28 different human gut communities and correlation between microbiota diltiazem-metabolizing activity and qPCR-measured abundance of bt4096 homologs. g-h, Metabolism of norethindrone acetate and famciclovir by 28 different human gut communities. Right panels provide correlation coefficients between community drug metabolizing activity and the metagenomic abundance of drug metabolizing bacterial gene products, species, genera and phyla identified in this study. For (f-h) each color represents a different human donor, lines depict the mean of n=4). See methods and Supplementary Tables 14-16 and 18-19 for statistics and reproducibility.

Comment in

References

    1. Obach RS & Esbenshade TA Pharmacologically Active Drug Metabolites: Impact on Drug Discovery and Pharmacotherapy. Pharmacol Rev 65, 578–640 (2013). - PubMed
    1. Sousa T et al. On the colonic bacterial metabolism of azo-bonded prodrugsof 5-aminosalicylic acid. J Pharm Sci 103, 3171–3175 (2014). - PubMed
    1. Haiser HJ et al. Predicting and manipulating cardiac drug inactivation by the human gut bacterium Eggerthella lenta. Science 341, 295–298 (2013). - PMC - PubMed
    1. Okuda H, Ogura K, Kato A, Takubo H & Watabe T A possible mechanism of eighteen patient deaths caused by interactions of sorivudine, a new antiviral drug, with oral 5-fluorouracil prodrugs. J Pharmacol Exp Ther 287, 791–799 (1998). - PubMed
    1. Zimmermann M, Zimmermann-Kogadeeva M, Wegmann R & Goodman AL Separating host and microbiome contributions to drug pharmacokinetics and toxicity. Science 363, eaat9931 (2019). - PMC - PubMed

Publication types

MeSH terms