. 2019 May 31;11(6):759.
doi: 10.3390/cancers11060759.

Detection of Epstein-Barr Virus Infection in Non-Small Cell Lung Cancer

Affiliations

Detection of Epstein-Barr Virus Infection in Non-Small Cell Lung Cancer

Fayez Kheir et al. Cancers (Basel). .

Abstract

Previous investigations proposed a link between the Epstein-Barr virus (EBV) and lung cancer (LC), but the results are highly controversial largely due to the insufficient sample size and the inherent limitation of the traditional viral screening methods such as PCR. Unlike PCR, current next-generation sequencing (NGS) utilizes an unbiased method for the global assessment of all exogenous agents within a cancer sample with high sensitivity and specificity. In our current study, we aim to resolve this long-standing controversy by utilizing our unbiased NGS-based informatics approaches in conjunction with traditional molecular methods to investigate the role of EBV in a total of 1127 LC. In situ hybridization analysis of 110 LC and 10 normal lung samples detected EBV transcripts in 3 LC samples. Comprehensive virome analyses of RNA sequencing (RNA-seq) data sets from 1017 LC and 110 paired adjacent normal lung specimens revealed EBV transcripts in three lung squamous cell carcinoma and one lung adenocarcinoma samples. In the sample with the highest EBV coverage, transcripts from the BamHI A region accounted for the majority of EBV reads. Expression of EBNA-1, LMP-1 and LMP-2 was observed. A number of viral circular RNA candidates were also detected. Thus, we for the first time revealed a type II latency-like viral transcriptome in the setting of LC in vivo. The high-level expression of viral BamHI A transcripts in LC suggests a functional role of these transcripts, likely as long non-coding RNA. Analyses of cellular gene expression and stained tissue sections indicated an increased immune cell infiltration in the sample expressing high levels of EBV transcripts compared to samples expressing low EBV transcripts. Increased level of immune checkpoint blockade factors was also detected in the sample with higher levels of EBV transcripts, indicating an induced immune tolerance. Lastly, inhibition of immune pathways and activation of oncogenic pathways were detected in the sample with high EBV transcripts compared to the EBV-low LC indicating the direct regulation of cancer pathways by EBV. Taken together, our data support the notion that EBV likely plays a pathological role in a subset of LC.

Keywords: EBV; Epstein-Barr virus; NGS; NSCLC; next-generation sequencing; non-small cell lung cancer.


Conflict of interest statement

The authors declare that the research was conducted in the absence of any commercial or financial relationships that could be constructed as a potential conflict of interest.

Figures

Figure 1
Figure 1
Detection of EBV marker small RNA EBERs in lung cancer cells. Images of paraffin-embedded human lung cancer probed for EBERs using in situ hybridization. EBERs (brown signal) were detected in three non-small cell lung cancer cases. Patient IDs were shown above or below each image. Control (patient ID# Rln060040-B11) represents an EBV-negative lung squamous cell carcinoma case. Scale bar: 50 µm.
Figure 2
Figure 2
Detection of EBV in non-small cell lung cancer data sets. (A) Approximately 20 million of randomly selected RNA-seq reads from each of 1127 non-small cell lung cancer samples and tumor-adjacent normal lung tissue samples were analyzed using the RNA CoMPASS software. The virome branch of the taxonomy trees for the four EBV positive samples was generated using the metagenome analysis tool, MEGAN 4. (B) For more in-depth analyses of EBV reads, the entire sequence read file for each sample (~60–118 million reads) was aligned to the modified Akata-EBV genome and the hg38 human genome assembly using the STAR aligner. Of the EBV(+) samples, one sample (EBV-high) was identified as having high numbers of EBV reads, while three (EBV-low) were found to have low but detectable numbers of EBV reads. (C) Histology types of analyzed lung cancer specimens.
Figure 3
Figure 3
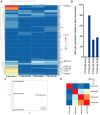
EBV gene expression analysis. (A) A heatmap shows EBV transcript levels for the four EBV(+) lung cancer samples. Unsupervised hierarchical clustering separated the EBV-low and EBV-high samples. (B) The ratio of EBV lytic-to-latent gene expression for each EBV(+) sample. (C) Principal component analysis (PCA) of variability among EBV(+) NSCLC samples based on EBV gene expression. Each point represents one sample, with color indicating sample groups as described in the figure legends. (D) A plot of the EBV gene expression pattern determined by correlation analyses of the EBV(+) samples.
Figure 4
Figure 4
The EBV transcriptome in lung cancer. EBV genome coverage data for the EBV-high NSCLC is shown using the Integrative Genomics Viewer (IGV) based on the modified Akata-EBV genome. The modified EBV Akata genome was split between the BBLF2/3 and the BGLF3.5 lytic genes rather than at the terminal repeats to accommodate coverage of splice junctions for the latency membrane protein LMP-2. The y-axis represents the number of reads at each nucleotide position. The scale for the sample is set to a maximum read level of 700 reads. Blue features represent lytic genes, red features represent latent genes, green features represent potential noncoding genes, aquamarine features represent microRNAs, and black features represent non-gene features (e.g., repeat regions). Inset: Detailed read coverage data for the RPMS1/BamHI A region of the EBV genome.
Figure 5
Figure 5
EBV transcripts from RPMS1 are among the highest expressed genes in EBV(+) NSCLC. Transcripts per million (TPM) values calculated using reads across all RPMS1 exons are shown with respect to the median expression of all expressed cellular genes (expressed genes defined as cellular genes with greater than 0.01 TPM). The percentage values above the RPMS1 bar represents the rank of RPMS1 expression among all expressed cellular genes.
Figure 6
Figure 6
Alternative splicing in the EBV BamH1 A region in EBV-high NSCLC. RNA-seq data of the EBV-high NSCLC were analyzed using the STAR aligner and were aligned to the modified Akata-EBV genome to obtain splice junction information. Junctions were visualized using the Integrative Genomic Viewer (IGV). The thickness of the red junction features correlates with the number of reads for the respective junction. The number of junction spanning reads for each junction is indicated above each junction feature.
Figure 7
Figure 7
Dimension reduction, correlation and cluster analysis of cellular gene expression data of the EBV(+) NSCLC. (A) Principal component analysis (PCA) of variability among EBV(+) NSCLC samples based on cellular gene expression. Each point represents one sample, with color indicating sample groups as described in the figure legend. (B) Correlation analysis of the EBV(+) NSCLC samples with the plot showing the correlation to the cellular gene expression pattern.
Figure 8
Figure 8
Immune infiltration status of EBV(+) NSCLCs. (A) Fractions of immune cell subsets in EBV(+) NSCLC samples inferred from gene-expression data using CIBERSORT. CIBERSORT empirical p value, p < 0.001. (B) Representative images of hematoxylin and eosin staining of EBV(+) NSCLC and adjacent normal lung samples. Arrowheads point to the infiltrating immune cells. Scale bar: 50 µm. (C) A high EBV level is associated with enhanced expression of immune checkpoint molecules in EBV(+) NSCLC samples. Heatmap shows transcripts levels of known cellular checkpoint molecules in EBV(+) NSCLC samples. Checkpoint molecules that were significantly up-regulated in the EBV-high sample are highlighted in red. Unsupervised hierarchical cluster analysis shows the separation of EBV-low and EBV-high samples.

References

    1. Engels E.A. Inflammation in the development of lung cancer: Epidemiological evidence. Expert Rev. Anticancer Ther. 2008;8:605–615. doi: 10.1586/14737140.8.4.605. - DOI - PubMed
    1. Leroux C., Girard N., Cottin V., Greenland T., Mornex J.F., Archer F. Jaagsiekte sheep retrovirus (JSRV): From virus to lung cancer in sheep. Vet. Res. 2007;38:211–228. doi: 10.1051/vetres:2006060. - DOI - PubMed
    1. Young L.S., Yap L.F., Murray P.G. Epstein-Barr virus: More than 50 years old and still providing surprises. Nat. Rev. Cancer. 2016;16:789–802. doi: 10.1038/nrc.2016.92. - DOI - PubMed
    1. Desgranges C., de-The G. Epstein-Barr virus specific iga serum antibodies in nasopharyngeal and other respiratory carcinomas. Int. J. Cancer. 1979;24:555–559. doi: 10.1002/ijc.2910240506. - DOI - PubMed
    1. Roy A., Dey S., Chatterjee R. Prevalence of serum IgG and IgM antibodies against Epstein-Barr virus capsid antigen in indian patients with respiratory tract carcinomas. Neoplasma. 1994;41:29–33. - PubMed

LinkOut - more resources