

A Microcavity Array-Based 4D Cell Culture Platform
- PMID: 31159244
- PMCID: PMC6631836
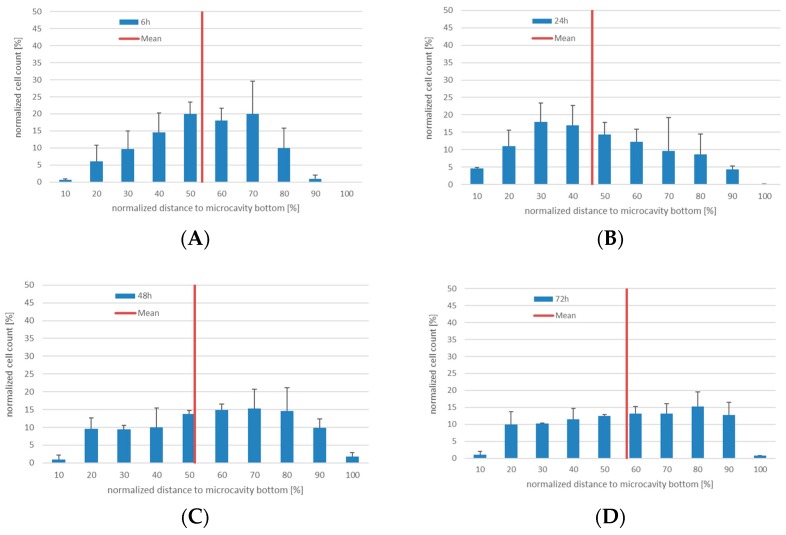
- DOI: 10.3390/bioengineering6020050
A Microcavity Array-Based 4D Cell Culture Platform
Abstract
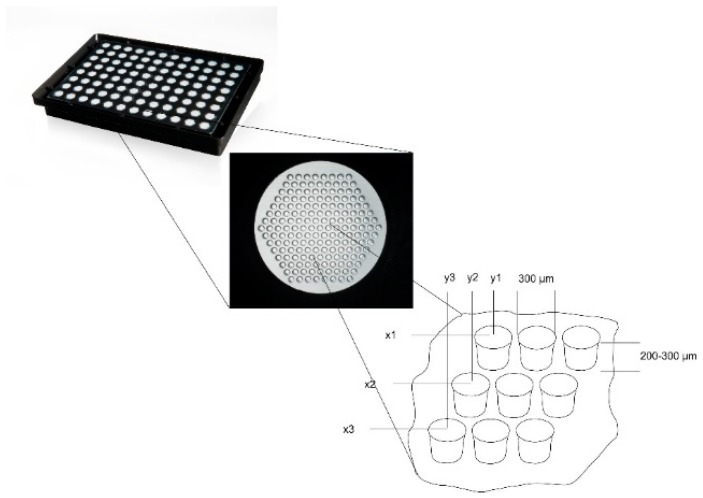
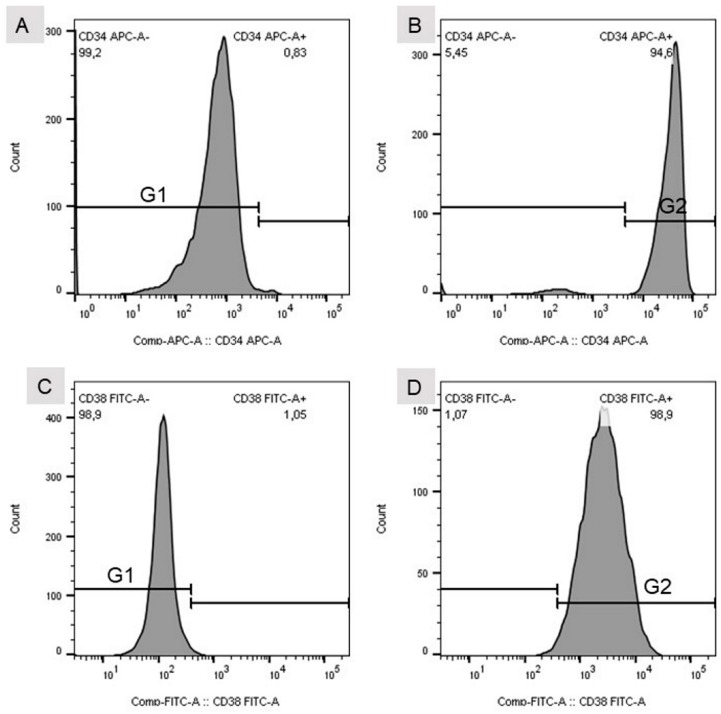
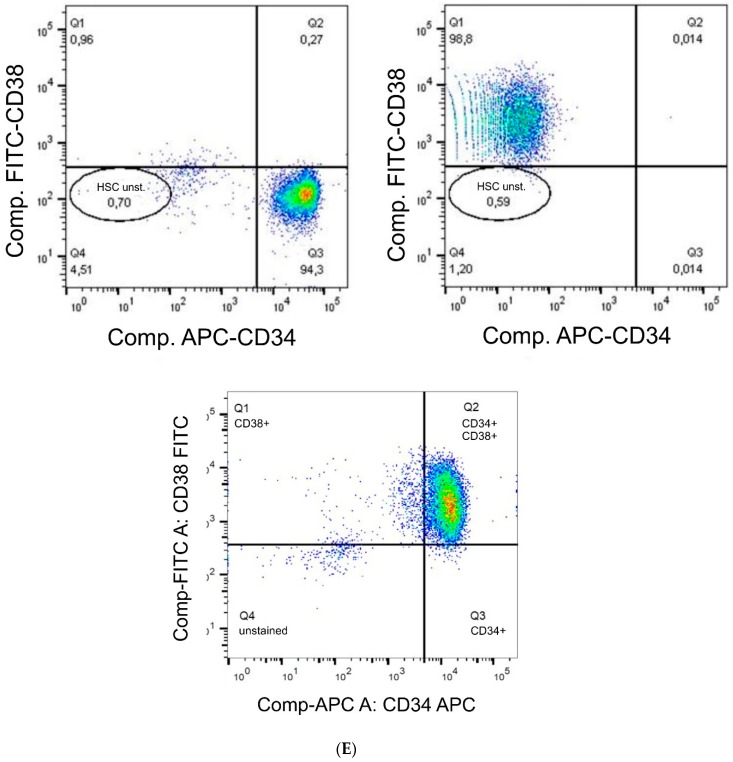
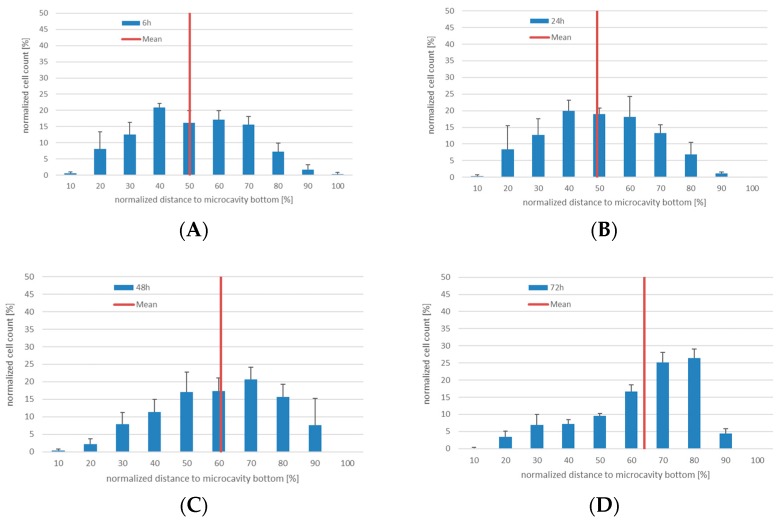
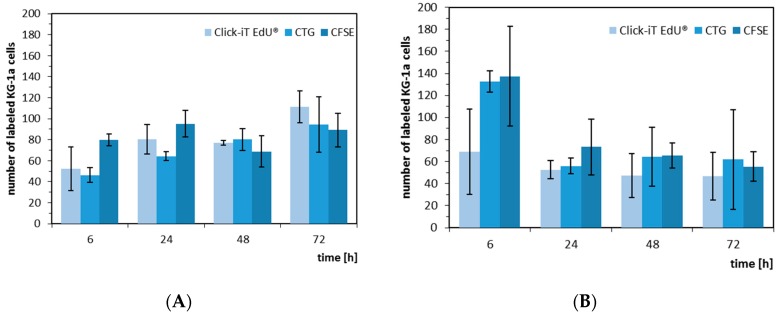
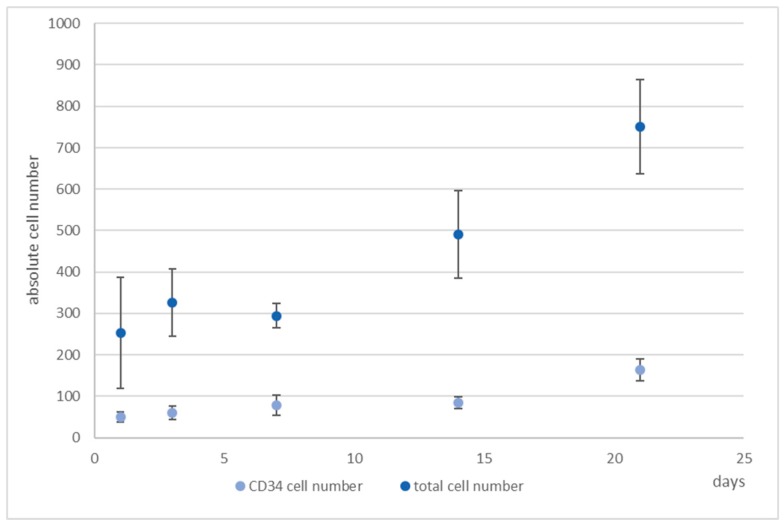
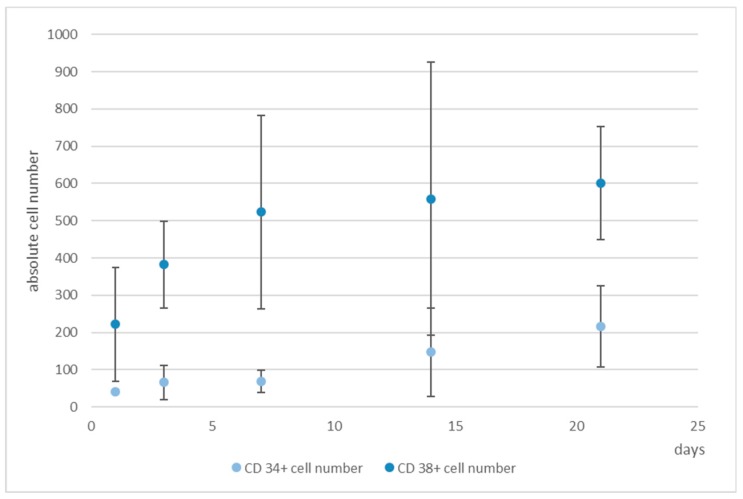
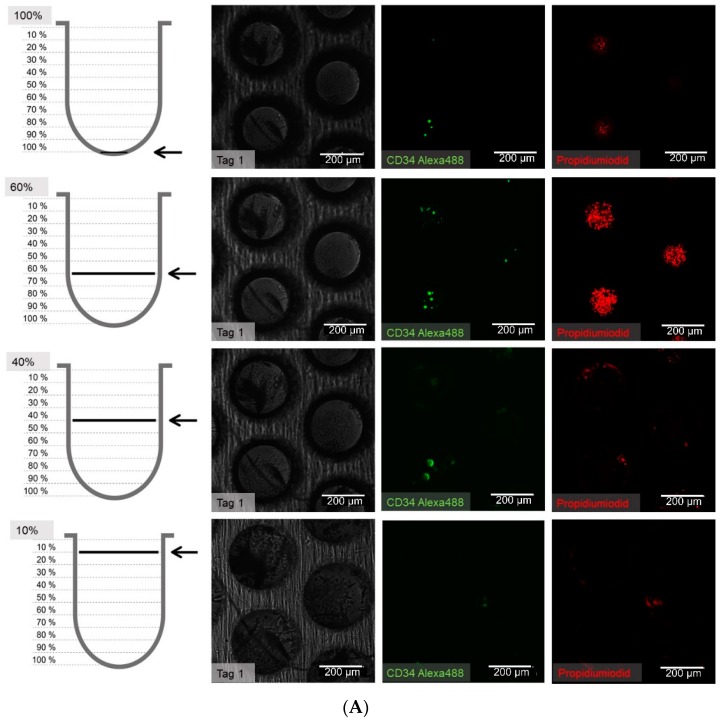
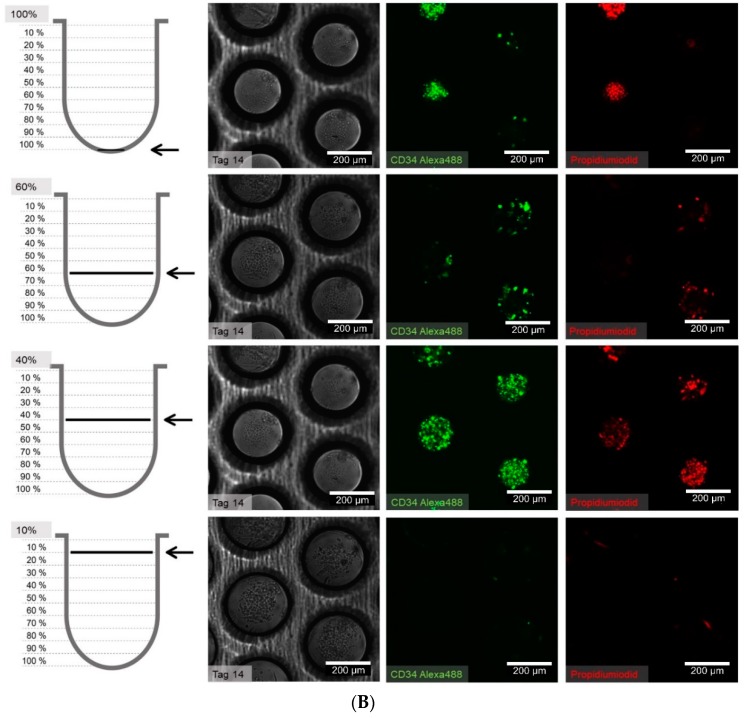
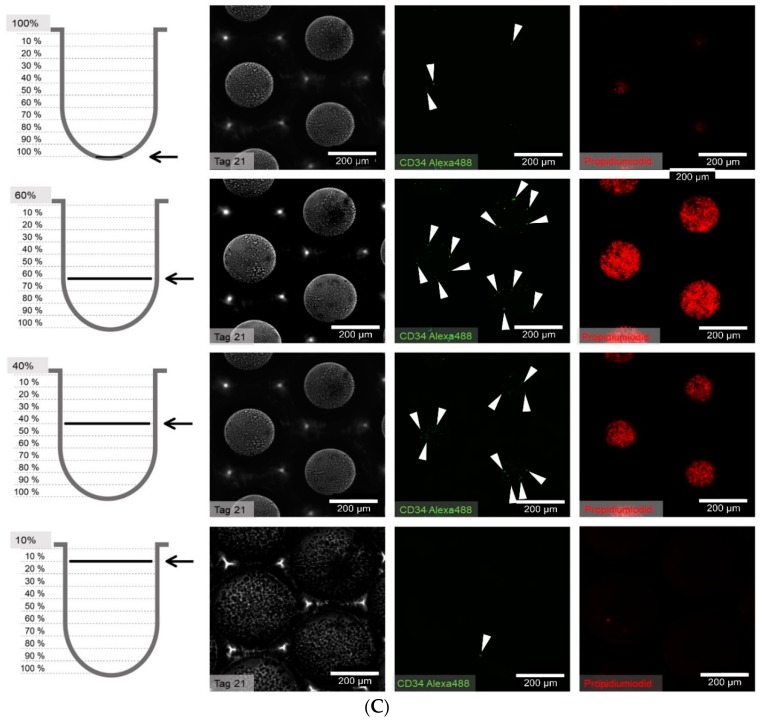
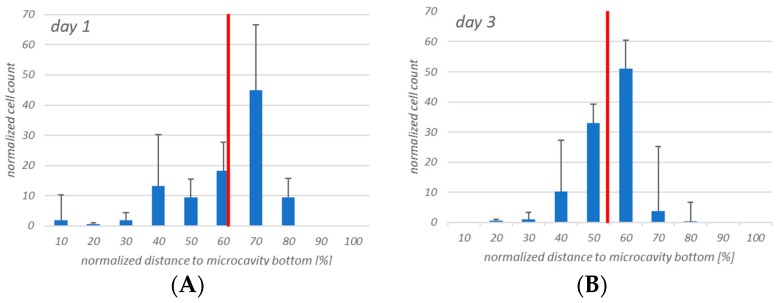
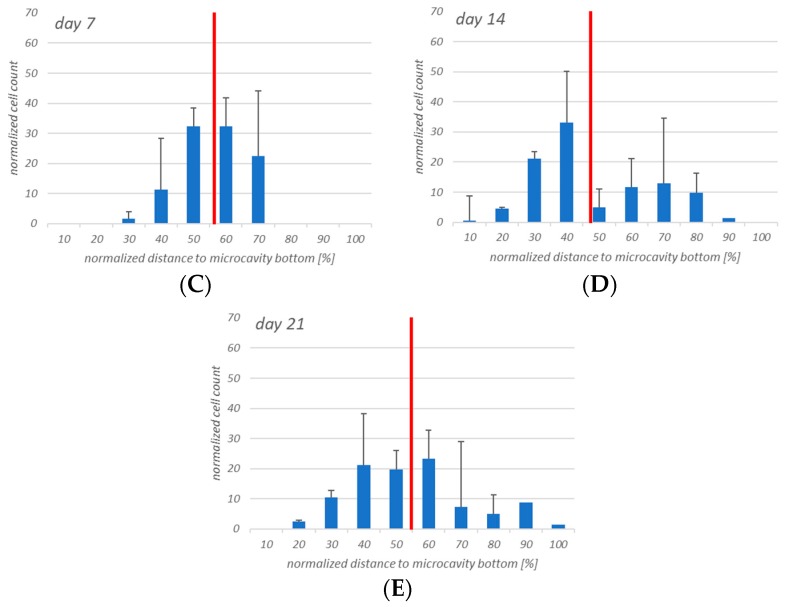
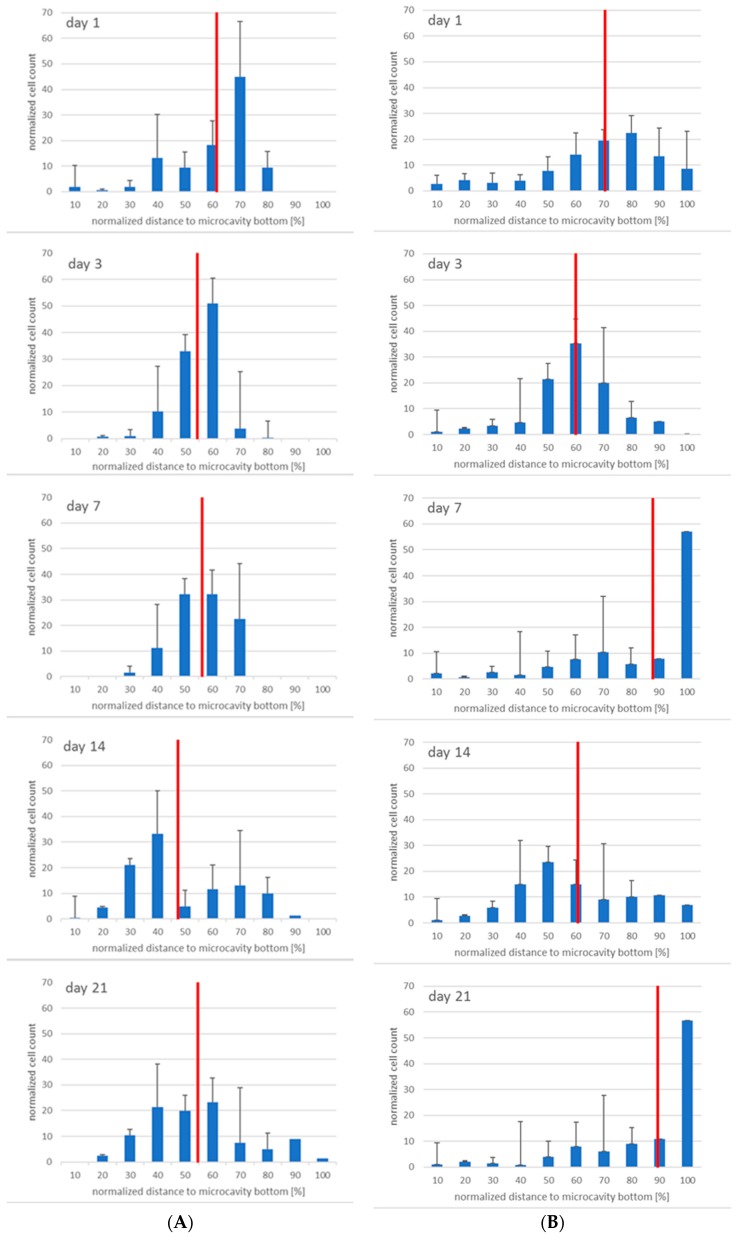
(1) Background: We describe a 4D cell culture platform with which we tried to detect and to characterize migration dynamics of single hematopoietic stem cells in polymer film microcavity arrays integrated into a microtiter plate. (2) Methods: The system was set up with CD34-expressing KG-1a cells as a surrogate for hematopoietic stem cells. We then evaluated the system as an artificial hematopoietic stem cell niche model comprised of a co-culture of human hematopoietic stem cells from cord blood (cord blood CD34+ cells, hHSCs) and human mesenchymal stromal cells (hMSCs) from bone marrow over a period of 21 days. We used a software-based cell detection method to count single hematopoietic stem cells (HSCs) in microcavities. (3) Results: It was possible to detect single HSCs and their migration behavior within single microcavities. The HSCs displayed a pronounced migration behavior with one population of CD34-expressing cells located at the bottom of the microcavities and one population located in the middle of the microcavities at day 14. However, at day 21 the two populations seemed to unite again so that no clear distinction between the two was possible anymore. (4) Conclusions: Single cell migration detection was possible but microscopy and flow cytometry delivered non-uniform data sets. Further optimization is currently being developed.
Keywords: 3D cell culture; 4D microscopy platform; co-culture; hematopoietic progenitor cells; mesenchymal stromal cells; microcavity array.
Conflict of interest statement
Eric Gottwald was CEO of 300MICRONS GmbH at the time when the experiments were carried out.
Figures
References
-
- Schofield R. The relationship between the spleen colony-forming cell and the haemopoietic stem cell. Blood Cells. 1978;4:7–25. - PubMed
LinkOut - more resources
Full Text Sources
