

Breast cancer PAM50 signature: correlation and concordance between RNA-Seq and digital multiplexed gene expression technologies in a triple negative breast cancer series
- PMID: 31159741
- PMCID: PMC6547580
- DOI: 10.1186/s12864-019-5849-0
Breast cancer PAM50 signature: correlation and concordance between RNA-Seq and digital multiplexed gene expression technologies in a triple negative breast cancer series
Abstract
Background: Full RNA-Seq is a fundamental research tool for whole transcriptome analysis. However, it is too costly and time consuming to be used in routine clinical practice. We evaluated the transcript quantification agreement between RNA-Seq and a digital multiplexed gene expression platform, and the subtype call after running the PAM50 assay in a series of breast cancer patients classified as triple negative by IHC/FISH. The goal of this study is to analyze the concordance between both expression platforms overall, and for calling PAM50 triple negative breast cancer intrinsic subtypes in particular.
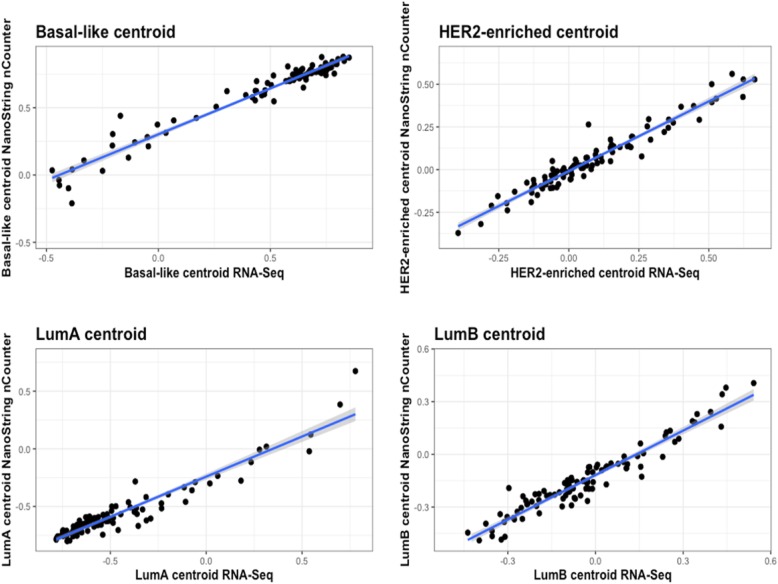
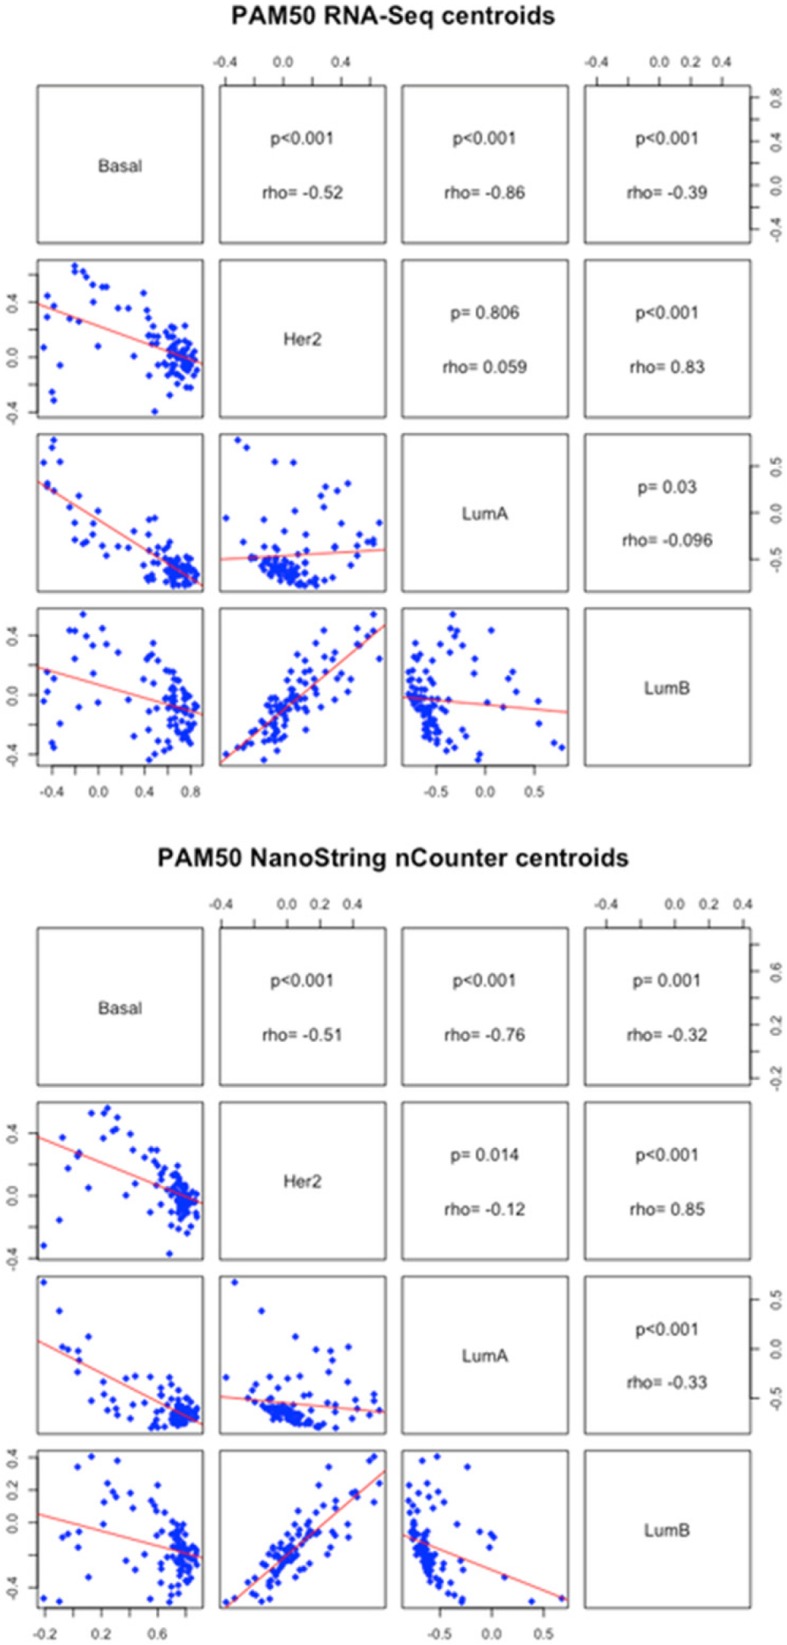
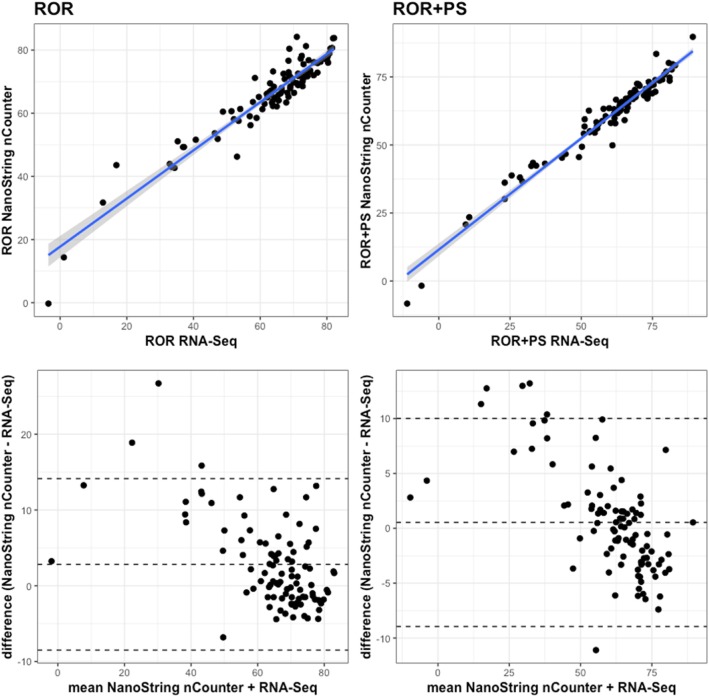
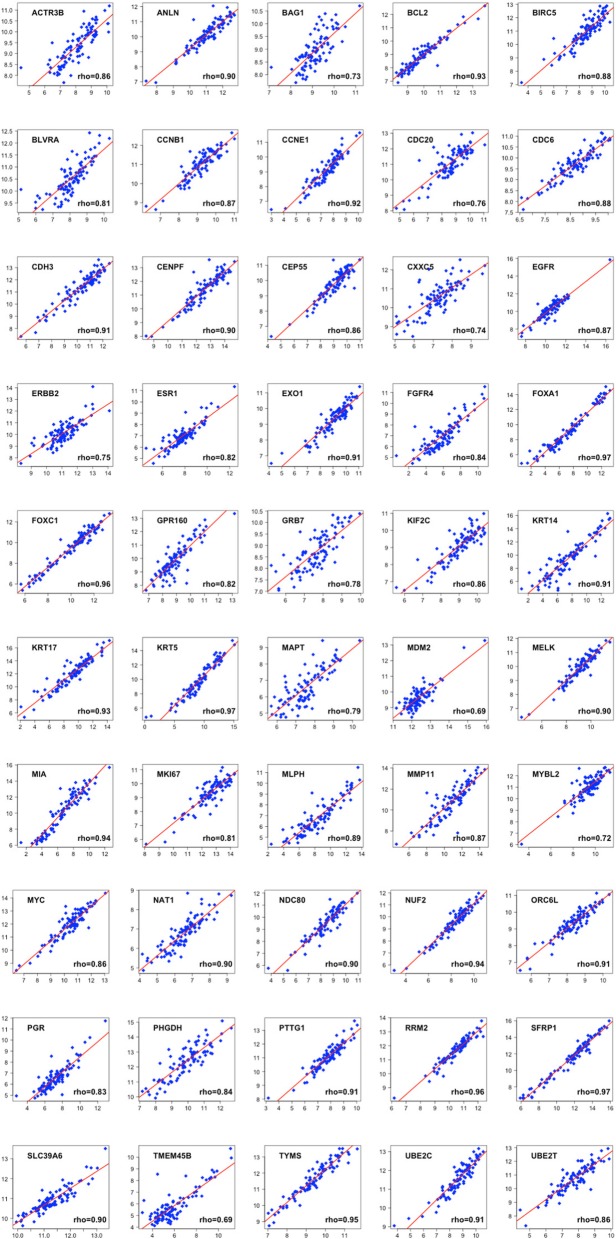
Results: The analyses were performed in paraffin-embedded tissues from 96 patients recruited in a multicenter, prospective, non-randomized neoadjuvant triple negative breast cancer trial (NCT01560663). Pre-treatment core biopsies were obtained following clinical practice guidelines and conserved as FFPE for further RNA extraction. PAM50 was performed on both digital multiplexed gene expression and RNA-Seq platforms. Subtype assignment was based on the nearest centroid classification following this procedure for both platforms and it was concordant on 96% of the cases (N = 96). In four cases, digital multiplexed gene expression analysis and RNA-Seq were discordant. The Spearman correlation to each of the centroids and the risk of recurrence were above 0.89 in both platforms while the agreement on Proliferation Score reached up to 0.97. In addition, 82% of the individual PAM50 genes showed a correlation coefficient > 0.80.
Conclusions: In our analysis, the subtype calling in most of the samples was concordant in both platforms and the potential discordances had reduced clinical implications in terms of prognosis. If speed and cost are the main driving forces then the preferred technique is the digital multiplexed platform, while if whole genome patterns and subtype are the driving forces, then RNA-Seq is the preferred method.
Keywords: Breast cancer; Multiplexed gene expression; PAM50; RNA-Seq; Triple negative breast cancer.
Conflict of interest statement
C.M.P is an equity stock holder, consultant, and Board of Director Member, of BioClassifier LLC. C.M.P is also listed an inventor on patent applications on the Breast PAM50 assay. J.S.P is an inventor on patent applications on the Breast PAM50 assay.
Figures

References
-
- Gnant M, Filipits M, Greil R, Stoeger H, Rudas M, Bago-Horvath Z, et al. Predicting distant recurrence in receptor-positive breast cancer patients with limited clinicopathological risk: using the PAM50 risk of recurrence score in 1478 postmenopausal patients of the ABCSG-8 trial treated with adjuvant endocrine therapy alone. Ann Oncol. 2014;25(2):339–345. doi: 10.1093/annonc/mdt494. - DOI - PubMed
MeSH terms
Substances
Grants and funding
LinkOut - more resources
Full Text Sources
Other Literature Sources
Medical
Molecular Biology Databases
Miscellaneous
