Comparative Study
. 2019 Jun 3;20(1):117.
doi: 10.1186/s13059-019-1720-5.

Comprehensive evaluation of structural variation detection algorithms for whole genome sequencing

Affiliations
Comparative Study

Comprehensive evaluation of structural variation detection algorithms for whole genome sequencing

Shunichi Kosugi et al. Genome Biol. .

Abstract

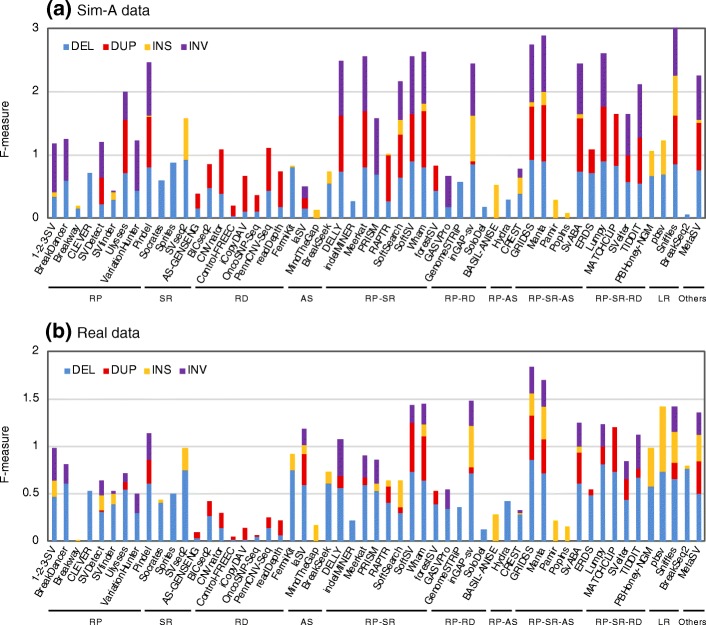
Background: Structural variations (SVs) or copy number variations (CNVs) greatly impact the functions of the genes encoded in the genome and are responsible for diverse human diseases. Although a number of existing SV detection algorithms can detect many types of SVs using whole genome sequencing (WGS) data, no single algorithm can call every type of SVs with high precision and high recall.

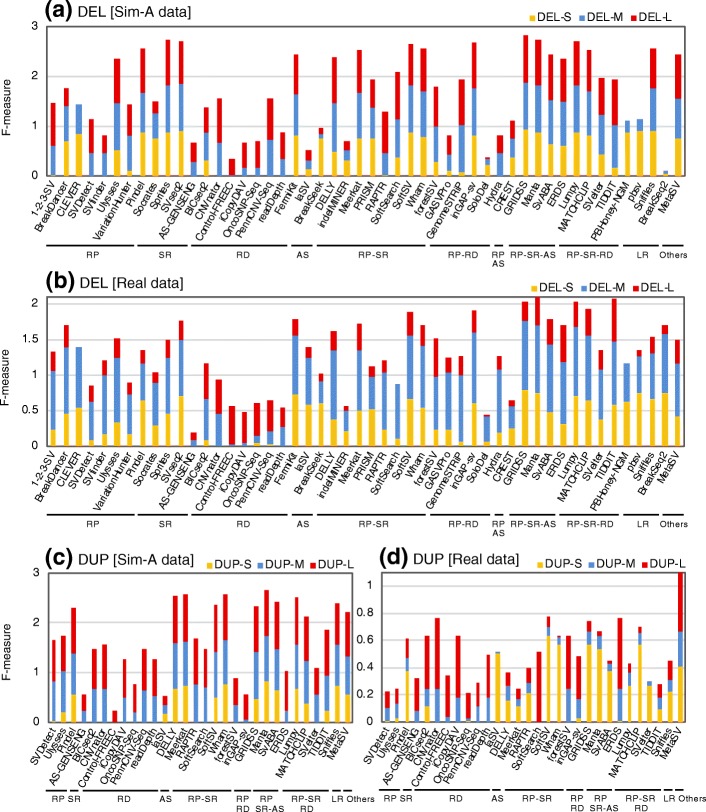
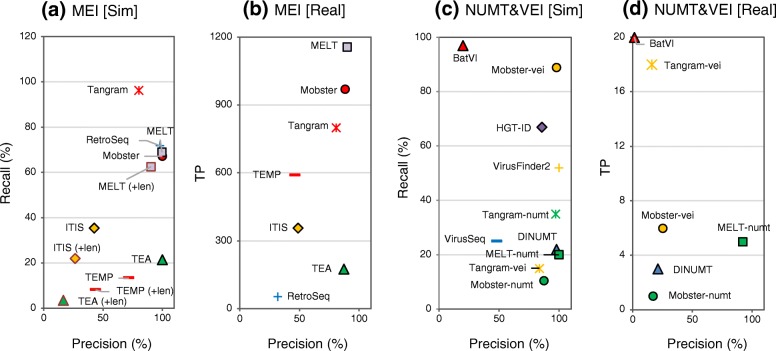
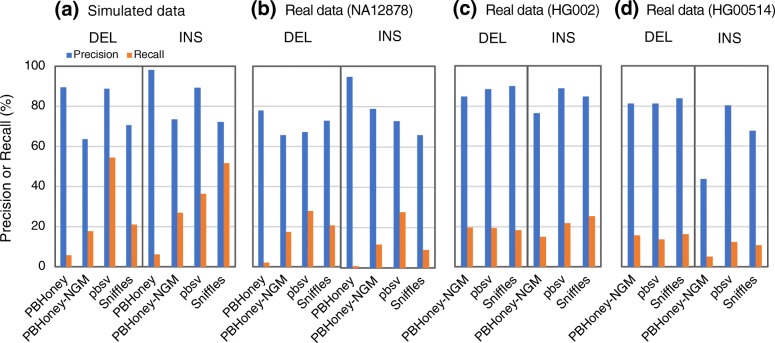
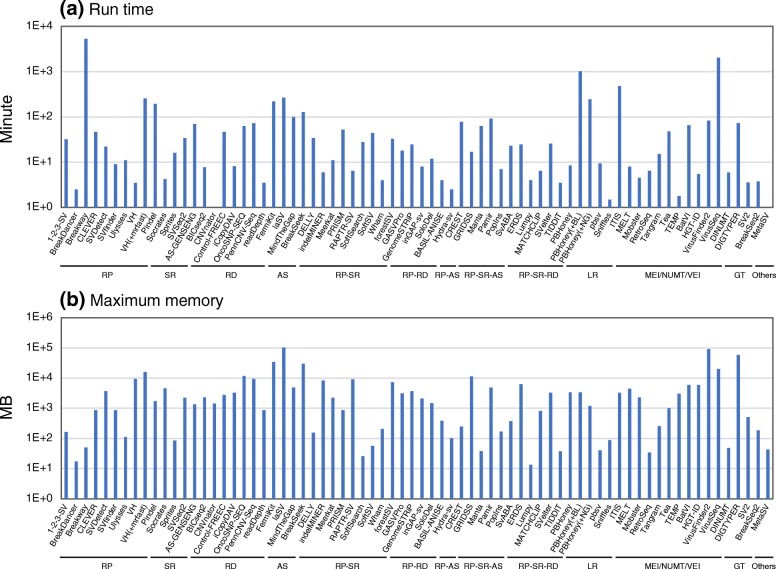
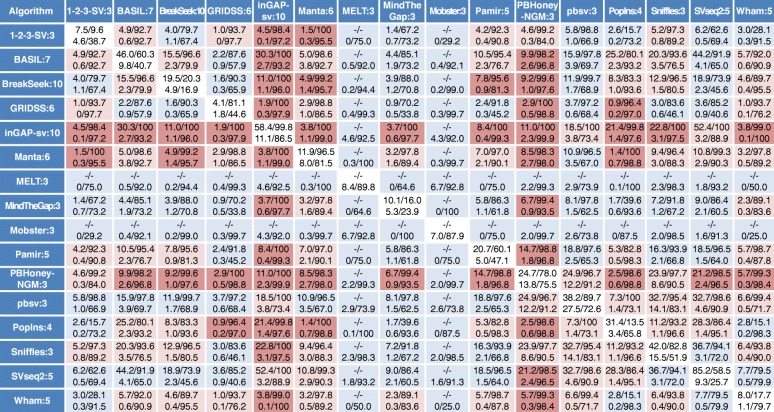
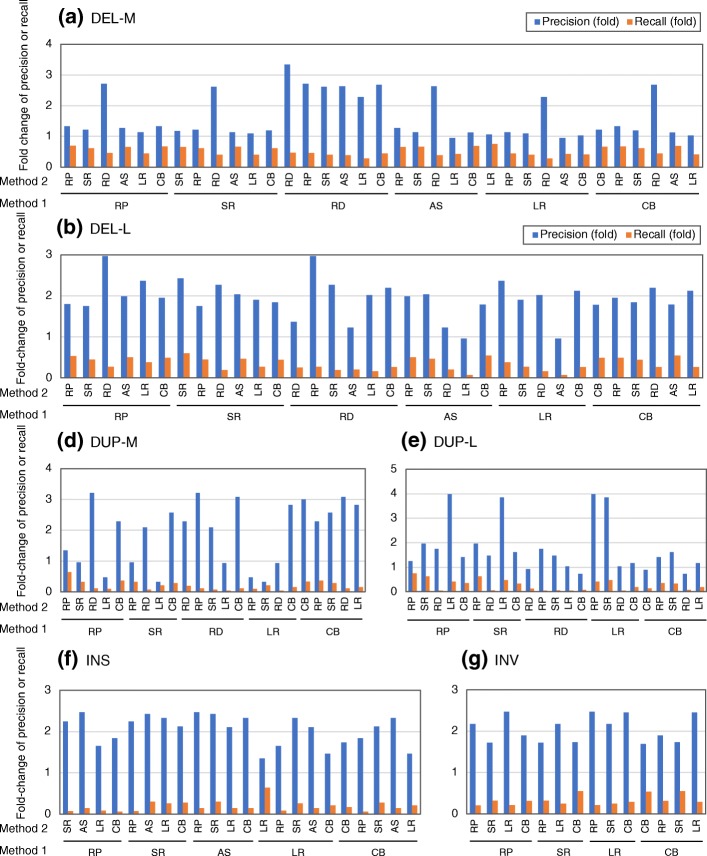
Results: We comprehensively evaluate the performance of 69 existing SV detection algorithms using multiple simulated and real WGS datasets. The results highlight a subset of algorithms that accurately call SVs depending on specific types and size ranges of the SVs and that accurately determine breakpoints, sizes, and genotypes of the SVs. We enumerate potential good algorithms for each SV category, among which GRIDSS, Lumpy, SVseq2, SoftSV, Manta, and Wham are better algorithms in deletion or duplication categories. To improve the accuracy of SV calling, we systematically evaluate the accuracy of overlapping calls between possible combinations of algorithms for every type and size range of SVs. The results demonstrate that both the precision and recall for overlapping calls vary depending on the combinations of specific algorithms rather than the combinations of methods used in the algorithms.

Conclusion: These results suggest that careful selection of the algorithms for each type and size range of SVs is required for accurate calling of SVs. The selection of specific pairs of algorithms for overlapping calls promises to effectively improve the SV detection accuracy.

Keywords: CNV; Copy number variation; Next generation sequencing; SV; Structural variation; WGS.


Conflict of interest statement

The authors declare that they have no competing interests.

Figures

Fig. 1
Fig. 1
SV type specificity of SV detection algorithms. Precision and recall of DELs, DUPs, INSs, and INVs were determined with the simulated (a) and the NA12878 real data (b). Modified F-measures (the combined statistics for precision and recall (see the “Methods” section for details)) are shown for the algorithms indicated with blue (for DEL), red (for DUP), orange (for INS), and purple (for INV) bars. The mean values of the results obtained with the four NA12878 real datasets (three PacBio datasets for long reads) are indicated. The algorithms were categorized according to the methods used to detect SV signals (RP, read pairs; SR, split reads; RD, read depth; AS, assembly; LR, long reads) and their combined methods (RP-SR, RP-RD, RP-AS, RP-SR-AS, and RP-SR-RD)
Fig. 2
Fig. 2
Size range specificity of SV detection algorithms for DELs and DUPs. Precision and recall of each size range of DELs (a, b) and DUPs (c, d) were determined with the simulated (a, c) and the NA12878 real data (b, d). Modified F-measures (the combined statistics for precision and recall) are shown for the algorithms indicated with orange (for S, 100 bp to 1 kb), blue (for M, 1 to 100 kb), and red (for L, 100 kb to 1 Mb) bars. The mean values of the results obtained with the four (or three) NA12878 real datasets are indicated. The algorithms were categorized according to the methods used to detect SV signals, as in Fig. 1
Fig. 3
Fig. 3
Precision and recall of MEIs, NUMTs, and VEIs called using existing algorithms. MEI (a, b), NUMT, and VEI (c, d) insertions were called using the indicated algorithms and simulated data (a, c) and the real data (b, d). NUMTs and VEIs were called using algorithms including modified versions of Mobster, MELT, and Tangram (Mobster-numt, Mobster-vei, MELT-numt, Tangram-numt, and Tangram-vei). For the real data, the mean values of the results obtained with the four NA12878 real datasets (data1 to data4) are indicated. VirusFinder and HGT-ID could not be applied to accomplish the runs for the real data due to unresolvable errors. The precision and recall percentages (or the number of true positives for the real data) determined for the respective call sets are indicated on the x-axis and y-axis, respectively. The data labeled with (+len) were determined considering insertion length in addition to breakpoints in (a). In this case, called sites were judged as true when the ratio of the called MEI lengths and the matched reference MEI length was ≧ 0.5 and ≦ 2.0. The algorithms without the label do not output the defined length of insertions
Fig. 4
Fig. 4
Precision and recall of SV detection algorithms with long read data. Precision and recall determined with the Sim-A-PacBio simulated data (a), the NA12878 real datasets (b), the PacBio-HG002 real data (c), and the PacBio-HG00514 real data (d). For the NA12878 data, the mean values of the results obtained with the three NA12878 long read datasets (PacBio-data1 to PacBio-data3) are indicated
Fig. 5
Fig. 5
a, b Run time and memory consumption for SV detection algorithms. A bam or fastq files of the reads aligned to the NA12878 chromosome 8 (NA12878 data1 or PacBio-data1) was used as input data, and GRCh37 chr8 fasta file was used as reference. Each of the indicated algorithms was run using a single CPU. For VH (VariationHunter) and PBHoney, the data obtained together with the run of the indicated alignment tools (BL, BLASR; NG, NGM-LR) are also shown. For MetaSV, run time and maximum memory without those spent on Pindel and the other required tools are indicated. The algorithms were categorized according to the methods used to detect SV signals (RP, SR, RD, AS, LR, MEI/NUMT/VEI, and others) and their combined methods (RP-SR, RP-RD, RP-AS, RP-SR-AS, and RP-SR-RD)
Fig. 6
Fig. 6
Recall and precision of SVs commonly called between a pair of SV detection algorithms for the INS category. INSs, called from the indicated algorithms, were filtered with the minimum number of reads supporting the called SVs, indicated with the suffix number of the algorithm name. The INSs overlapping between the filtered SV sets from a pair of the indicated algorithms were selected, and the recall and precision of the selected INSs were determined. Recall and precision percentages are presented with an intervening slash, and the recall/precision values for the simulated and real data are indicated in the upper and lower lines of each cell, respectively. Results for the real data represent the mean values of the values determined with four different NA12878 datasets (three PacBio datasets for long reads). The recall/precision values for the individual algorithm are indicated with blue letters and a white background. The data contained in the top 20th percentile of the combined precision scores (see the “Methods” section for details) for the simulated and real data are highlighted with a red background, and the next data contained in the top 21st to 50th percentile of the combined precision scores are shown with a pale red background. “–” indicates undetermined data
Fig. 7
Fig. 7
Increased or decreased rates of precision and recall of overlapped calls between various SV detection methods. Precision and recall values of overlapped calls between pairs of algorithms based on the indicated six different methods were determined for different SV categories (DEL-M (a), DEL-L (b), DUP-S (c), DUP-M (d), DUP-L (e), INS (f), and INV (g)) using four sets of NA12878 real data. The mean values (presented in Additional file 3: Table S18 in detail) were summarized based on pairs of methods (method 1 and method 2) by calculating the fold increase of precision or recall of overlapped calls relative to those for method 1 alone. RP, method using read pairs-based signal; RD, method using read depth-based signal; SR, method using split (soft-clipped) reads-based signal; AS, assembly-based approach; LR, method using long reads, CB; combined method using two or more methods out of RP, SR, RD, and AS

References

    1. Abyzov A, Li S, Kim DR, Mohiyuddin M, Stutz AM, Parrish NF, et al. Analysis of deletion breakpoints from 1,092 humans reveals details of mutation mechanisms. Nat Commun. 2015;6:7256. doi: 10.1038/ncomms8256. - DOI - PMC - PubMed
    1. Alkan C, Coe BP, Eichler EE. Genome structural variation discovery and genotyping. Nat Rev Genet. 2011;12:363–376. doi: 10.1038/nrg2958. - DOI - PMC - PubMed
    1. Stankiewicz P, Lupski JR. Structural variation in the human genome and its role in disease. Annu Rev Med. 2010;61:437–455. doi: 10.1146/annurev-med-100708-204735. - DOI - PubMed
    1. Dennis MY, Eichler EE. Human adaptation and evolution by segmental duplication. Curr Opin Genet Dev. 2016;41:44–52. doi: 10.1016/j.gde.2016.08.001. - DOI - PMC - PubMed
    1. Sudmant PH, Mallick S, Nelson BJ, Hormozdiari F, Krumm N, Huddleston J, et al. Global diversity, population stratification, and selection of human copy-number variation. Science. 2015;349:aab3761. doi: 10.1126/science.aab3761. - DOI - PMC - PubMed

Publication types

LinkOut - more resources