. 2019 Jun 3;7(1):83.
doi: 10.1186/s40168-019-0701-y.

Ruminal microbiome-host crosstalk stimulates the development of the ruminal epithelium in a lamb model

Affiliations

Ruminal microbiome-host crosstalk stimulates the development of the ruminal epithelium in a lamb model

Limei Lin et al. Microbiome. .

Abstract

Background: The development of the rumen is an important physiological challenge for young ruminants. Previous studies have shown that starter feeding can effectively facilitate the growth and development of the rumen in ruminants. However, the mechanism through which starter feeding stimulates the development of the rumen is not clear. Here, we performed an integrated analysis in ruminal microbiota and a host transcriptomic profile in a lamb model with the intervention of starter feed to understand the ruminal microbiome-host crosstalk in stimulating the development of the ruminal epithelium.

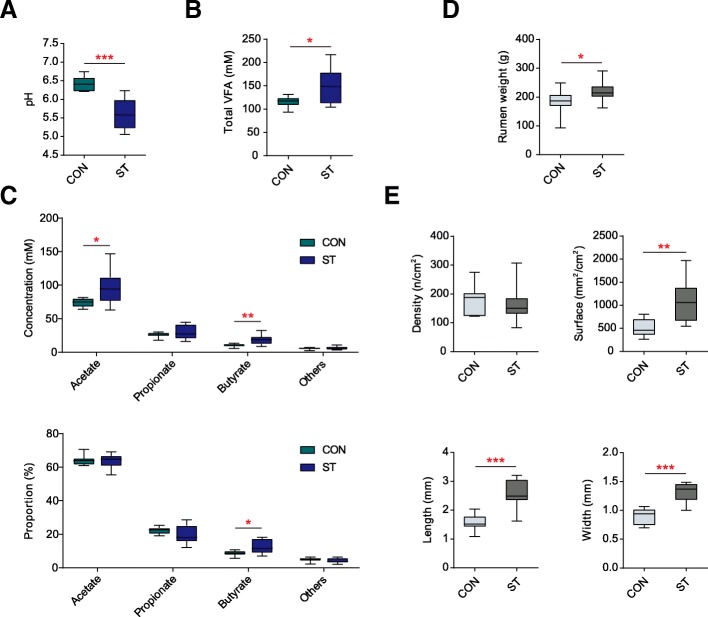
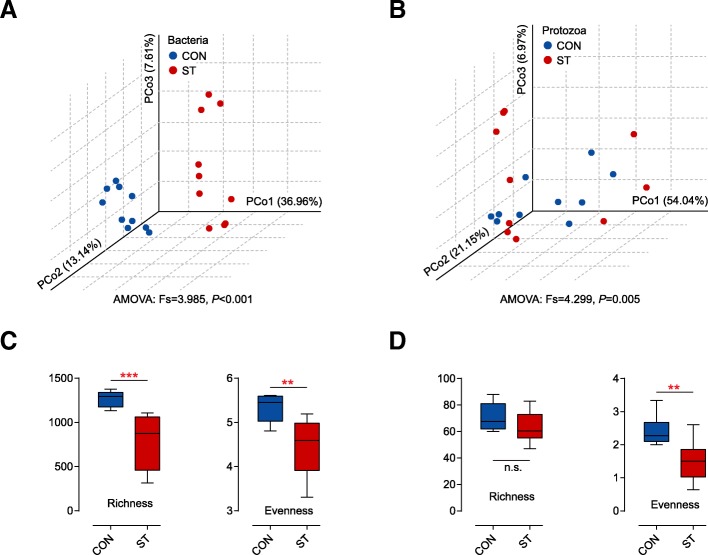
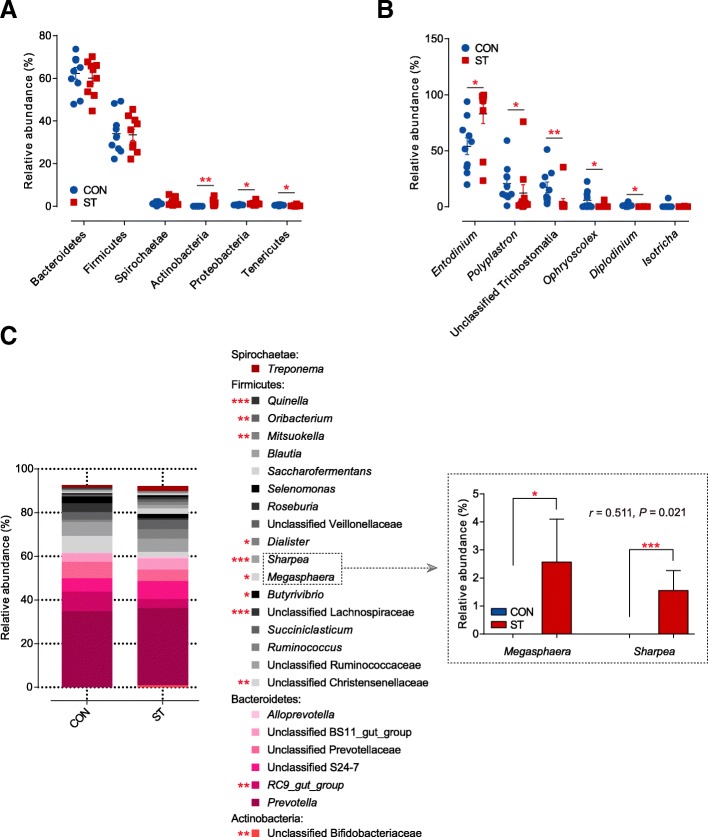
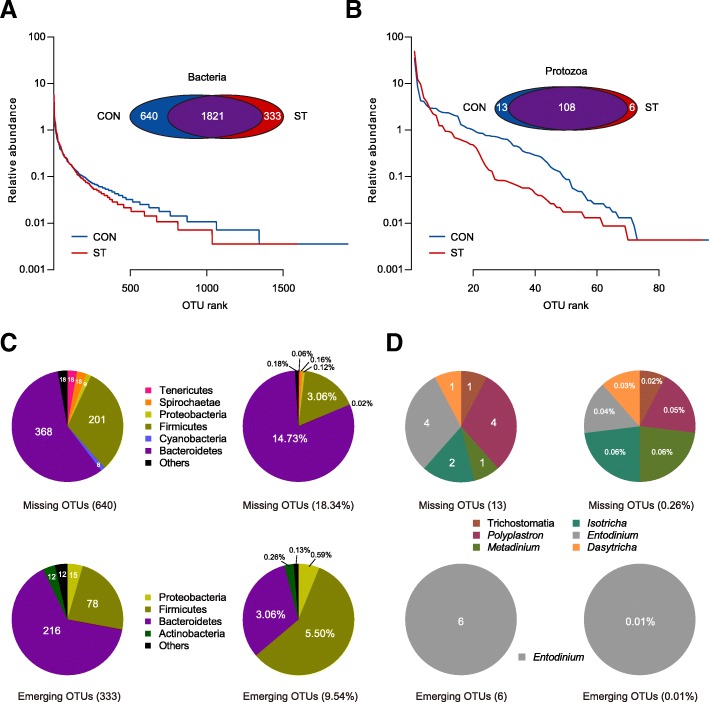
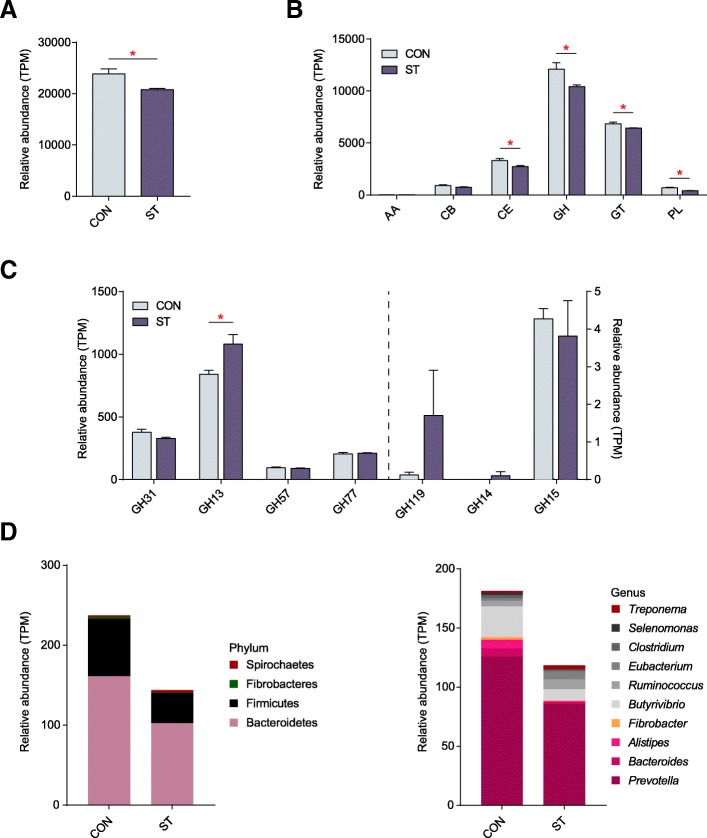
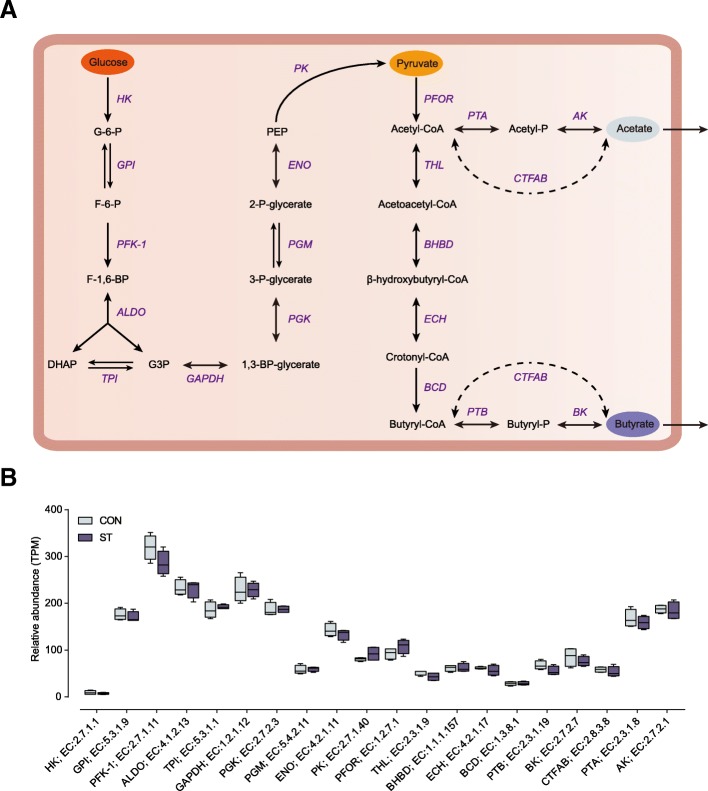
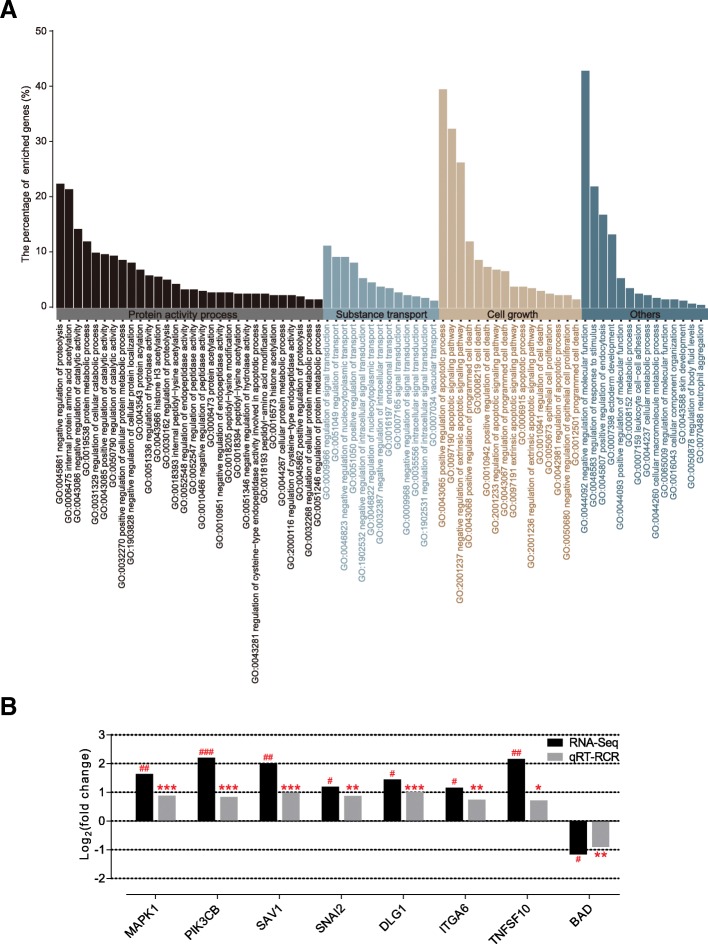
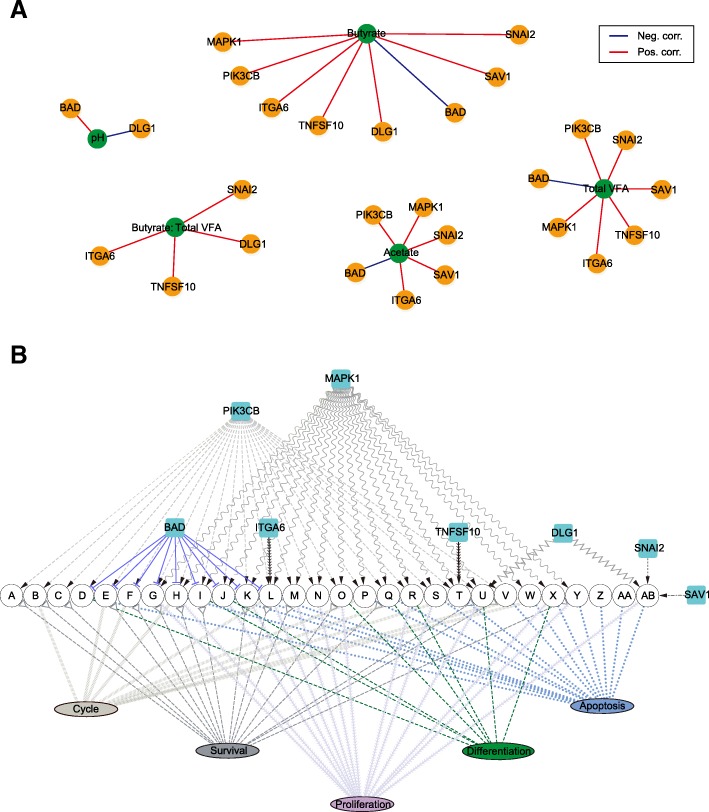
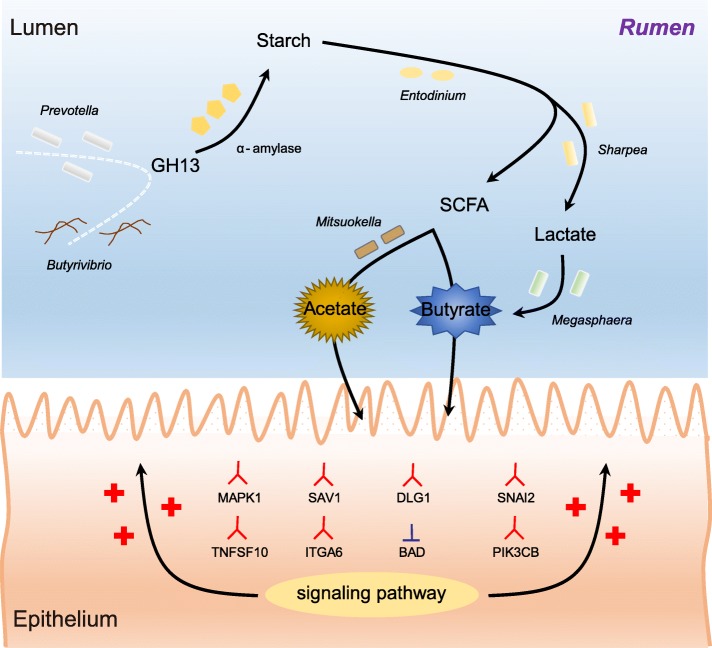
Results: Decreased ruminal pH and increased acetate and butyrate concentrations in the rumen, followed by increasing rumen organ index, were observed in lambs supplemented with starter. Using metagenome sequencing in combination with 16S rRNA and 18S rRNA gene amplicon sequencing, the results showed the abundance of acetate-producing Mitsuokella spp., lactate-producing Sharpea spp., lactate-utilizing Megasphaera spp., and Entodinium spp. was enriched in rumen microbial communities in the starter-feed group. The abundances of genes involved in sugar degradation were decreased in starter-feed lambs, but the GH13 encoding α-amylase was obviously increased. Rumen epithelial transcriptome analysis revealed that seven differentially expressed genes, including MAPK1, PIK3CB, TNFSF10, ITGA6, SNAI2, SAV1, and DLG, related to the cell growth module were upregulated, and BAD's promotion of cell death was downregulated. Correlation analysis revealed that the increase in the concentrations of acetate and butyrate significantly correlated with the expression of these genes, which indicates acetate and butyrate likely acted as important drivers in the ruminal microbiome-host crosstalk.

Conclusions: The present study comprehensively describes the symbiotic relationship between the rumen microbiota and the host in lambs after starter feeding. Our data demonstrates that the microbiome-driven generation of acetate and butyrate mediated the growth-related genes' regulation of the growth-associated signalling pathway in the ruminal epithelium. These co-development networks regulated many physiological processes in the epithelium, including papillae morphology and rumen epithelial growth.

Keywords: Crosstalk; Lamb; Rumen; Starter feeding; Symbiotic microbiome.


Conflict of interest statement

The authors declare that they have no competing interests.

Figures

Fig. 1
Fig. 1
Effects of starter feeding on the rumen fermentation parameter: including lumen pH (a) and the concentration of total VFA (b). c Comparisons of the concentrations and proportion of acetate: propionate and butyrate in the lumen between the CON and ST groups (n = 10 per group). d Comparison of the rumen weight emptied the digesta between the two groups (n = 10 per group). e Comparisons of the parameters of rumen epithelial papillae between the two groups (n = 10 per group). *p < 0.05, **p < 0.01, ***p < 0.001
Fig. 2
Fig. 2
Principal coordinate analysis (PCoA) profile of ruminal bacterial diversity (a) and ciliate protozoal diversity (b) between the CON and ST groups (n = 10 per group) using a Bray-Curtis metric. AMOVA analysis showed significant differences between the two groups (p < 0.05). c Effects of starter feeding on the rumen bacterial richness (number of observed species) and evenness (Shannon diversity index values) at the 3% dissimilarity level. d Effects of starter feeding on the rumen ciliate protozoal richness (number of observed species) and evenness (Shannon diversity index values) at the 3% dissimilarity level. **p < 0.01, ***p < 0.001. n.s., not statistically significant
Fig. 3
Fig. 3
a Dominant phyla of bacteria that more than 0.5% at least one group were compared between the CON and ST groups (n = 10 per group). b Dominant genera of ciliate protozoa that more than 0.5% at least one group were compared between two groups. c Stacked bar graphs showing average percent reads of dominant genera of bacteria that more than 0.5% at least one group. The Spearman correlation coefficient and significance test based on the relative abundance of Megasphaera and Sharpea are shown on the right. *p < 0.05, **p < 0.01, ***p < 0.001
Fig. 4
Fig. 4
a Rank abundance curves and Venn diagram based on the average reads of bacteria community in the rumen of lambs (n = 10 per group). b Rank abundance curves and Venn diagram based on the average reads of the ciliate protozoa community in the rumen of lambs (n = 10 per group). c Pie charts showing the number and relative abundance of missing and emerging OTUs based on the OTU level of bacteria. The different colours of the parts represent the different taxonomic distribution of the OTUs at the phylum level. d Pie charts showing the number and relative abundance of missing and emerging OTUs based on the OTU level of the ciliate protozoa. The different colours of the parts represent the different taxonomic distribution of the OTUs at the family or genus level
Fig. 5
Fig. 5
a Comparisons of the total abundance of CAZymes genes of rumen microbiomes of lambs in the CON and ST groups by the Mann−Whiney U test (n = 4 per group). b Comparisons of the relative abundance of the CAZymes gene families of the rumen microbiomes of lambs in the CON and ST groups (n = 4 per group). c Comparisons of the gene abundance of the GH family gene-coded amylolytic enzymes in the rumen of lambs in the CON and ST groups (n = 4 per group). *p < 0.05. d Phylogenetic distribution of sequences in GH13 assigned to the identified phylum and genus
Fig. 6
Fig. 6
a Metabolic routes for butyrate and acetate production by direct conversion from carbohydrates. G, glucose; P, phosphate; F, fructose. b Comparisons of the relative abundance of KO enzymes related to the butyrate and acetate production pathway of lambs in the CON and ST groups by the Mann−Whiney U test (n = 4 per group). The lines inside the squares represent the median. There is no significant difference in all enzymes
Fig. 7
Fig. 7
a Gene ontology analysis of genes based on DEGs. The enriched genes of 73 significantly altered GO terms include the regulation of three modules: protein activity processes (modification and degradation), substance transport, and cell growth (apoptosis and proliferation) are displayed on the histogram plot. Only terms with p < 0.05 were considered. b Differentially expressed genes related to the cell growth module in the rumen epithelium of lambs in the ST group (n = 4) compared with the CON group (n = 4). The values are presented as log2 (fold change). The FDR was calculated based on the p value. #FDR < 0.05, ##FDR < 0.01, ###FDR < 0.001. qRT-PCR validation of transcriptomic results in the rumen epithelium of lambs in the ST group (n = 10) compared with the CON group (n = 10). The values are presented as log2 (fold change). *p < 0.05, **p < 0.01, ***p < 0.001
Fig. 8
Fig. 8
a The Spearman correlation coefficient revealed the association between the changes of fermentation parameters and the expression of these eight growth-related genes (SCC > 0.85 and p < 0.01). The lines’ colour represents two kinds of correlation: blue, negative correction and red, positive correction. b The co-regulation network of these eight genes is related to rumen epithelium growth. The arrow represents the activation of the signalling pathway, and the horizontal line represents the inhibition of the signalling pathway. The signalling pathways and functions involved in the network were predicted by the KEGG pathway analysis. The different colour lines represent different functions that these pathways regulated. Abbreviations: A, B cell receptor signalling pathway; B, Jak-STAT signalling pathway; C, mTOR signalling pathway; D, cGMP-PKG signalling pathway; E, ErbB signalling pathway; F, Ras signalling pathway; G, VEGF signalling pathway; H, thyroid hormone signalling pathway; I, neurotrophin signalling pathway; J, insulin signalling pathway; K, cAMP signalling pathway; L, PI3K-Akt signalling pathway; M, Rap1 signalling pathway; N, prolactin signalling pathway; O, phospholipase D signalling pathway; P, oestrogen signalling pathway; Q, chemokine signalling pathway; R, oxytocin signalling pathway; S, HIF-1 signalling pathway; T, FoxO signalling pathway; U, T cell receptor signalling pathway; V, TNF signalling pathway; W, TGF-beta signalling pathway; X, MAPK signalling pathway; Y, sphingolipid signalling pathway; Z, NF-kappa B signalling pathway; AA, RIG-I-like receptor signalling pathway; AB, hippo signalling pathway
Fig. 9
Fig. 9
Proposed model of the generation of VFAs and the mediation for the growth-related genes in the rumen epithelium of lambs after the starter feeding. The red branch represents activation, and the inverted-T represents inhibition. The plus sign represents the growth of the rumen epithelium

References

    1. Godoy-Vitorino F, Goldfarb KC, Karaoz U, Leal S, Garcia-Amado MA, Hugenholtz P, Tringe SG, Brodie EL, Dominguez-Bello MG. Comparative analyses of foregut and hindgut bacterial communities in hoatzins and cows. Isme J. 2012;6:531–541. doi: 10.1038/ismej.2011.131. - DOI - PMC - PubMed
    1. Rosenberg E, Zilber-Rosenberg I. The hologenome concept of evolution after 10 years. Microbiome. 2018;6:78. doi: 10.1186/s40168-018-0457-9. - DOI - PMC - PubMed
    1. Russell JB, Rychlik JL. Factors that alter rumen microbial ecology. Science. 2001;292:1119–1122. doi: 10.1126/science.1058830. - DOI - PubMed
    1. Shabat SK, Sasson G, Doron-Faigenboim A, Durman T, Yaacoby S, Berg Miller ME, White BA, Shterzer N, Mizrahi I. Specific microbiome-dependent mechanisms underlie the energy harvest efficiency of ruminants. Isme J. 2016;10:2958–2972. doi: 10.1038/ismej.2016.62. - DOI - PMC - PubMed
    1. Costello EK, Keaton S, Les D, Bohannan BJM, Relman DA. The application of ecological theory toward an understanding of the human microbiome. Science. 2012;336:1255–1262. doi: 10.1126/science.1224203. - DOI - PMC - PubMed

Publication types