

Integrative analysis of DNA methylation suggests down-regulation of oncogenic pathways and reduced somatic mutation rates in survival outliers of glioblastoma
- PMID: 31159876
- PMCID: PMC6545689
- DOI: 10.1186/s40478-019-0744-0
Integrative analysis of DNA methylation suggests down-regulation of oncogenic pathways and reduced somatic mutation rates in survival outliers of glioblastoma
Erratum in
-
Publisher Correction to: Acta Neuropathologica Communications, volume 7.Acta Neuropathol Commun. 2019 Aug 14;7(1):131. doi: 10.1186/s40478-019-0784-5. Acta Neuropathol Commun. 2019. PMID: 31412936 Free PMC article.
Abstract
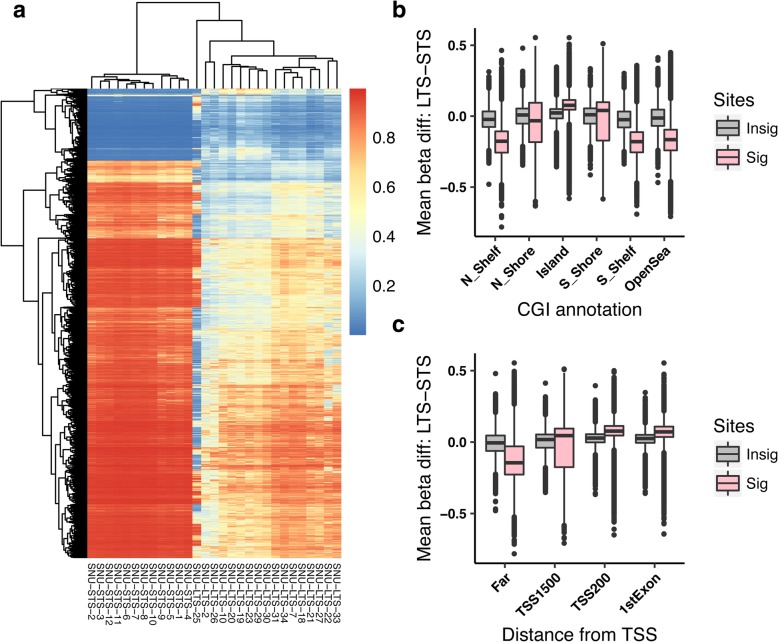
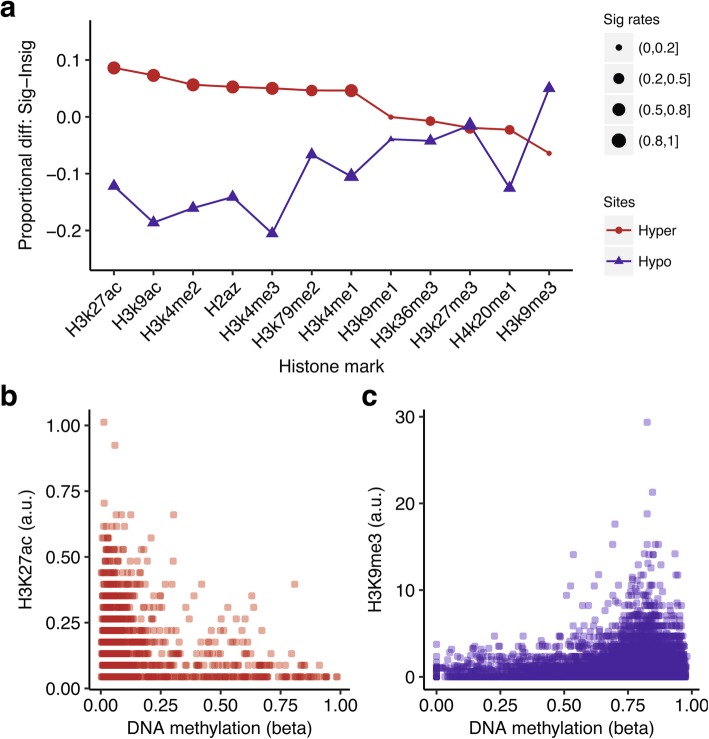
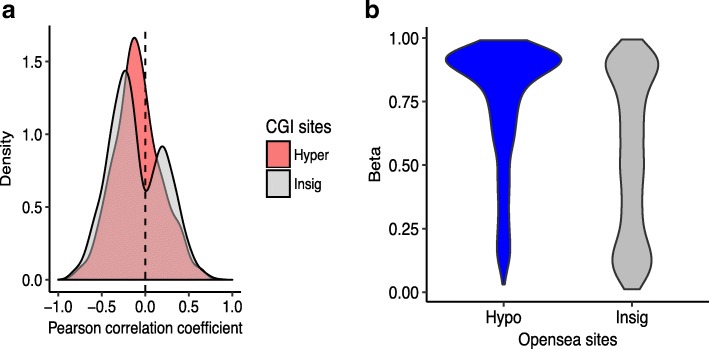
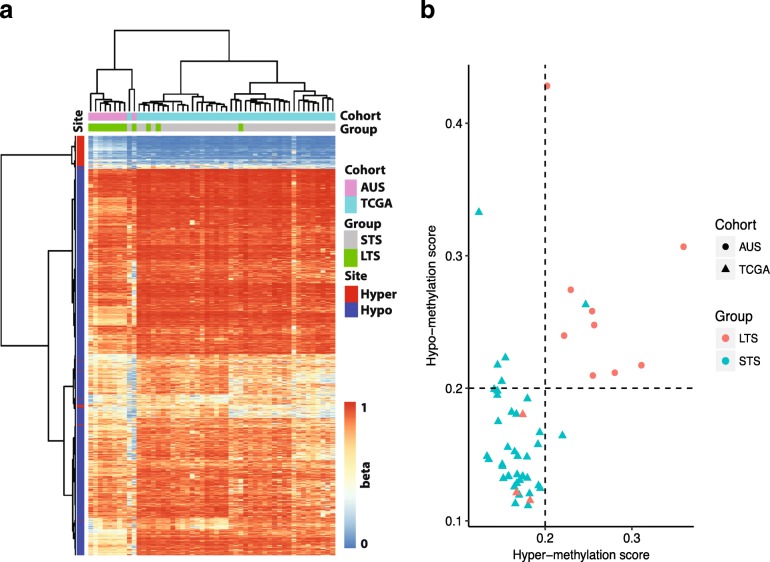
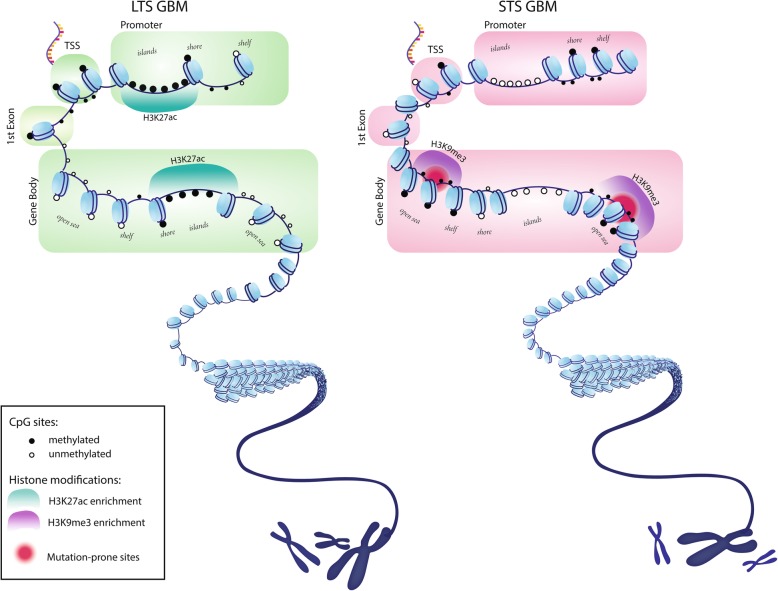
The study of survival outliers of glioblastoma can provide important clues on gliomagenesis as well as on the ways to alter clinical course of this almost uniformly lethal cancer type. However, there has been little consensus on genetic and epigenetic signatures of the long-term survival outliers of glioblastoma. Although the two classical molecular markers of glioblastoma including isocitrate dehydrogenase 1 or 2 (IDH1/2) mutation and O6-methylguanine DNA methyltransferase (MGMT) promoter methylation are associated with overall survival rate of glioblastoma patients, they are not specific to the survival outliers. In this study, we compared the two groups of survival outliers of glioblastoma with IDH wild-type, consisting of the glioblastoma patients who lived longer than 3 years (n = 17) and the patients who lived less than 1 year (n = 12) in terms of genome-wide DNA methylation profile. Statistical analyses were performed to identify differentially methylated sites between the two groups. Functional implication of DNA methylation patterns specific to long-term survivors of glioblastoma were investigated by comprehensive enrichment analyses with genomic and epigenomic features. We found that the genome of long-term survivors of glioblastoma is differentially methylated relative to short-term survivor patients depending on CpG density: hypermethylation near CpG islands (CGIs) and hypomethylation far from CGIs. Interestingly, these two patterns are associated with distinct oncogenic aspects in gliomagenesis. In the long-term survival glioblastoma-specific sites distant from CGI, somatic mutations of glioblastoma are enriched with higher DNA methylation, suggesting that the hypomethylation in long-term survival glioblastoma can contribute to reduce the rate of somatic mutation. On the other hand, the hypermethylation near CGIs associates with transcriptional downregulation of genes involved in cancer progression pathways. Using independent cohorts of IDH1/2- wild type glioblastoma, we also showed that these two patterns of DNA methylation can be used as molecular markers of long-term survival glioblastoma. Our results provide extended understanding of DNA methylation, especially of DNA hypomethylation, in cancer genome and reveal clinical importance of DNA methylation pattern as prognostic markers of glioblastoma.
Keywords: DNA methylation; Genome-wide analyses; Glioblastoma; Long-term survivor.
Conflict of interest statement
The authors declare that they have no competing interests.
Figures
References
-
- Amelot A, De Cremoux P, Quillien V, Polivka M, Adle-Biassette H, Lehmann-Che J, Francoise L, Carpentier AF, George B, Mandonnet E, Froelich S. IDH-mutation is a weak predictor of long-term survival in glioblastoma patients. PLoS One. 2015;10(7):e0130596. doi: 10.1371/journal.pone.0130596. - DOI - PMC - PubMed
-
- Burton EC, Lamborn KR, Feuerstein BG, Prados M, Scott J, Forsyth P, Passe S, Jenkins RB, Aldape KD. Genetic aberrations defined by comparative genomic hybridization distinguish long-term from typical survivors of glioblastoma. Cancer Res. 2002;62(21):6205–6210. - PubMed
-
- Burton EC, Lamborn KR, Forsyth P, Scott J, O’Campo J, Uyehara-Lock J, Prados M, Berger M, Passe S, Uhm J, O’Neill BP, Jenkins RB, Aldape KD. Aberrant p53, mdm2, and proliferation differ in glioblastomas from long-term compared with typical survivors. Clin Cancer Res. 2002;8(1):180–187. - PubMed
-
- Ceccarelli M, Barthel FP, Malta TM, Sabedot TS, Salama SR, Murray BA, Morozova O, Newton Y, Radenbaugh A, Pagnotta SM, Anjum S, Wang J, Manyam G, Zoppoli P, Ling S, Rao AA, Grifford M, Cherniack AD, Zhang H, Poisson L, Carlotti CG, Jr, Tirapelli DP, Rao A, Mikkelsen T, Lau CC, Yung WK, Rabadan R, Huse J, Brat DJ, Lehman NL, Barnholtz-Sloan JS, Zheng S, Hess K, Rao G, Meyerson M, Beroukhim R, Cooper L, Akbani R, Wrensch M, Haussler D, Aldape KD, Laird PW, Gutmann DH, Noushmehr H, Iavarone A, Verhaak RG. Molecular profiling reveals biologically discrete subsets and pathways of progression in diffuse glioma. Cell. 2016;164(3):550–563. doi: 10.1016/j.cell.2015.12.028. - DOI - PMC - PubMed
Publication types
MeSH terms
Substances
Grants and funding
LinkOut - more resources
Full Text Sources
Medical
Molecular Biology Databases
Research Materials
Miscellaneous
