. 2019 Jun 4:8:e41517.
doi: 10.7554/eLife.41517.

Genetic diversity of CHC22 clathrin impacts its function in glucose metabolism

Affiliations

Genetic diversity of CHC22 clathrin impacts its function in glucose metabolism

Matteo Fumagalli et al. Elife. .

Abstract

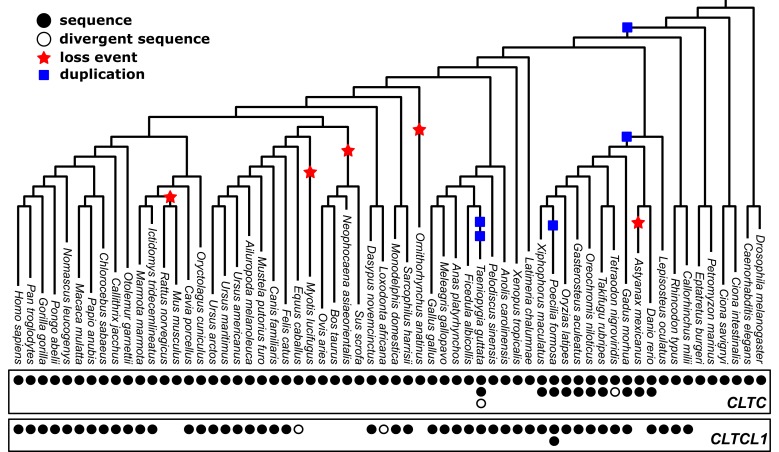
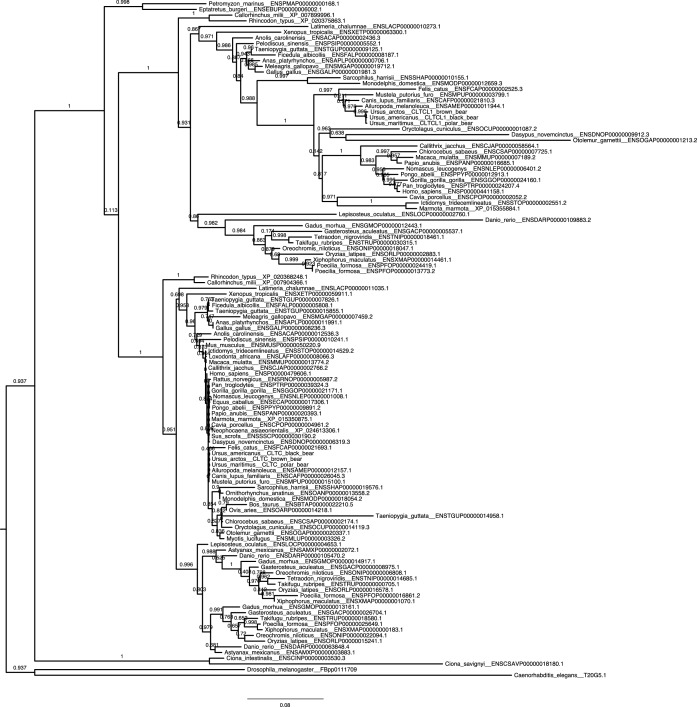
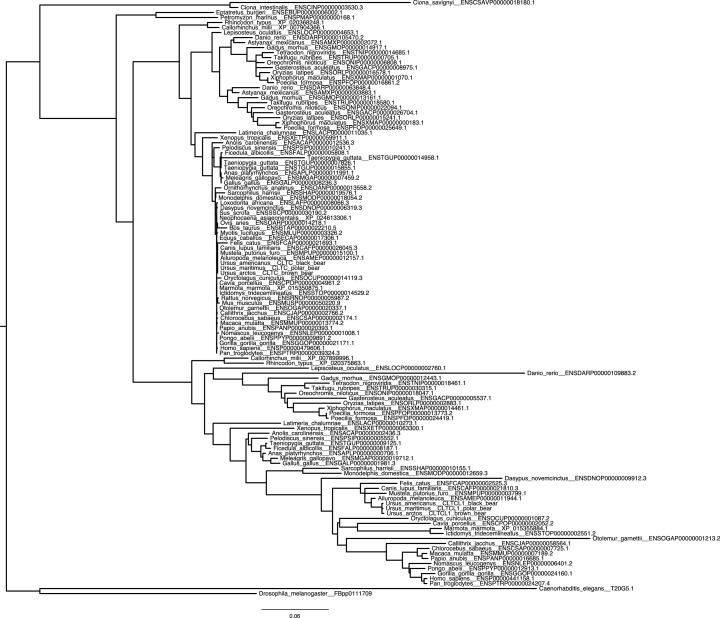
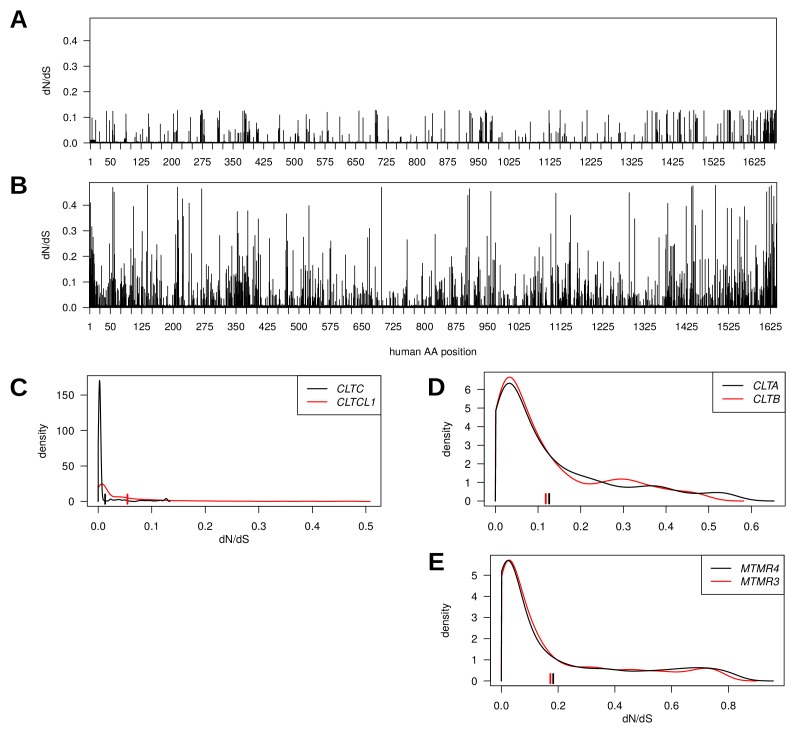
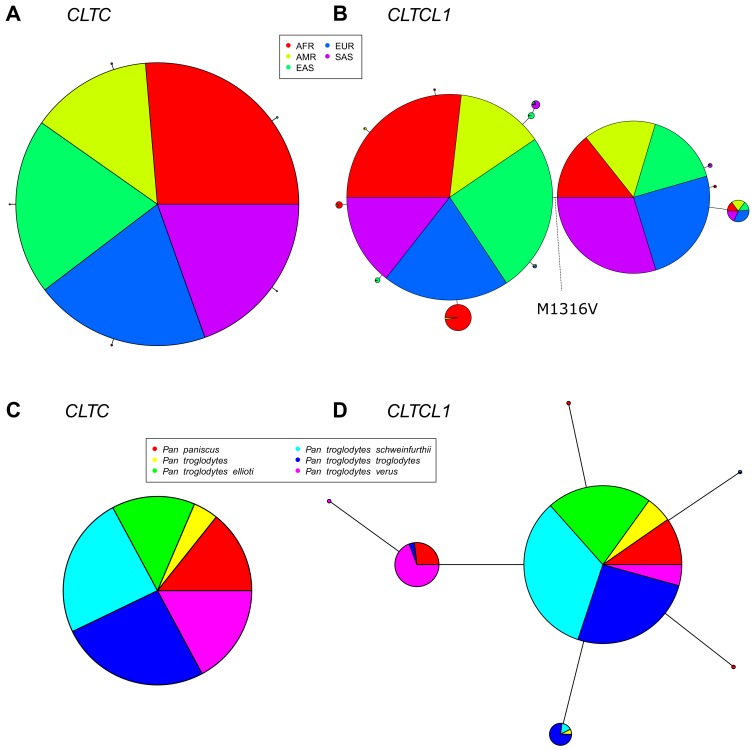
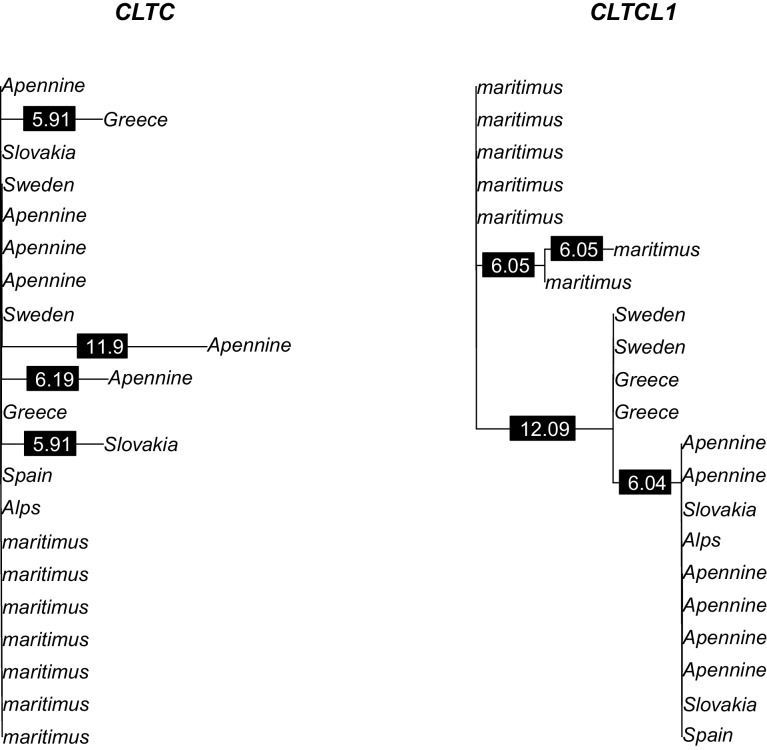
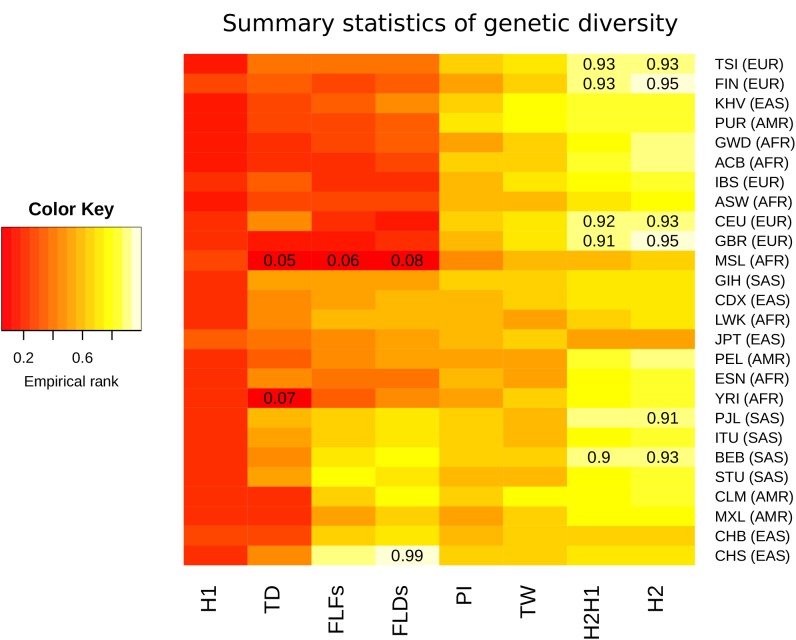
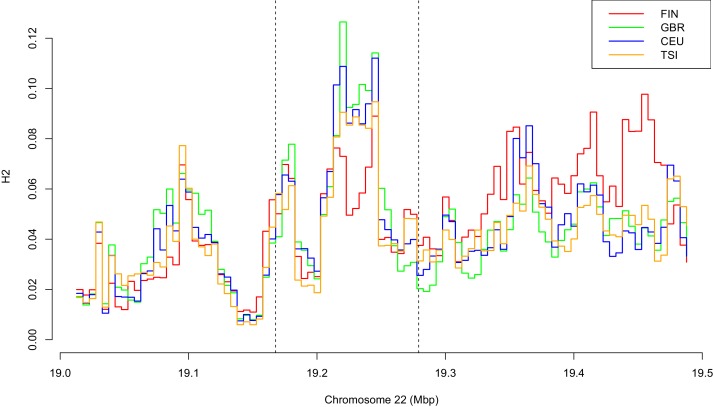
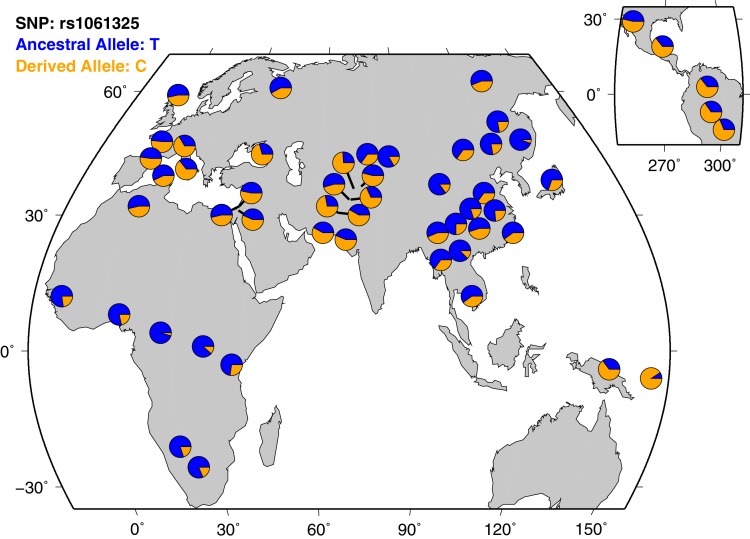
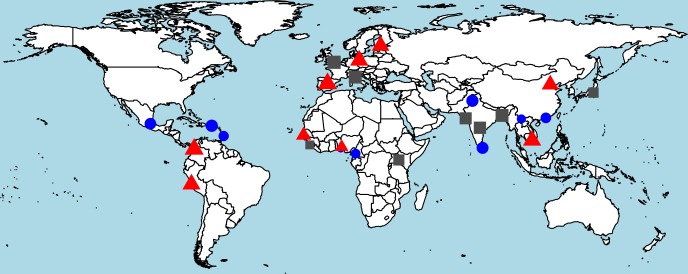
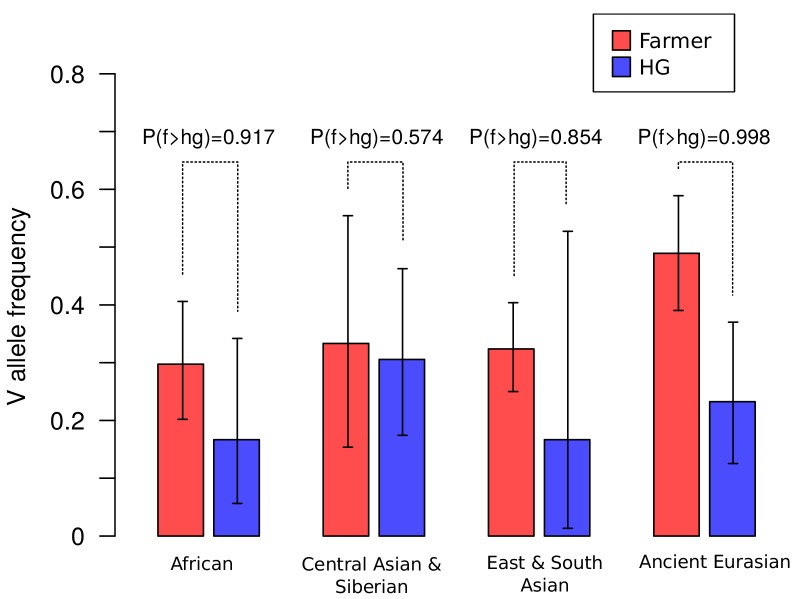
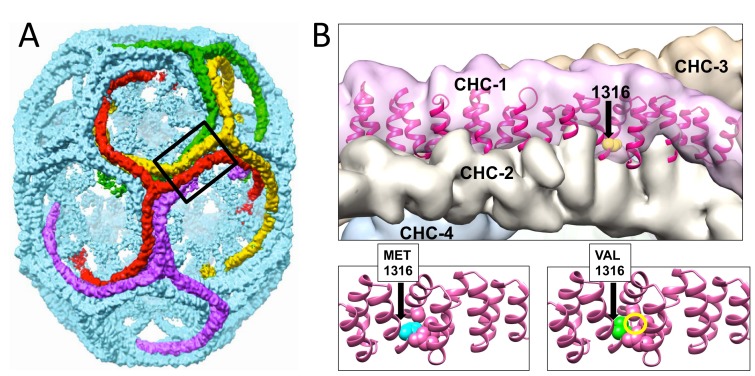
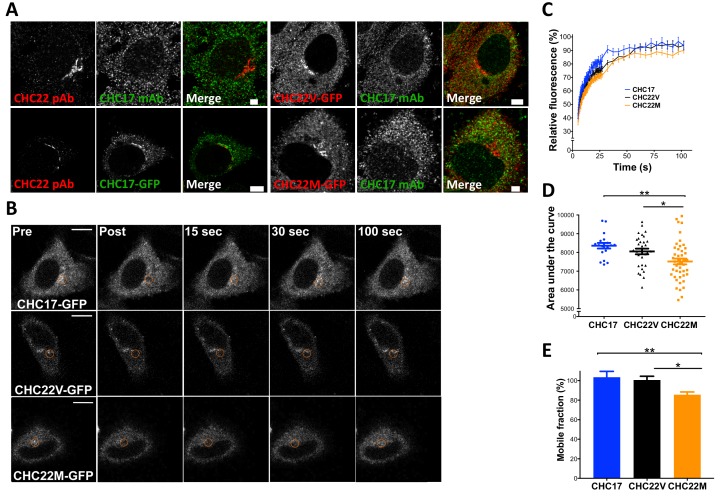
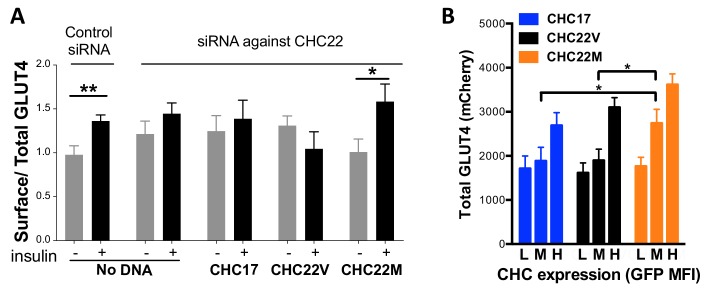
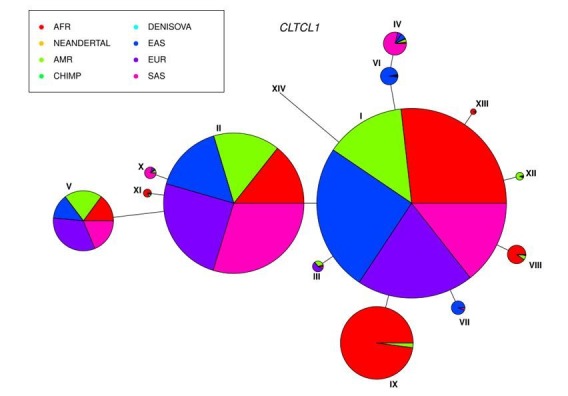
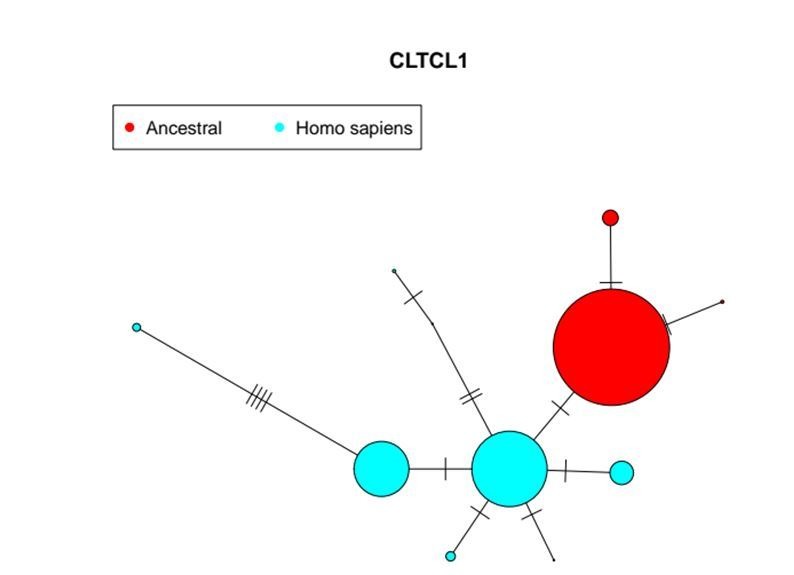
CHC22 clathrin plays a key role in intracellular membrane traffic of the insulin-responsive glucose transporter GLUT4 in humans. We performed population genetic and phylogenetic analyses of the CHC22-encoding CLTCL1 gene, revealing independent gene loss in at least two vertebrate lineages, after arising from gene duplication. All vertebrates retained the paralogous CLTC gene encoding CHC17 clathrin, which mediates endocytosis. For vertebrates retaining CLTCL1, strong evidence for purifying selection supports CHC22 functionality. All human populations maintained two high frequency CLTCL1 allelic variants, encoding either methionine or valine at position 1316. Functional studies indicated that CHC22-V1316, which is more frequent in farming populations than in hunter-gatherers, has different cellular dynamics than M1316-CHC22 and is less effective at controlling GLUT4 membrane traffic, altering its insulin-regulated response. These analyses suggest that ancestral human dietary change influenced selection of allotypes that affect CHC22's role in metabolism and have potential to differentially influence the human insulin response.

Keywords: cell biology; evolutionary biology; evolutionary selection; human; insulin response; membrane traffic.


Conflict of interest statement

MF, SC, YD, AB, MC, PN, AJ, LA, AB, RR, IM, MT, PP, MT, FB No competing interests declared

Figures

Figure 1.
Figure 1.. Phylogenetic analysis of CLTC/CLTCL1 reveals independent loss of the gene encoding CHC22 clathrin from vertebrate lineages and complete conservation of the gene encoding CHC17 clathrin.
Phylogenetic profiles of CLTC/CLTCL1 are shown, with gene presence in the corresponding genome indicated by a filled black circle. All sequences used have less than 5% unspecified residues (‘X’s in the relevant database). Divergent gene sequences with low sequence similarity but that still fall within the CLTC clade are shown as empty circles (see Materials and methods for similarity threshold and sequence IDs). Based on the profile and species tree the most parsimonious phylogenetic tree for loss and duplication events is inferred and shown as red stars and blue squares, respectively.
Figure 1—figure supplement 1.
Figure 1—figure supplement 1.. Unreconciled phylogenetic tree for CLTC and CLTCL1 across all investigated species.
Figure 1—figure supplement 2.
Figure 1—figure supplement 2.. Reconciled phylogenetic tree (therefore missing support values) for CLTC and CLTCL1 across all investigated species.
Figure 2.
Figure 2.. Genes encoding clathrin heavy chains show evidence for purifying selection with CLTCL1 (CHC22-encoding) being more variable than CLTC (CHC17-encoding) over evolutionary time.
Evolutionary rates expressed as dN/dS ratios are shown for each position in CLTC (A) and CLTCL1 (B). Rates are averages over an entire phylogenetic tree and therefore not specific to the human proteins. However, to assist interpretation, only rates for residues present in the human proteins are shown. Kernel density estimates of the distributions of dN/dS ratios per paralogous pair of proteins (C–E). CLTA and CLTB encode clathrin light chains A and B, respectively. MMTR3 and MMTR4 encode myotubularin lipid phosphatases. Mean dN/dS ratios averaged over all sites are shown as hatched marks.
Figure 3.
Figure 3.. The CLTCL1 gene encoding human CHC22 has two major variants, and is highly polymorphic relative to the human CLTC gene encoding CHC17, with a similar pattern in chimpanzees.
Median joining network of human alleles for CLTC (A) and CLTCL1 (B) are shown. Each circle represents a unique allele whose global frequency is proportional to its circle’s size and the line length between circles is proportional to the number of non-synonymous changes between alleles. For CLTC, the least common alleles have a frequency ranging from 0.04% and 0.06% and the circles representing them were magnified by a factor of 10. For CLTCL1, only alleles with a frequency greater than 20% were plotted. The two major alleles show a combined frequency of 77% while the other alleles depicted in the figure have a frequency ranging from 0.44% to 5.67%. Segregation of the M1316V variation is depicted with a hashed line, with alleles carrying the M variant on the left-hand side, and alleles carrying the V variant on the right-hand side. The meta-populations in which the allele is found are indicated in color representing their percentage of the total frequency of the allele in humans. Meta-populations analyzed are African (AFR), American (AMR), East Asian (EAS), European (EUR), South Asian (SAS). (C–D) Median joining network of CLTC (C) and CLTCL1 (D) alleles for chimpanzees (Pan troglodytes, four identified subspecies and one unidentified) and bonobos (Pan paniscus). The species and subspecies in which each variant is found are indicated in color representing their percentage of the of the total frequency of the variant in chimpanzees and bonobos.
Figure 3—figure supplement 1.
Figure 3—figure supplement 1.. Phylogenetic trees of amino acid sequences for CLTC and CLTCL1 in the bear samples analyzed.
Polar bear samples are labeled as ‘maritimus’ while brown bear samples are labeled by the sampling country. Branch labels indicate branch lengths in 1/10,000 units.
Figure 4.
Figure 4.. Summary statistics for genetic diversity of CLTCL1 indicate selection over neutral variation.
For each human population (on the rows) we calculated several summary statistics to analyze diversity (on the columns, defined in Materials and methods) and reported their percentile rank against their corresponding empirical distribution based on 500 control genes. The resulting matrix was then sorted on both axes as a dendrogram (not reported) based on the pairwise distances between each pair of populations. The populations analyzed, with their abbreviations, are listed in Supplementary file 1a, and the inclusive meta-population is indicated in parentheses, defined as in the legend to Figure 3. As depicted in the color legend, red and yellow denote low and high percentile ranks, respectively. Percentiles lower than 0.10 or greater than 0.90 are given in the corresponding cell.
Figure 4—figure supplement 1.
Figure 4—figure supplement 1.. Variation of H2 statistics along a genomic region surrounding CLTCL1 in four European populations, with abbreviations as defined in Supplementary file 1a.
Each window has a size of 20 kbp and step is five kbp.
Figure 4—figure supplement 2.
Figure 4—figure supplement 2.. Geographical distribution of M1316- and V1316-encoding alleles across human populations in the HGDP-CEPH panel data set.
The ancestral allele T refers to amino acid M, while the derived nucleotide C refers to V.
Figure 4—figure supplement 3.
Figure 4—figure supplement 3.. Worldwide distribution of heterozygosity of M1316- and V1316-encoding alleles.
A red triangle indicates an excess of heterozygosity (third tertile of the ratio between observed and expected heterozygosity), a blue circle a deficiency of heterozygosity (first tertile), and a gray square otherwise. The size of each symbol is proportional to the frequency of heterozygous genotypes.
Figure 5.
Figure 5.. Frequencies of the V1316 variant of CHC22 trend higher in populations of farmers compared to hunter-gatherers.
Maximum a posteriori estimates and 95% highest posterior density credible intervals of the frequency of V1316 are compared for modern and ancient hunter-gatherer (HG) and farmer populations indigenous to three continents. Probability of the V allele being at a higher frequency in farmers, labeled as P(f > hg), is also reported.
Figure 6.
Figure 6.. Modeling of the structural changes in clathrin caused by the methionine-valine dimorphism at residue 1316 predicts conformational alteration.
Model of the CHC17 clathrin lattice (A) is reproduced with permission (Fotin et al., 2004) with the region comprising residue 1316 boxed. Panel B (top part) is the magnified boxed region in A with a CHC22-M1316 model (residues 1210 to 1516) docked into one of the four clathrin heavy chains (CHC-1) forming the edge of the lattice. The black arrow shows the location of the amino acid residue 1316 with the side chain highlighted in CHC-1. The density of the other three CHCs is indicated. Computational models of human CHC22 (residues 1210 to 1516) with either Met or Val at position 1316 (B, lower parts). The yellow circle encloses space opened by reducing the side chain size, which would require a shift in CHC torque to regain structurally favorable side chain contacts.
Figure 7.
Figure 7.. The CHC22-M1316 and CHC22-V1316 allotypes have different dynamics of membrane association, as measured by fluorescence recovery after photobleaching (FRAP).
HeLa cells were transfected with CHC22-M1316-GFP (CHC22M) or CHC22-V1316-GFP (CHC22V) or CHC17-GFP and the expressed constructs were localized relative to endogenous CHC22 and CHC17, which were also compared to each other (A). Endogenous CHC22, CHC17 and the transfected proteins were visualized by immunofluorescence with anti-CHC22 rabbit polyclonal antibody (pAb, red), anti-CHC17 mouse monoclonal antibody (mAb, green) and anti-GFP chicken polyclonal antibody (green for CHC17-GFP or red for CHC22-GFP), respectively. Bars represent 3 μm (untransfected and CHC22M-GFP) and 5 μm (CHC22V-GFP and CHC17-GFP). Transfectants were photobleached in the circular region indicated (B) and recovery of fluorescence (FRAP) was visualized over time (bars, 10 μm) and quantified within the bleached regions (C). For the data in (C), area under the curves (D) and mobile fractions Mf (E) were calculated (Lippincott-Schwartz et al., 2001). We performed a one-way analysis of variance (ANOVA) with Tukey’s multiple comparison post-hoc test: * p-value<0.05, ** p-value<0.01.
Figure 8.
Figure 8.. Differences in intracellular GLUT4 sequestration and stability occur in cells expressing the CHC22-M1316 or CHC22-V1316 allotypes.
HeLa cells were treated with siRNA to deplete endogenous CHC22 or with control siRNA, then transfected to co-express HA-GLUT4-mCherry along with CHC17-GFP (CHC17), CHC22-M1316-GFP (CHC22M) or CHC22-V1316-GFP (CHC22V) (A and B). Total levels of expressed GLUT4 and CHC were measured by FACS (mean fluorescence intensity (MFI) for mCherry or GFP, respectively). Surface levels of GLUT4 were measured with anti-HA antibody at basal conditions (-) or after 30 min of exposure to insulin (+) and surface/total GLUT4 is reported as a measure of GLUT4 translocation to the cell surface (A) in cells expressing equivalent total levels of CHC-GFP. The extent of GLUT4 translocation was assessed in each experimental group before and after insulin stimulation; Student t-test, * p-value<0.05. Transfected cells treated with siRNA to deplete endogenous CHC22, but not treated with insulin, were gated into thirds expressing equivalently low (L), medium (M) and high (H) levels of CHC-GFP for each type of CHC, then total levels of HA-GLUT4-mCherry in each population were plotted (B). We performed a one-way analysis of variance (ANOVA) with Tukey’s multiple comparison post-hoc test: * p-value<0.05.
Author response image 1.
Author response image 2.

Similar articles

Cited by

References

    1. Adey A, Burton JN, Kitzman JO, Hiatt JB, Lewis AP, Martin BK, Qiu R, Lee C, Shendure J. The haplotype-resolved genome and epigenome of the aneuploid HeLa cancer cell line. Nature. 2013;500:207–211. doi: 10.1038/nature12064. - DOI - PMC - PubMed
    1. Adzhubei IA, Schmidt S, Peshkin L, Ramensky VE, Gerasimova A, Bork P, Kondrashov AS, Sunyaev SR. A method and server for predicting damaging missense mutations. Nature Methods. 2010;7:248–249. doi: 10.1038/nmeth0410-248. - DOI - PMC - PubMed
    1. Alexander DH, Novembre J, Lange K. Fast model-based estimation of ancestry in unrelated individuals. Genome Research. 2009;19:1655–1664. doi: 10.1101/gr.094052.109. - DOI - PMC - PubMed
    1. Amores A, Catchen J, Ferrara A, Fontenot Q, Postlethwait JH. Genome evolution and meiotic maps by massively parallel DNA sequencing: spotted gar, an outgroup for the teleost genome duplication. Genetics. 2011;188:799–808. doi: 10.1534/genetics.111.127324. - DOI - PMC - PubMed
    1. Auton A, Brooks LD, Durbin RM, Garrison EP, Kang HM, Korbel JO, Marchini JL, McCarthy S, McVean GA, Abecasis GR, 1000 Genomes Project Consortium A global reference for human genetic variation. Nature. 2015;526:68–74. doi: 10.1038/nature15393. - DOI - PMC - PubMed

Publication types