. 2019 Jun 13;177(7):1933-1947.e25.
doi: 10.1016/j.cell.2019.04.044. Epub 2019 May 31.

Illuminating G-Protein-Coupling Selectivity of GPCRs

Affiliations

Illuminating G-Protein-Coupling Selectivity of GPCRs

Asuka Inoue et al. Cell. .

Abstract

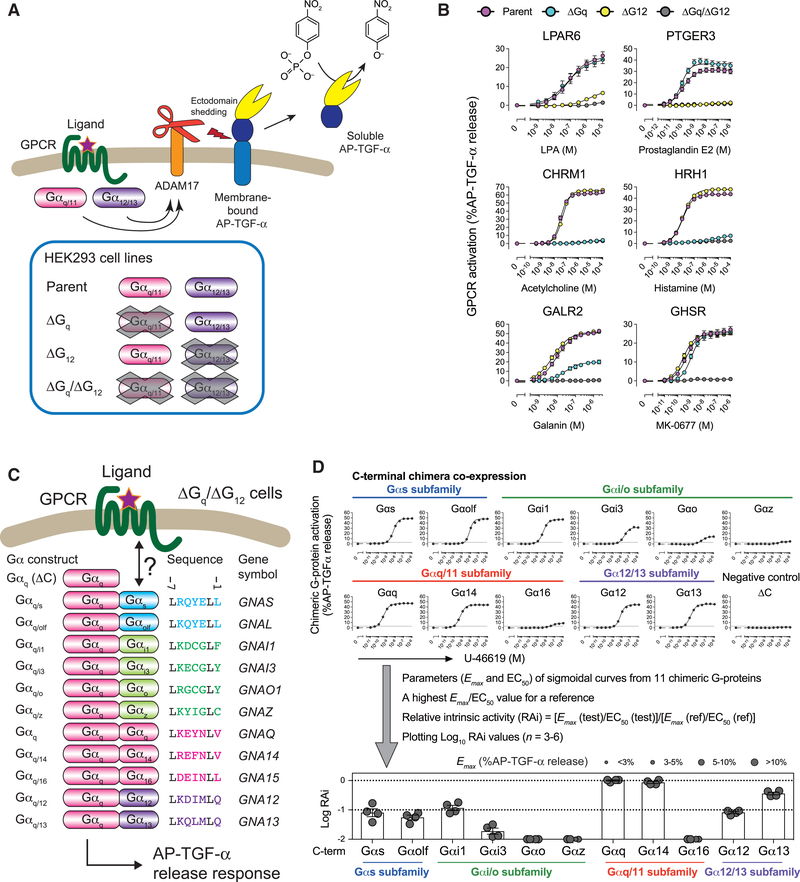
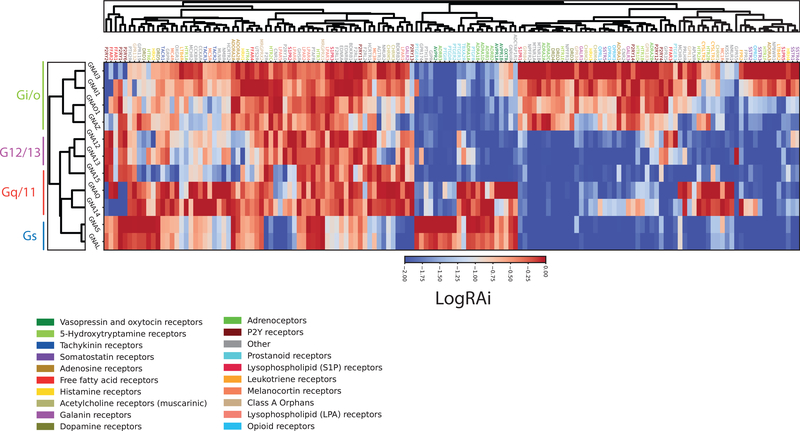
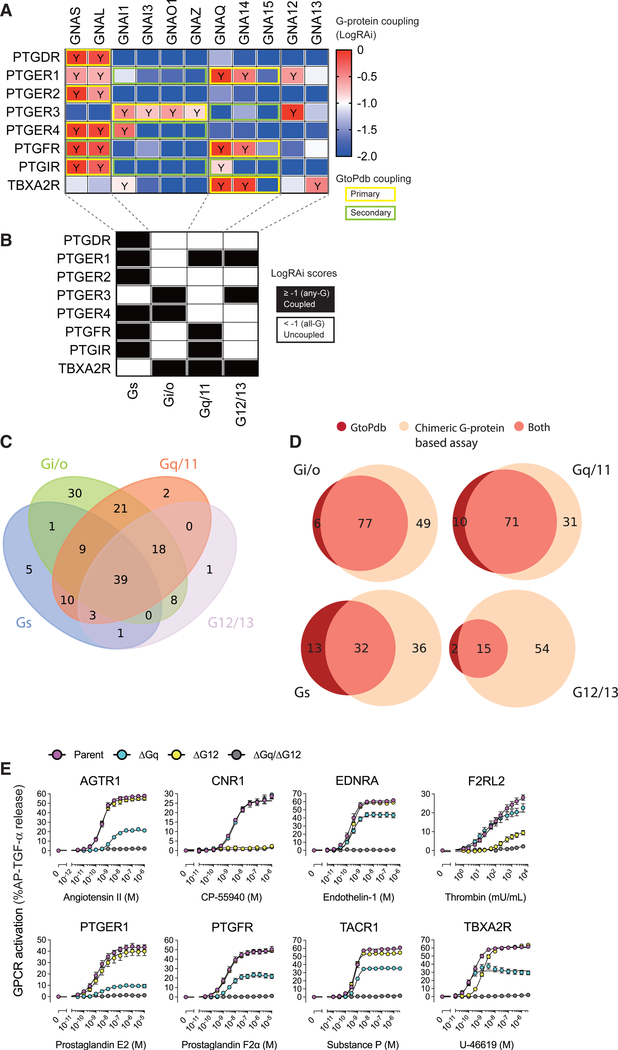
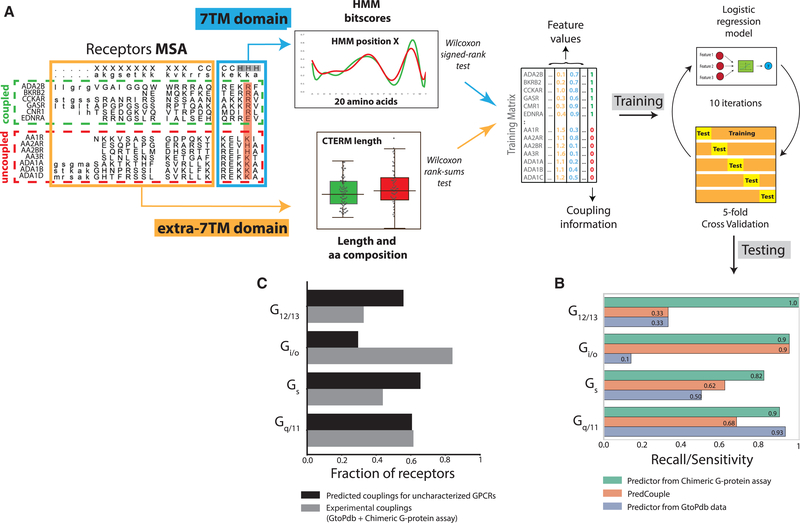
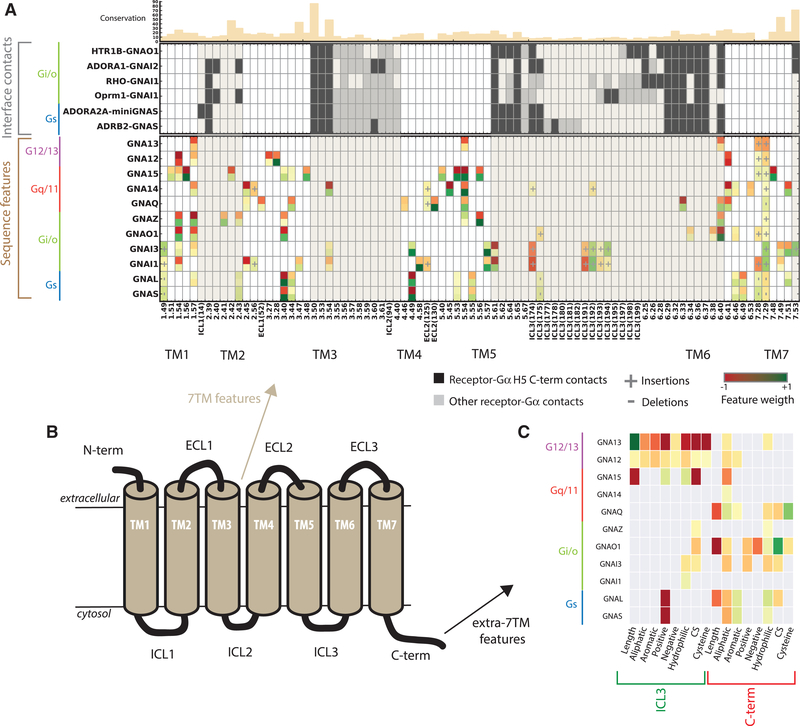
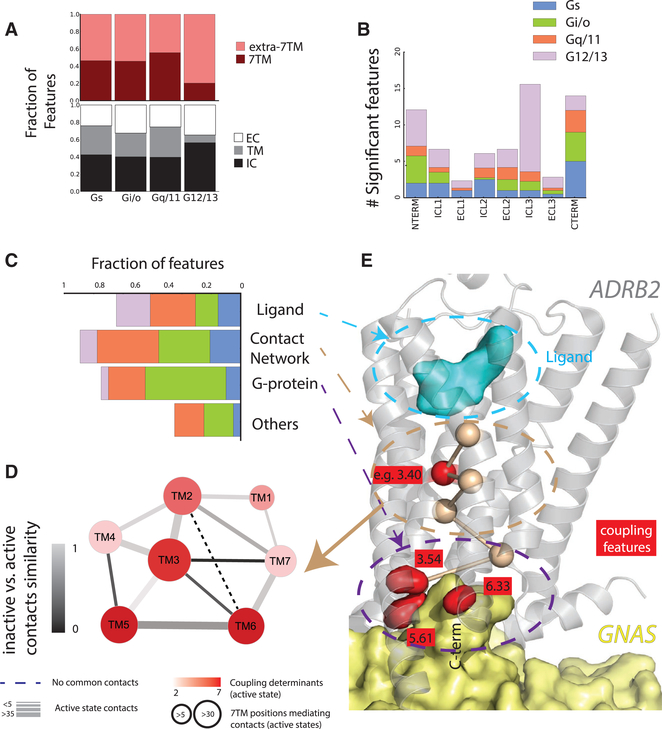
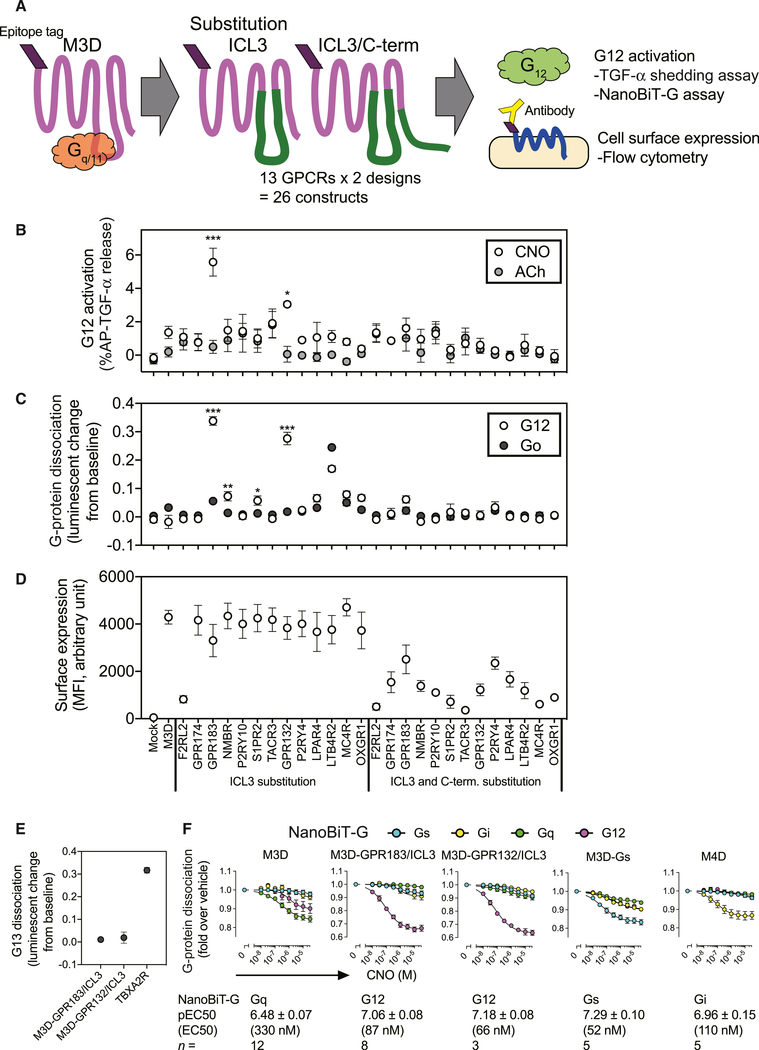
Heterotrimetic G proteins consist of four subfamilies (Gs, Gi/o, Gq/11, and G12/13) that mediate signaling via G-protein-coupled receptors (GPCRs), principally by receptors binding Gα C termini. G-protein-coupling profiles govern GPCR-induced cellular responses, yet receptor sequence selectivity determinants remain elusive. Here, we systematically quantified ligand-induced interactions between 148 GPCRs and all 11 unique Gα subunit C termini. For each receptor, we probed chimeric Gα subunit activation via a transforming growth factor-α (TGF-α) shedding response in HEK293 cells lacking endogenous Gq/11 and G12/13 proteins, and complemented G-protein-coupling profiles through a NanoBiT-G-protein dissociation assay. Interrogation of the dataset identified sequence-based coupling specificity features, inside and outside the transmembrane domain, which we used to develop a coupling predictor that outperforms previous methods. We used the predictor to engineer designer GPCRs selectively coupled to G12. This dataset of fine-tuned signaling mechanisms for diverse GPCRs is a valuable resource for research in GPCR signaling.

Keywords: DREADD; G-protein-coupled receptors; HEK293 cells; NanoBiT; TGF-α shedding assay; bioinformatics; chimeric G protein; prediction; protein design; signaling.


Figures

Figure 1.
Figure 1.. Chimeric G-Protein-Based TGF-α Shedding Assay to Probe Interaction between an Active GPCR and a C-Terminal Tail of a Gα Subunit
(A) Mechanism of the TGF-α shedding assay. Gq/11- and/or G12/13-coupled receptors induce activation of a membrane-bound metalloprotease ADAM17, which is endogenously expressed in HEK293 cells, and subsequent ectodomain shedding of the alkaline phosphatase-fused TGF-α (AP-TGF-α) reporter construct. AP-TGF-α release into conditioned media is quantified through a colorimetric reaction. Parental HEK293 cells and cells devoid of the Gαq/11 subunits (ΔGq), the Gα12/13 subunits (ΔG12), or the Gαq/11/12/13 subunits (ΔGq/ΔG12) were used in the TGF-α shedding assay. (B) Blunted TGF-α shedding response in the HEK293 cells devoid of the Gq/11 and the G12/13 subfamilies. GPCRs known to couple with G12/13 (LPAR6 and PTGER3), Gq/11 (CHRM1 and HRH1), and both (GALR2 and GHSR) were examined for ligand-induced TGF-α shedding responses in the parental HEK293 cells or the indicated G-protein-deficient cells. Symbols and error bars represent mean and SEM, respectively, of 3–6 independent experiments with each performed in triplicate. (C) Chimeric G-protein-based TGF-α shedding assay in ΔGq/ΔG12 cells. A test GPCR is expressed in ΔGq/ΔG12 cells together with one of 11 chimeric Gα subunits harboring C-terminal 6-amino acid substitution and restoration of ligand-induced AP-TGF-α release response is measured. Note that there are 11 unique C-terminal sequences for the 16 human Gα subunits (the C-terminal 6-amino acid sequences of Gαi1, Gαi2, Gαt1, Gαt2, and Gαt3 and those of Gαq and Gα11 are identical; also see Figures S2A–S2C) and that the invariant leucine is encoded at the −7 position. The C-terminally truncated Gαq construct (Gαq (ΔC)) is used fora negative control. (D) Representative data for the chimeric G-protein-based assay. TBXA2R was expressed with one of the 11 Gαq constructs or the Gαq (ΔC) and treated with titrated concentration of a ligand (U-46619). AP-TGF-α release responses were fitted to a sigmoidal concentration-response curve (upper panels). G-protein coupling is scored as logarithmic values of relative intrinsic activity (RAi), which is defined as a relative Emax/EC50 value normalized by the highest value. Symbol size is proportional to Emax, which reflects fitting quality. During data processing, a concentration-response curve that failed to converge or had an Emax value of less than 3% AP-TGF-α release, or a RAi value of less than 0.01 was defined as LogRAi value of −2. Data for the concentration-response curves are from a representative experiment (mean ± SD of triplicate measurements). Each LogRAi plot denotes a single experiment and bars and error bars represent mean and SEM, respectively (n = 4). See also Figures S1 and S2 and Data S1, S2, and S3.
Figure 2.
Figure 2.. Signatures of G-Protein Coupling Determined by the Chimeric G-Protein-Based Assay
Heatmap of the LogRAi values for the 148 receptors of the chimeric G-protein-based assay. Cell colors range from blue (LogRAi = −2) to red (LogRAi = 0). Receptors and G proteins are rearranged according to the dendrogram of the full linkage clustering of the distance matrix calculated from the coupling profiles. Receptor gene symbols are colored according to family membership as reported in GtoPdb. See also Figure S4 and Tables S1 and S2.
Figure 3.
Figure 3.. Comparison of G-Protein Coupling between the Chimeric G-Protein-Based Assay and GtoPdb, and Validation of G12/13 Signaling for the Newly Characterized GPCRs
(A) Classification of the LogRAi scores and its comparison with GtoPdb. An example heatmap of LogRAi scores for the eight prostanoid receptors is shown, with a LogRAi cutoff of −1 to binary-classify the data into coupled (red-to-white; Y) or uncoupled (blue-to-white) classes. G-protein coupling from GtoPdb (subfamily levels) is overlaid. (B) Combined binary coupling/non-coupling data for each of the four G-protein subfamilies. (C) Venn diagrams with the numbers of receptors coupled to each G-protein subfamily in the chimeric G-protein-based assay (LogRAi ≥ −1). (D) Venn diagrams of receptor couplings to the four G-protein families according to the chimeric G-protein-based assay (LogRAi ≥ −1)and GtoPdb. (E) GPCRs that were identified as being coupled with G12/13 by the chimeric G-protein-based assay were examined for their ability to engage and activate native, endogenous G12/13 in HEK293 cells. A test GPCR was expressed in the parental, ΔGq, ΔG12, and ΔGq/ΔG12 cells along with the AP-TGF-α reporter construct, but not with a chimeric Gα subunit, and its ligand-induced response was assessed. Note that, in all of the tested GPCRs, AP-TGF-α release response occurred in ΔGq cells but was completely silenced in ΔGq/ΔG12 cells, showing induction of G12/13 signaling. Symbols and error bars represent mean and SEM, respectively, of 3–6 independent experiments with each performed in triplicate. See also Figures S4 and S5 and Tables S1.
Figure 4.
Figure 4.. Development of G-Protein-Coupling Predictor
(A) Workflow of the procedure: features are extracted from sub-alignments of coupled and uncoupled receptors to a particular G protein; features are used to generate a training matrix, which is employed to train a logistic regression model through a 5-fold cross-validation procedure. (B) The final model is tested on reported couplings not previously seen during training and compared to PredCouple. (C) Highly confident predicted couplings (coupling probability >0.9) for 61 class A GPCRs lacking information about transduction from both GtoPdb or the chimeric G-protein-based TGF-α shedding assay (black) versus receptors with experimental coupling information (gray). See also Figure S7, Table S2, and Data S4.
Figure 5.
Figure 5.. Featured Residues in GPCRs Involved in G-Protein-Coupling Selectivity
(A) Comparison of significant coupling features weights for the 11 G proteins (bottom), interface contacts of 6 available GPCR-G-protein complexes (central) and 7TM domain position conservation (top). On the bottom panel are all the features (columns) that are found to be statistically significant (p < 0.05) for at least one coupling group (rows). Each cell is colored based on coefficient of the given feature in the decision function of the corresponding coupling group (i.e., weight), with negative and positive values colored red and green respectively. Coupling features at 7TM domain with significantly different amino acid distributions are characterized by two values, representing the weights of the bitscores obtained from the coupled (top sub-cell) and not coupled (bottom sub-cell) hidden Markov modes (HMMs) for each G protein. Insertions (i.e., positions present only in the coupled subset) or deletions (i.e., positions present only in the uncoupled subset) are indicated with a gray “+” and “−.” Black/gray boxes in the center show contacts mediated by the last 6 amino acids of C-terminal helix 5 of Gα subunits (black) and contacts mediated by the other positions of Gα subunits (gray). Top bars shows conservation profiles for PFAM 7tm_1 positions obtained by calculating the information content from HMM positions bit scores (Wheeler et al., 2014). (B) 2D cartoons of the 7TM topology indicating the regions contributing to the features. ICL, intracellular loop; ECL, extracellular loop; TM, transmembrane helix. (C) Significant coupling feature weights for the 11 G proteins (same color codes as in A) of extra-7TM features of ICL3 and C terminus, including length and amino-acid composition. See also Figures S4 and S7 and Table S3.
Figure 6.
Figure 6.. Functional Analysis of Residues Linked to Coupling Selectivity
(A) Upper panel: distribution of coupling feature fractions for extra- and intra-7TM portions. The formers comprise the 7TM helical bundle only, while the latters include the N and C termini, extra- and intra-cellular loops (ECLs and ICLs); lower panel: distribution of the coupling feature fractions within transmembrane sectors (i.e., EC, extracellular; TM, transmembrane; IC, intracellular). Extra- and intracellular portions are defined by ECL and ICL regions plus 5 helical positions preceding and following them (see Tables S3A and S3C). (B) Distribution of the fractions of coupling significant features outside of the 7TM bundle. (C) Distribution of coupling feature fractions (relative to the total number of positions of the same class) within functional sites (i.e., mediating either ligand/G-protein binding or intra-molecular contacts). (D) Graph representing intra-molecular contacts within 7TM helices. Each helix is represented by a node, whose diameter is proportional to the number of helix positions mediating contacts in the contact network derived from active-like structures and whose color (red scale) is proportional to the number of significant coupling features present in the corresponding region. Edges represent contacts between 7TM helices, where width is proportional to the number of contacts in the active-like contact network, while color scale (gray) is proportional to the similarity degree (calculated as a Jaccard index) between contacts mediated in the active- and inactive-like contact networks. (E) 3D cartoons of the ADRB2-GNAS complex (PDB: 3SN6) (Rasmussen et al., 2011) with side chains of coupling features at G-protein-binding sites depicted as red surfaces. Network drawings were done through Cytoscape (https://cytoscape.org/). A representative coupling feature at intra-molecular contacts sites (i.e., position 3.40) is depicted as a red sphere mediating one of the shortest paths linking the ligand and G-protein-binding pockets (wheat sticks and spheres). The ligand and GNAS (Gαs) are depicted as cyan and pale-yellow surfaces, respectively. 3D drawing was generated through pymol (https://pymol.org/). See also Figure S7 and Tables S2 and S3.
Figure 7.
Figure 7.. Generation of G12-Coupled Designer GPCRs
(A) Scheme of generating and assessing ICL3 or ICL3/C terminus-swapped constructs from Gq/11-coupled M3D. Based on the predictor scoring of 288 constructs from 144 GPCRs (Figure S7F), we selected 13 GPCRs and made 26 constructs. (B–D) Functional screening of M3D-derived chimeric constructs. G12 signaling of the constructs assessed by the TGF-α shedding assay in the ΔGq cells treated with 10 μM clozapine N-oxide (CNO) or10 μM acetylcholine (ACh) (B). Activation of G12 and Go was measured by the NanoBiT-G-protein dissociation assay with 10 μM CNO (C). Gα12-Lg or Gαo-Lg was co-expressed with Sm-Gγt1 (Data S3). Changes in decreased luminescent signals are inversely plotted in the y axis. (C). Surface expression of the M3D-derived chimeric constructs was assessed by a flow cytometry using an anti-FLAG epitope-antibody, followed by a fluorescently labeled secondary antibody (D). Symbols and error bars represent mean and SEM, respectively, of 4–8 independent experiments with each performed in duplicate or triplicate. *p < 0.05; **p < 0.01; ***p < 0.001 (two-way ANOVA, followed by Sidak’s multiple comparison tests). (E) Lack of G13 activation by the new DREADD constructs. Dissociation signals of the NanoBiT-G13 protein were assessed by using 10 μM CNO (M3D-GPR183/ICL3 and M3D-GPR132/ICL3) and 1 μM U-46619 (TBXA2R). Symbols and error bars represent mean and SEM, respectively, of 3–11 independent experiments with each performed in duplicate. (F) Concentration-response curves for G-protein activation by DREADD constructs. Previously established DREADDs (Gq/11-coupled M3D, Gi/o-coupled M4D, and Gs-coupled M3D-Gs) and the newly generated DREADDs (M3D-GPR183/ICL3 and M3D-GPR132/ICL3) were profiled for their G-protein coupling using representative members (Gs, Gi1, Gq, and G13) of the 4G-protein subfamilies. Symbols and error bars represent mean and SEM, respectively, of 3–12 independent experiments with each performed in duplicate. For each DREADD, parameters for the most efficaciously coupled G protein are shown in bottom of the panel. See also Figure S7.

Similar articles

Cited by

References

    1. Altschul SF, Gish W, Miller W, Myers EW, and Lipman DJ (1990). Basic local alignment search tool. J. Mol. Biol 215, 403–410. - PubMed
    1. Angelova K, Felline A, Lee M, Patel M, Puett D, and Fanelli F (2011). Conserved amino acids participate in the structure networks deputed to intramolecular communication in the lutropin receptor. Cell. Mol. Life Sci 68, 1227–1239. - PMC - PubMed
    1. Armbruster BN, Li X, Pausch MH, Herlitze S, and Roth BL (2007). Evolving the lock to fit the key to create a family of G protein-coupled receptors potently activated by an inert ligand. Proc. Natl. Acad. Sci. USA 104, 5163–5168. - PMC - PubMed
    1. Ataei F, Torkzadeh-Mahani M, and Hosseinkhani S (2013). A novel luminescent biosensor for rapid monitoring of IP3 by split-luciferase complementary assay. Biosens. Bioelectron 41, 642–648. - PubMed
    1. Capper MJ, and Wacker D (2018). How the ubiquitous GPCR receptor family selectively activates signalling pathways. Nature 558, 529–530. - PubMed

Publication types

Substances