. 2019 Jul 10;146(13):dev172387.
doi: 10.1242/dev.172387.

Tfap2a is a novel gatekeeper of nephron differentiation during kidney development

Affiliations

Tfap2a is a novel gatekeeper of nephron differentiation during kidney development

Brooke E Chambers et al. Development. .

Abstract

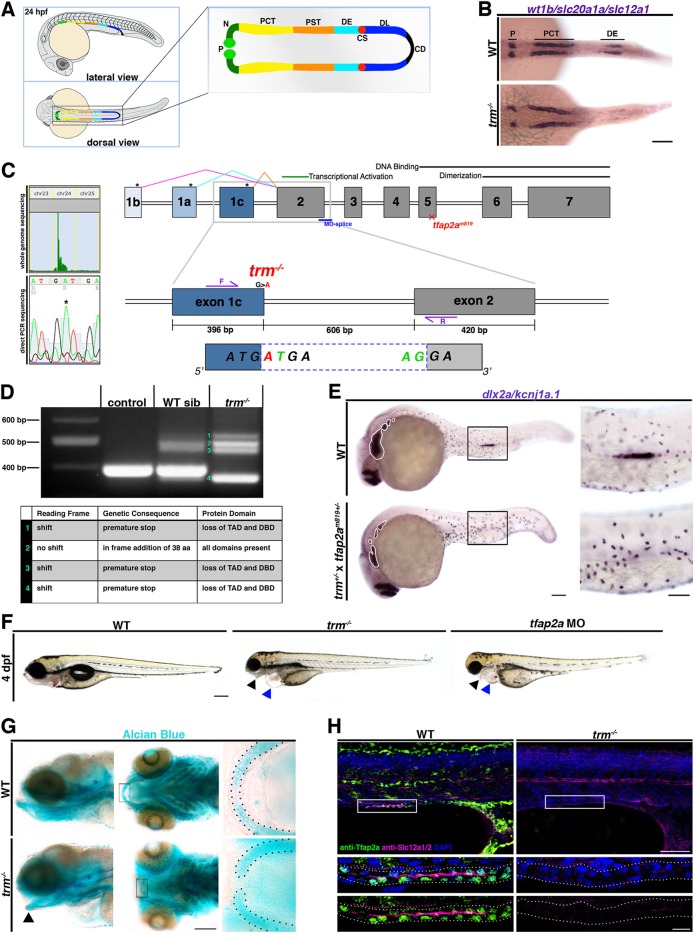
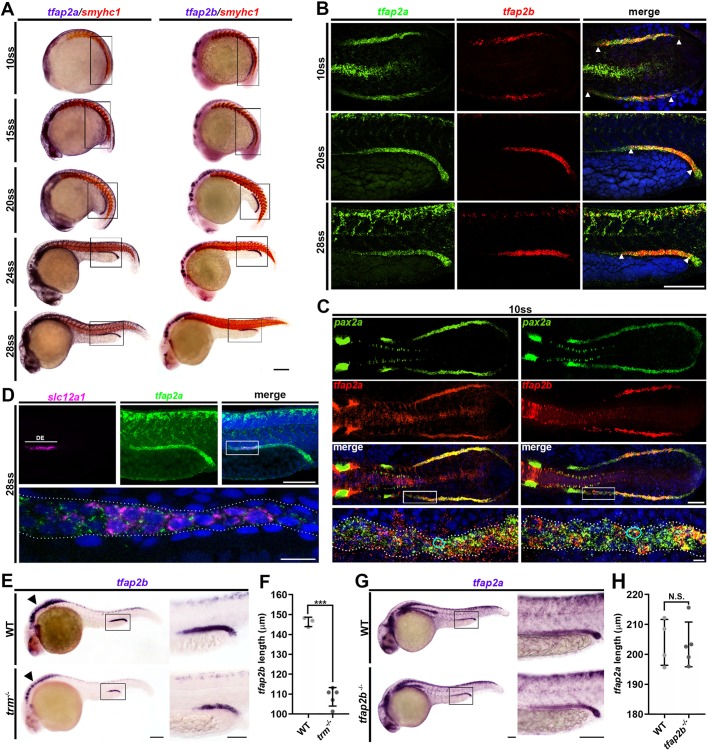
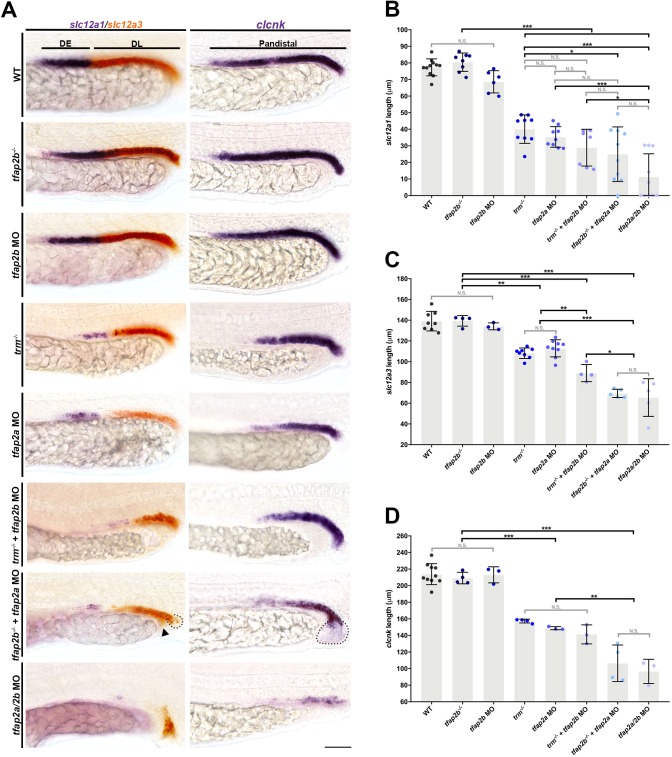
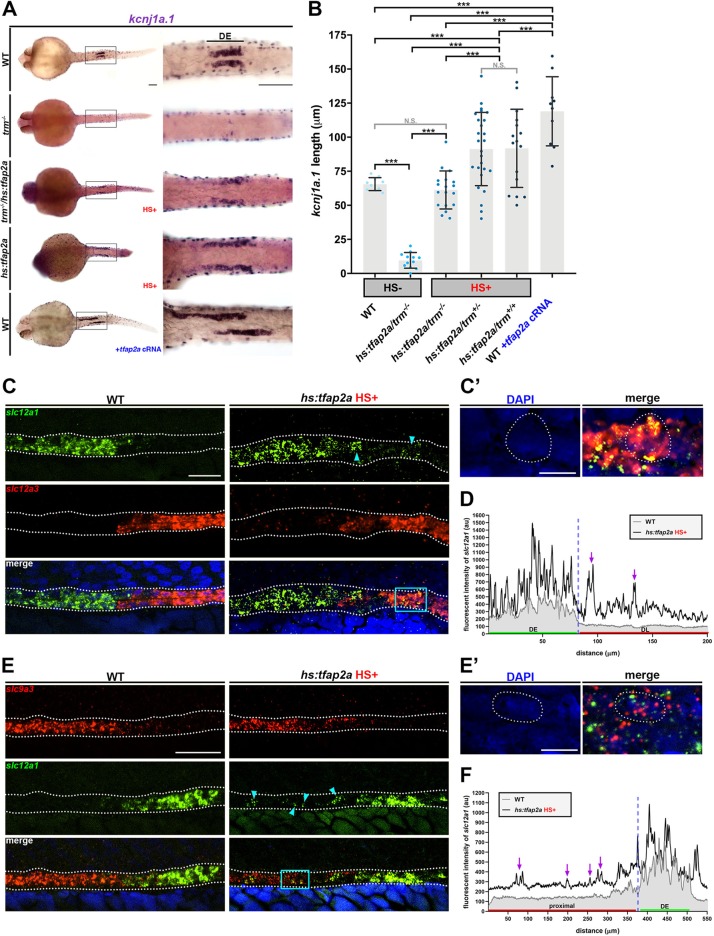
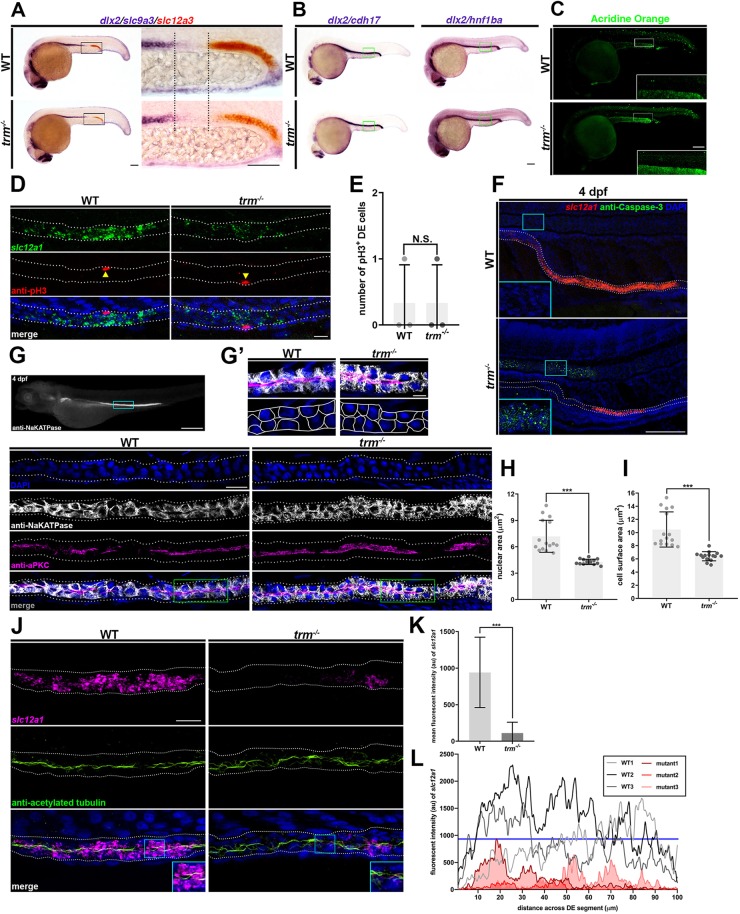
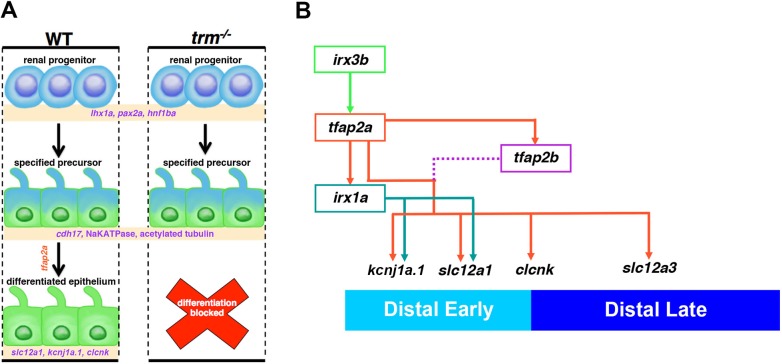
Renal functional units known as nephrons undergo patterning events during development that create a segmental array of cellular compartments with discrete physiological identities. Here, from a forward genetic screen using zebrafish, we report the discovery that transcription factor AP-2 alpha (tfap2a) coordinates a gene regulatory network that activates the terminal differentiation program of distal segments in the pronephros. We found that tfap2a acts downstream of Iroquois homeobox 3b (irx3b), a distal lineage transcription factor, to operate a circuit consisting of tfap2b, irx1a and genes encoding solute transporters that dictate the specialized metabolic functions of distal nephron segments. Interestingly, this regulatory node is distinct from other checkpoints of differentiation, such as polarity establishment and ciliogenesis. Thus, our studies reveal insights into the genetic control of differentiation, where tfap2a is essential for regulating a suite of segment transporter traits at the final tier of zebrafish pronephros ontogeny. These findings have relevance for understanding renal birth defects, as well as efforts to recapitulate nephrogenesis in vivo to facilitate drug discovery and regenerative therapies.

Keywords: Differentiation; Kidney; Nephron; Segmentation; Zebrafish; irx1a; irx3b; tfap2a; tfap2b.


Conflict of interest statement

Competing interestsThe authors declare no competing or financial interests.

Figures

Fig. 1.
Fig. 1.
Forward genetic screen reveals tfap2a is necessary for nephrogenesis in the developing zebrafish pronephros. (A) Zebrafish pronephros schematic. P, podocytes; N, neck; PCT, proximal convoluted tubule; PST, proximal straight tubule; DE, distal early; CS, corpuscle of Stannius; DL, distal late; CD, collecting duct. (B) Whole-mount in situ hybridization at 24 hpf. Scale bar: 70 µm. (C) SNPtrack from whole-genome sequencing at chromosome 24, with G>A tfap2a mutation in trm−/−. Exon diagram: tfap2a spliceoforms (pink, cyan and orange); black asterisks indicate alternative start sites; location of MO (blue) and tfap2am819 lesion (red); conserved nucleotides (green), mutant nucleotides (red) and primer locations (purple). (D) RT-PCR with mutant bands 1-4 (green) and table of predicted consequences from sequence analysis. TAD, transcriptional activation domain; DBD, DNA-binding domain. (E) Whole-mount in situ hybridization with pharyngeal arches (white outlines) and DE (black box) indicated. Scale bars: 70 µm (left) and 35 µm (right). (F) trm mutants exhibit abnormal craniofacial cartilage (black arrowheads) and pericardial edema (blue arrowheads). Scale bar: 200 µm. (G) Alcian Blue staining, with gaping jaw (black arrowhead); black dotted lines trace Meckel's cartilage. Scale bar: 100 µm. (H) Immunofluorescence of Tfap2a (green) and Slc12a1/2 (magenta). White dots show the pronephros border. Scale bars: 50 µm (top), 10 µm (bottom).
Fig. 2.
Fig. 2.
tfap2a and tfap2b are expressed in dynamic overlapping domains in developing nephrons, where tfap2a acts upstream of tfap2b. (A) Whole-mount in situ hybridization for tfap2a and tfap2b expression (purple), and smyhc1 expression (red). Black boxes indicate pronephros expression. Scale bar: 200 µm. (B) Fluorescent in situ hybridization for tfap2a (green) and tfap2b (red) in 10 ss (flat mount), 20 ss and 28 ss wild-type embryos (lateral views). White arrowheads indicate overlap. Scale bar: 70 µm. (C) Fluorescent in situ hybridization for pax2a (green), tfap2a (red) and tfap2b (red) in 10 ss wild-type embryos. White boxes outline the region shown in more detail in the bottom panel. Cyan circles indicate example cells co-expressing pax2a and tfap2a or tfap2b. White dots indicate the renal progenitor field border. Scale bars: 100 µm (top) and 10 µm (bottom). (D) Fluorescent in situ hybridization for slc12a1 (magenta) and tfap2a (green). White box indicates the area shown in more detail below. Scale bars: 70 µm (top) and 10 µm (bottom). (E) Whole-mount in situ hybridization for tfap2b. Arrowhead indicates hindbrain. Scale bars: 100 µm (left) and 70 µm (right). (F) Absolute length quantification of tfap2b. (G) Whole-mount in situ hybridization for tfap2a. Scale bars: 70 µm. (H) Absolute length quantification of tfap2a. n≥3. Measurements compared using unpaired t-tests. Data are mean±s.d. ***P<0.001; N.S., not significant.
Fig. 3.
Fig. 3.
tfap2a and tfap2b function redundantly to activate distal nephron solute transporter signature. (A) Whole-mount in situ hybridization for slc12a1 (DE, purple), slc12a3 (DL, red) and clcnk (pan-distal, purple) at 24 hpf. Black bars indicate wild-type marker domains. Black dots encircle cysts in the duct; black arrowhead indicates incomplete fusion of cloaca. Scale bar: 35 µm. (B-D) Absolute length quantifications of (B) slc12a1, (C) slc12a3 and (D) clcnk. n≥3. Measurements compared by ANOVA. Data are mean±s.d. *P<0.05; **P<0.01; ***P<0.001; N.S., not significant.
Fig. 4.
Fig. 4.
tfap2a is necessary and sufficient to drive the DE gene expression program. (A) Whole-mount in situ hybridization with the black bar indicating the kcnj1a.1 domain. Scale bars: 70 µm. (B) Absolute quantification of domain length per nephron. n≥10. Measurements compared by ANOVA. Data are mean±s.d. ***P<0.001; N.S., not significant. HS+, heat-shock; HS, no heat-shock. +tfap2a cRNA (blue) indicates RNA microinjection. (C) Fluorescent in situ hybridization for indicated markers. Scale bar: 20 µm. Cyan arrowheads identify ectopic slc12a1 in an adjacent segment. Cyan box indicates area shown in C′. (C′) DAPI (left) and merge (right). White dots outline a cell co-expressing slc12a1 and slc12a3. Scale bar: 5 µm. (D) Fluorescent intensity plot of slc12a1 expression in individuals from C. Blue dashed line demarcates wild-type segment boundary location. Purple arrows indicate ectopic slc12a1 in an adjacent segment and correlate with ectopic slc12a1 identified by cyan arrows in C. (E) Fluorescent in situ hybridization for indicated markers. Scale bar: 35 µm. Cyan arrowheads identify ectopic slc12a1 in an adjacent segment. Cyan box indicates the area shown in E′. (E′) DAPI (left) and merge (right). White dots outline cell co-expressing slc9a3 and slc12a1. Scale bar: 5 µm. DAPI (blue) labels nuclei. (F) Fluorescent intensity plot of slc12a1 expression in individuals from E. Blue dashed line represents the wild-type segment boundary. Purple arrows indicate ectopic slc12a1 in an adjacent segment and correlate with ectopic slc12a1 (cyan arrowheads) in E. White dotted lines throughout demarcate the pronephros; all embryos are at 24 hpf.
Fig. 5.
Fig. 5.
tfap2a is essential for the induction of terminal differentiation in the distal nephron. (A,B) Whole-mount in situ hybridization for indicated markers. Black dotted lines indicate the area with DE progenitors. Green boxes specify continuous expression of tubule markers in DE. Scale bars: 70 µm. (C) Acridine Orange staining. The white box indicates the optical zoom of a distal nephron. Scale bar: 70 µm. (D) Fluorescent in situ hybridization with immunofluorescence. Yellow arrowheads represent pH3+/slc12a1+ cells. White dots outline the pronephros. Scale bar: 10 µm. (E) Quantification of pH3+ DE cells. (F,G) Fluorescent in situ hybridization with immunofluorescence at 4 dpf. Cyan boxes indicate notochord in insets. Scale bar: 100 µm. (G) Cyan box indicates regions shown underneath. Gray dots border tubule. Green boxes indicate regions featured in G′. Scale bar: 10 µm. (G′) Optical zoom of regions highlighted in G. Bottom panels depict the strategy used to trace Na,K-ATPase expression to score cell morphology. Scale bar: 5 µm. (H) Quantification of nuclear area. (I) Quantification of cell surface area. (J) Fluorescent in situ hybridization with immunofluorescence. White dots line nephron limits. Cyan box indicates inset (optical zoom). Scale bar: 10 µm. (K) Quantification of mean fluorescent intensity (au) from three mutant and three wild-type samples across a 100 µm distance within the DE. (L) Fluorescent intensity plot of three wild-type individuals (grayscale) and three mutant individuals (red). Blue line indicates the threshold value (au) of wild-type slc12a1 transcripts. n≥3. ***P<0.001; N.S., not significant. Data are mean±s.d. Cell counts, area measurements and fluorescent intensity (au) analyzed using unpaired t-tests.
Fig. 6.
Fig. 6.
tfap2a interplays with the Iroquois homeobox genes irx3b and irx1a during nephrogenesis. (A) Fluorescent in situ hybridization for indicated markers. White box indicates the area shown in the panel below. Scale bars: 70 µm (top) and 10 µm (bottom). (B) Whole-mount in situ hybridization for indicated markers. Cyan dots indicate the irx3b expression domain. Black box indicates the presence of tfap2a transcripts; the red box indicates their absence. Red asterisks indicate disrupted tfap2a expression in neural crest streams. Scale bars: 70 µm. (C) tfap2a expression domain quantification (n≥3). Measurements compared by unpaired t-test. Data are mean±s.d. ***P<0.001. (D) Fluorescent in situ hybridization for indicated markers. Cyan box indicates the region shown in D′. Scale bar: 10 µm. (D′) Optical zoom to highlight the area of interest; DAPI (top); merge (bottom); dotted lines encircle dually expressing slc12a1+ irx1a+ cells. Scale bar: 5 µm. (E,F,H) Whole-mount in situ hybridization for indicated markers. Scale bars: 75 µm in E; 35 µm in F. (G,I) Domain length quantifications. (H) Insets show trace of kcnj1a.1+ (solid purple) for area quantifications in J. Scale bar: 75 µm. (J) kcnj1a.1 area quantification per nephron. Measurements compared using ANOVA. Data are mean±s.d. **P<0.01; ***P<0.001; N.S., not significant.
Fig. 7.
Fig. 7.
tfap2a and tfap2b function in a proposed genetic regulatory network to control distal nephron differentiation. (A) Schematic comparing DE progenitor maturation in wild-type embryos and trm mutants. Mutant cells display no perturbations in specification of the renal lineage. Mutant progenitors undergo segment specification and exhibit features of mature epithelium. In the final phase of differentiation, mutant cells fail to express DE-specific solute transporters. (B) Diagram depicts proposed tfap2a distal nephron gene regulatory network. irx3b promotes tfap2a expression (green), and tfap2a functions upstream of irx1a (orange). irx1a promotes expression of kcnj1a.1 and slc12a1 (teal). tfap2a acts upstream of tfap2b as the core regulator of solute transporter expression (orange). tfap2b functions redundantly (purple) to activate distal solute transporters.

References

    1. Airik R. and Kispert A. (2007). Down the tube of obstructive nephropathies: the importance of tissue interactions during ureter development. Kidney Int. 72, 1459-1467. 10.1038/sj.ki.5002589 - DOI - PubMed
    1. Alarcón P., Rodríguez-Seguel E., Fernández-González A., Rubio R. and Gómez-Skarmeta J. L. (2008). A dual requirement for Iroquois genes during Xenopus kidney development. Development 135, 3197-3207. 10.1242/dev.023697 - DOI - PubMed
    1. Barrallo-Gimeno A., Holzschuh J., Driever W. and Knapik E. W. (2003). Neural crest survival and differentiation in zebrafish depends on mont blanc/tfap2a gene function. Development 131, 1463-1477. 10.1242/dev.01033 - DOI - PubMed
    1. Bassett E. A., Korol A., Deschamps P. A., Buettner R., Wallace V. A., Williams T. and West-Mays J. A. (2012). Overlapping expression patterns and redundant roles for AP-2 transcription factors in the developing mammalian retina. Dev. Dyn. 241, 814-829. 10.1002/dvdy.23762 - DOI - PMC - PubMed
    1. Basta J. M., Robbins L., Denner D. R., Kolar G. R. and Rauchman M. A. (2017). Sall1-NuRD interaction regulates multipotent nephron progenitors and is required for loop of Henle formation. Development 144, 3080-3094. 10.1242/dev.148692 - DOI - PMC - PubMed

Publication types

MeSH terms

Substances