. 2019 Jun 3;10(1):2393.
doi: 10.1038/s41467-019-10150-y.

Structural basis for substrate gripping and translocation by the ClpB AAA+ disaggregase

Affiliations

Structural basis for substrate gripping and translocation by the ClpB AAA+ disaggregase

Alexandrea N Rizo et al. Nat Commun. .

Abstract

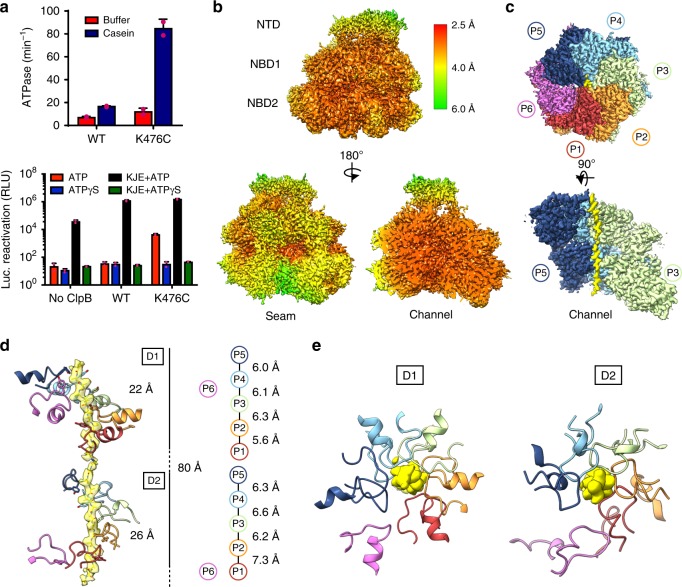
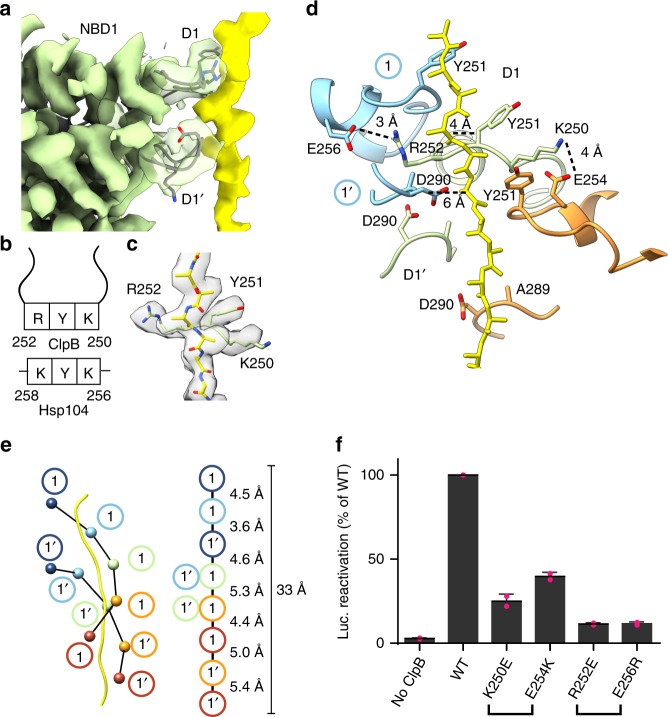
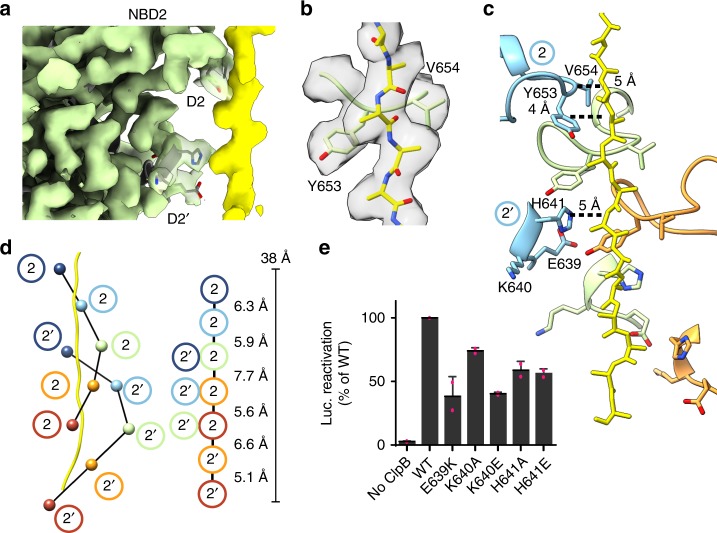
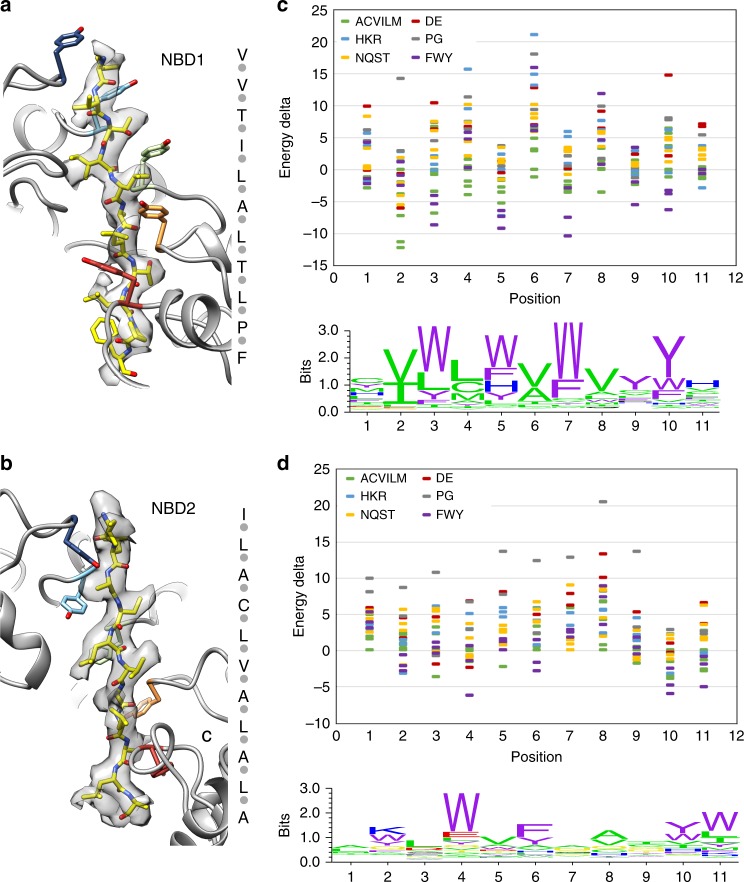
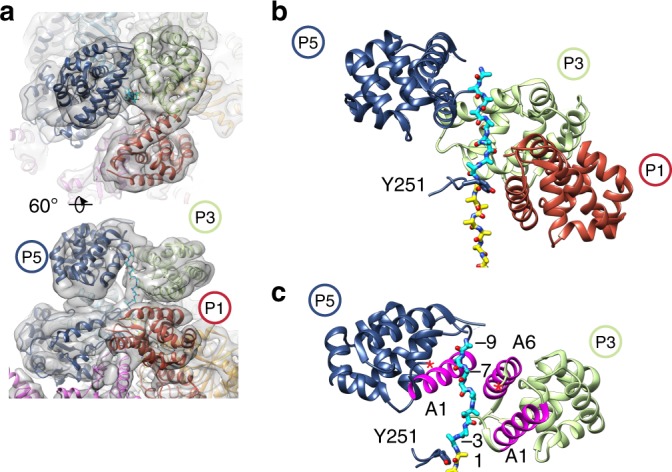
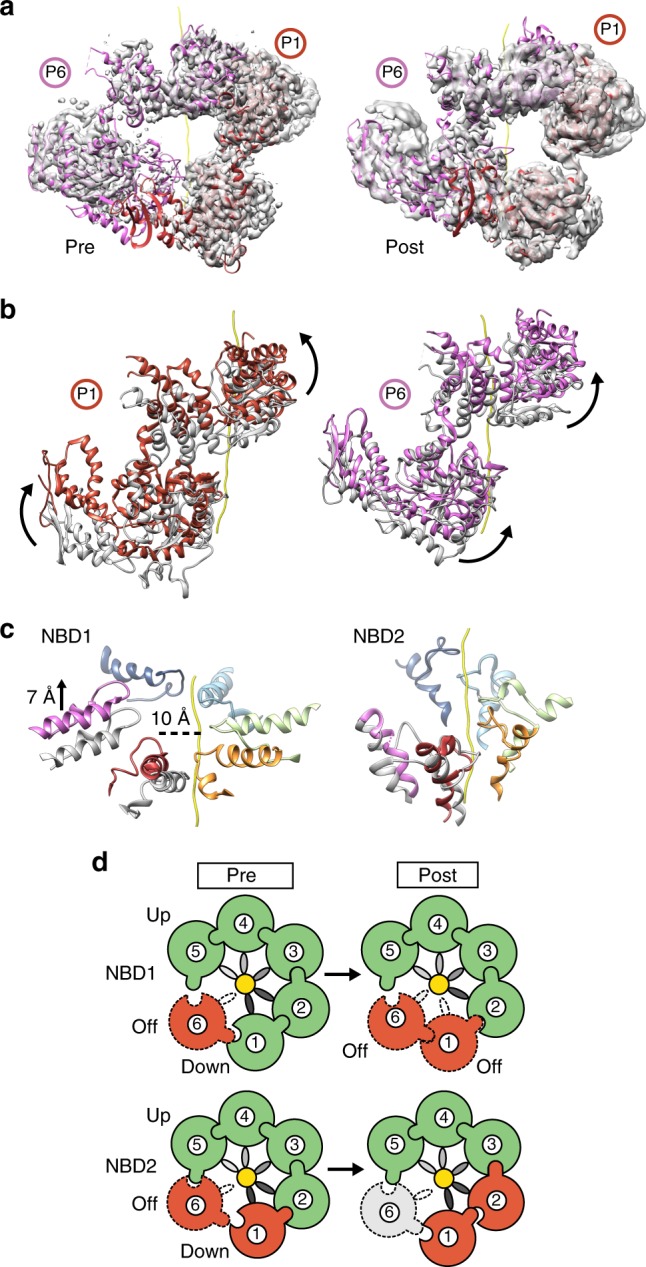
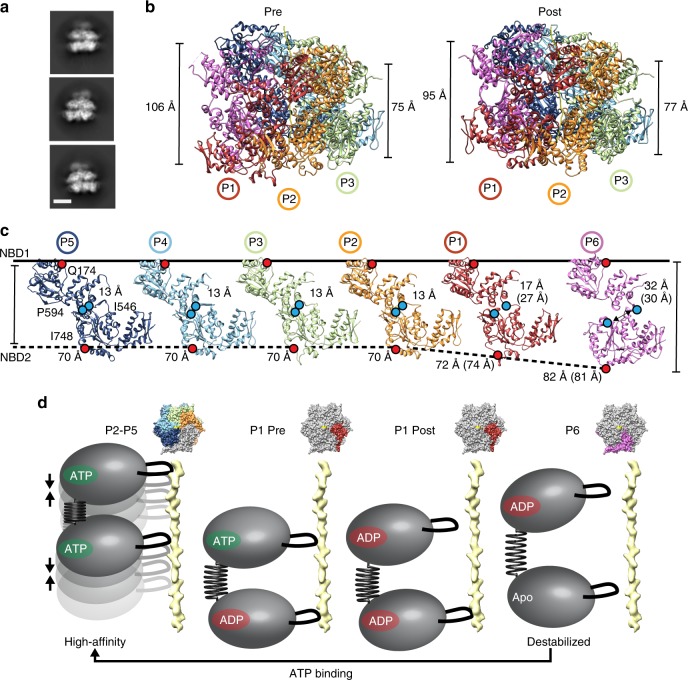
Bacterial ClpB and yeast Hsp104 are homologous Hsp100 protein disaggregases that serve critical functions in proteostasis by solubilizing protein aggregates. Two AAA+ nucleotide binding domains (NBDs) power polypeptide translocation through a central channel comprised of a hexameric spiral of protomers that contact substrate via conserved pore-loop interactions. Here we report cryo-EM structures of a hyperactive ClpB variant bound to the model substrate, casein in the presence of slowly hydrolysable ATPγS, which reveal the translocation mechanism. Distinct substrate-gripping interactions are identified for NBD1 and NBD2 pore loops. A trimer of N-terminal domains define a channel entrance that binds the polypeptide substrate adjacent to the topmost NBD1 contact. NBD conformations at the seam interface reveal how ATP hydrolysis-driven substrate disengagement and re-binding are precisely tuned to drive a directional, stepwise translocation cycle.


Conflict of interest statement

The authors declare no competing interests.

Figures

Fig. 1
Fig. 1
Activity and substrate-bound structure of the ClpBK476C hyperactive variant. a ClpBWT and ClpBK476C ATPase activity (upper panel) measured in the presence or absence of casein. Y-axis values are of phosphate release (min−1) and represent means ± SD. ClpBWT and ClpBK476C luciferase disaggregase activity (lower panel), plotted as relative luminescence, measured in the absence or presence of KJE with either ATP or ATPγS. Values represent means ± SD. For both plots, n = 2 and the data points are shown in magenta. EM density map of the ATPγS-ClpBK476C:casein complex b colored by resolution and c colored to show individual protomers (P1–P6) and substrate (yellow). d Side and e top-views of the NBD1 and NBD2 Tyr-containing pore loops (colored by protomer) with substrate EM density (yellow) modeled with a 26-residue poly-Ala. A schematic is shown with the distances (Å) between Tyr-substrate contacts along the NBD1 and NBD2 for protomers P1–P5; protomer P6 (magenta) is disconnected from the substrate
Fig. 2
Fig. 2
Substrate interactions by the NBD1. a Side view of the P3 NBD1 pore loop–substrate interactions with the D1 and D1′ loops indicated. b Schematic representation of the conserved D1 loop residues in ClpB and Hsp104. c Map and model of P3 D1 pore loop showing arrangement of K250, Y251, and R252 along the substrate density modeled with poly-Ala (yellow). d P2–P4 D1 and D1′ pore loops and modeled poly-Ala substrate with substrate interactions and proposed salt bridge interactions: E256-R252 and K250-E254 shown with approximate distances (dotted line). e Schematic of the double spiral of substrate interactions that is formed from the D1 and D1′ loops, with distances along the substrate axis shown based on the position of Y251 in the D1 and D290 in the D1′ pore loops (right). f Luciferase disaggregase activity was measured for WT, ClpBK250E, ClpBR252E, ClpBE254K, or ClpBE256R in the presence of KJE plus ATP. Values represent means ± SD (n = 2, data points shown in magenta)
Fig. 3
Fig. 3
Substrate interactions by the NBD2. a Side view of the P3 NBD2 pore loop-substrate interactions with the D2 and D2′ loops indicated. b Map and model of P3 D2 pore loop showing arrangement of Y653 and V654, along the substrate density modeled with poly-Ala (yellow). c The D2 and D2′ pore loops of P2–P4, colored by protomer, and substrate (yellow), with distances between interacting residues and substrate backbone shown. d Schematic of D2 and D2′ loops interacting along the substrate for protomers P1–P5 with distances along the substrate axis shown based on the position of Y653 and H641 for the D2 and D2′, respectively. e ClpB, ClpBE639K, ClpBK640A, ClpBK640E, ClpBH641A, or ClpBH641E luciferase disaggregase activity was measured in the presence of KJE plus ATP. Values represent means ± SD (n = 2)
Fig. 4
Fig. 4
Analysis of the substrate sequence stabilized by the NBD1 and NBD2. Molecular model and sequence of the energetically favored casein peptide sequence (yellow) in density for the NBD1 (a) and NBD2 (b). Interacting Tyr resides (Y251 and Y653) are colored by protomer. A plot showing per-energy deviations at each of the 11 positions interacting with NBD1 (c) and NBD2 (d); the logo plots convert these energies to a distribution, showing the sequence preferences at each position
Fig. 5
Fig. 5
3D focus classification reveals substrate interaction with NTDs. a Views of the NTD-focused refinement map after particle re-centering, colored by protomer, showing the P1–P3–P5 trimeric NTD ring. b Model of the P1–P3–P5 NTD trimer, and substrate polypeptide, modeled as poly-Ala (cyan), that extends from the P5 NBD1 pore loop (Y251). c Model of P5 and P3 NBDs interacting with substrate. Substrate-interacting helices A1 and A6 (magenta), previously characterized, are shown
Fig. 6
Fig. 6
Conformational changes and nucleotide states of the protomers at the seam interface. a Post-process masked cryo-EM map and molecular model of protomers P1 and P6 in the “Pre” and “Post” conformational states following particle re-centering and focused refinement of the seam interface. b Protomers P1 and P6 for both Pre (gray) and Post (colored) states with substrate (yellow), shown superimposed following alignment to protomer P3 in the hexamer. Conformational changes are shown as distinct rotations (arrows) of the NBD1 and NBD2. c The Pre- (gray) and Post-state (colored) NBD1 and NBD2 pore loops shown superimposed for protomers P1 and P6 with distances indicated following alignment of P3 pore loops in the hexamer for both states. d Schematic showing proposed NBD1 and NBD2 nucleotide states of the hexamer for the Pre and Post states, colored to indicate ATP (green), ADP (red), and APO (gray) state, based on analysis of the nucleotide pockets in the two structures (Supplementary Fig. 6e, f). Protomers that are disconnected from the substrate are indicated with a dash and Arg-finger contact is indicated by the interlocking contact between two protomers
Fig. 7
Fig. 7
Expansion between NBD1 and NBD2 at the seam interface. a 2D reference-free class averages of hexamer side views showing non-parallel arrangement of the NBD1 and NBD2 AAA+ rings. The scale bar equals 50 Å. b Side view of the Pre- and Post-state models showing the expansion of NBD1–NBD2 rings measured at the P1–P6 seam interface (left) compared to the P3–P4 interface across the hexamer (right). c The individual protomers from the Pre-state shown separated and aligned to the NBD1. Distance measurements are shown for residues Q174 and I748 (red dots) to depict overall protomer changes, and for residues I546 and P594 (blue dots) to show changes at the NBD1–NBD2 interface. Distances for the P1 and P6 protomers in the Post state are shown in parentheses. d Model depicting ATP hydrolysis at the seam interface coincides with conformational changes and an expanded NBD1–NBD2 arrangement. ATP re-binding promotes a more compact NBD1–NBD2 conformation that favors high-affinity substrate interactions and interprotomer contacts with the clockwise, ATP-state protomer, thereby advancing substrate contacts to the next highest position and maintaining the unfolded state of the polypeptide. Model based on NBD1–NBD2 measurements in c and the nucleotide states in Supplementary Fig. 6e, f

Similar articles

Cited by

References

    1. Sanchez Y, Lindquist SL. HSP104 required for induced thermotolerance. Science. 1990;248:1112–1115. doi: 10.1126/science.2188365. - DOI - PubMed
    1. Parsell DA, Kowal AS, Singer MA, Lindquist S. Protein disaggregation mediated by heat-shock protein Hsp104. Nature. 1994;372:475–478. doi: 10.1038/372475a0. - DOI - PubMed
    1. Weibezahn J, et al. Thermotolerance requires refolding of aggregated proteins by substrate translocation through the central pore of ClpB. Cell. 2004;119:653–665. doi: 10.1016/j.cell.2004.11.027. - DOI - PubMed
    1. Lum R, Tkach JM, Vierling E, Glover JR. Evidence for an unfolding/threading mechanism for protein disaggregation by Saccharomyces cerevisiae Hsp104. J. Biol. Chem. 2004;279:29139–29146. doi: 10.1074/jbc.M403777200. - DOI - PubMed
    1. Deville C, et al. Structural pathway of regulated substrate transfer and threading through an Hsp100 disaggregase. Sci. Adv. 2017;3:e1701726. doi: 10.1126/sciadv.1701726. - DOI - PMC - PubMed

Publication types

MeSH terms