. 2019 Jun 3;10(1):2423.
doi: 10.1038/s41467-019-10144-w.

Activated Peyer's patch B cells sample antigen directly from M cells in the subepithelial dome

Affiliations

Activated Peyer's patch B cells sample antigen directly from M cells in the subepithelial dome

Rathan Joy Komban et al. Nat Commun. .

Abstract

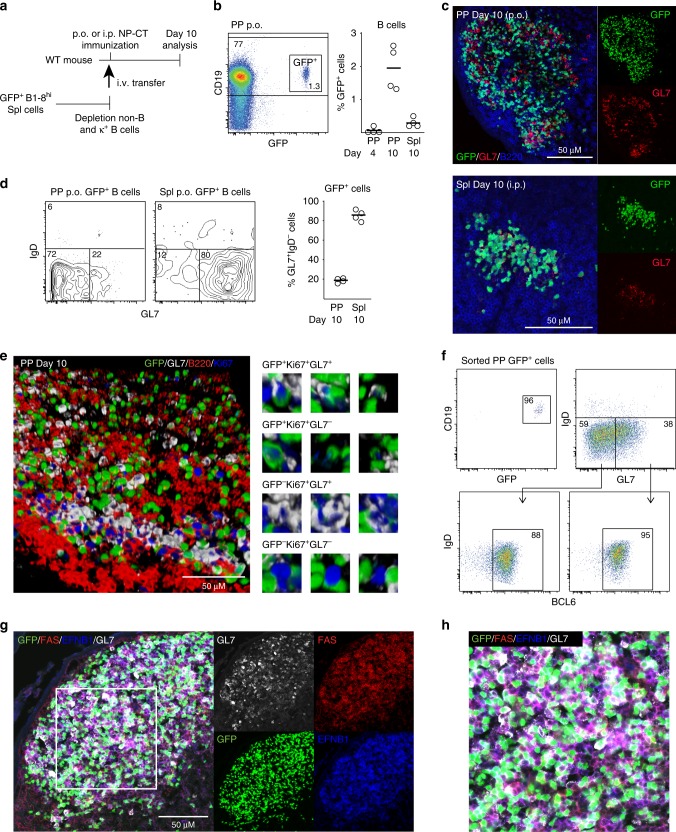
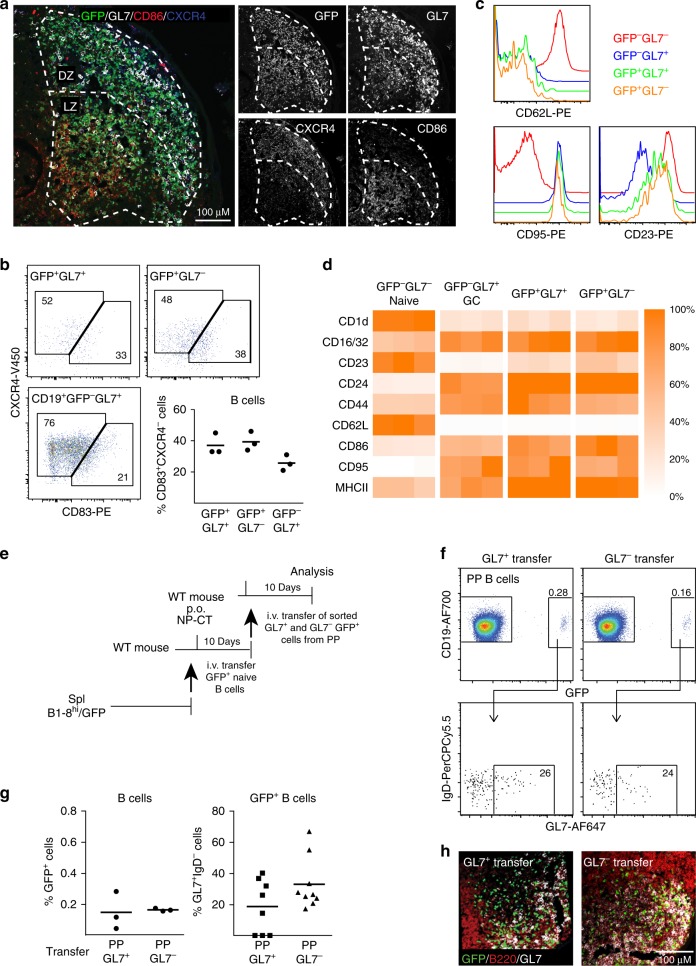
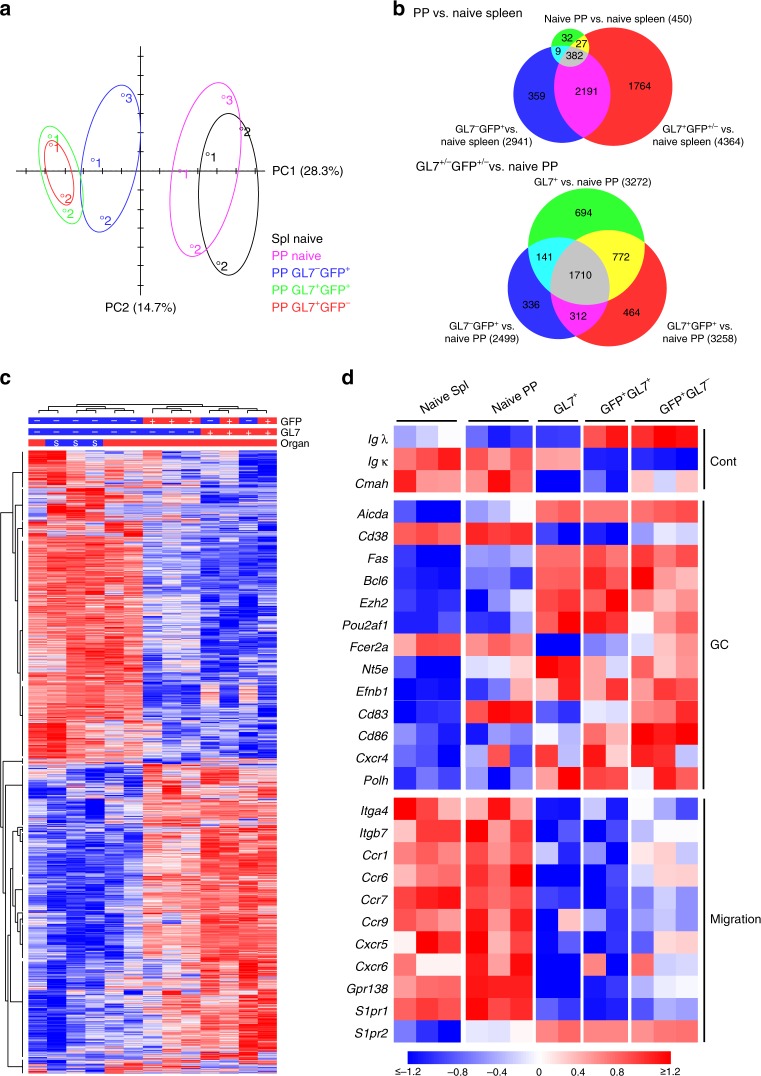
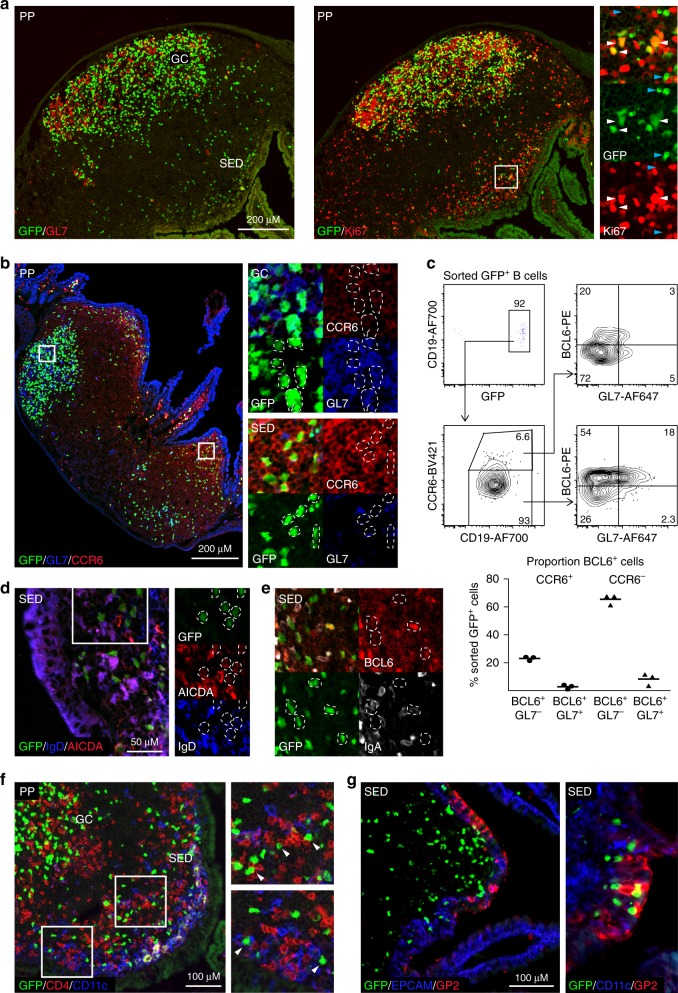
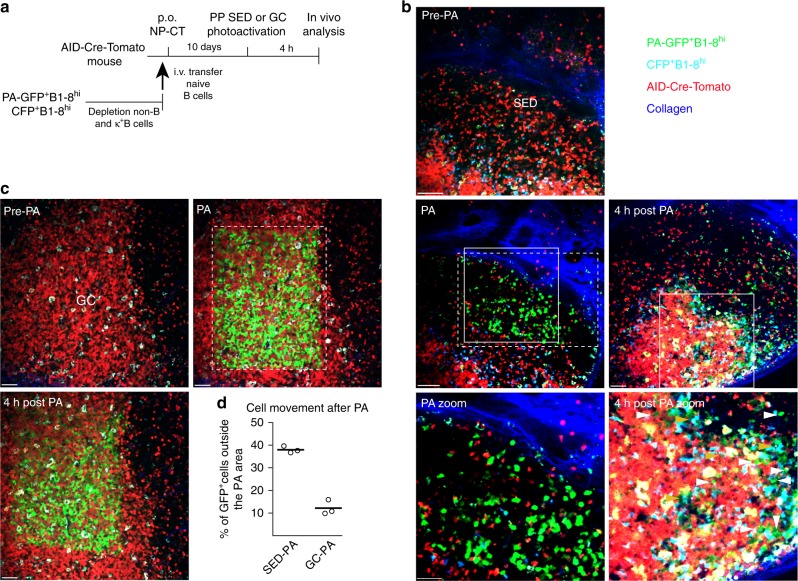
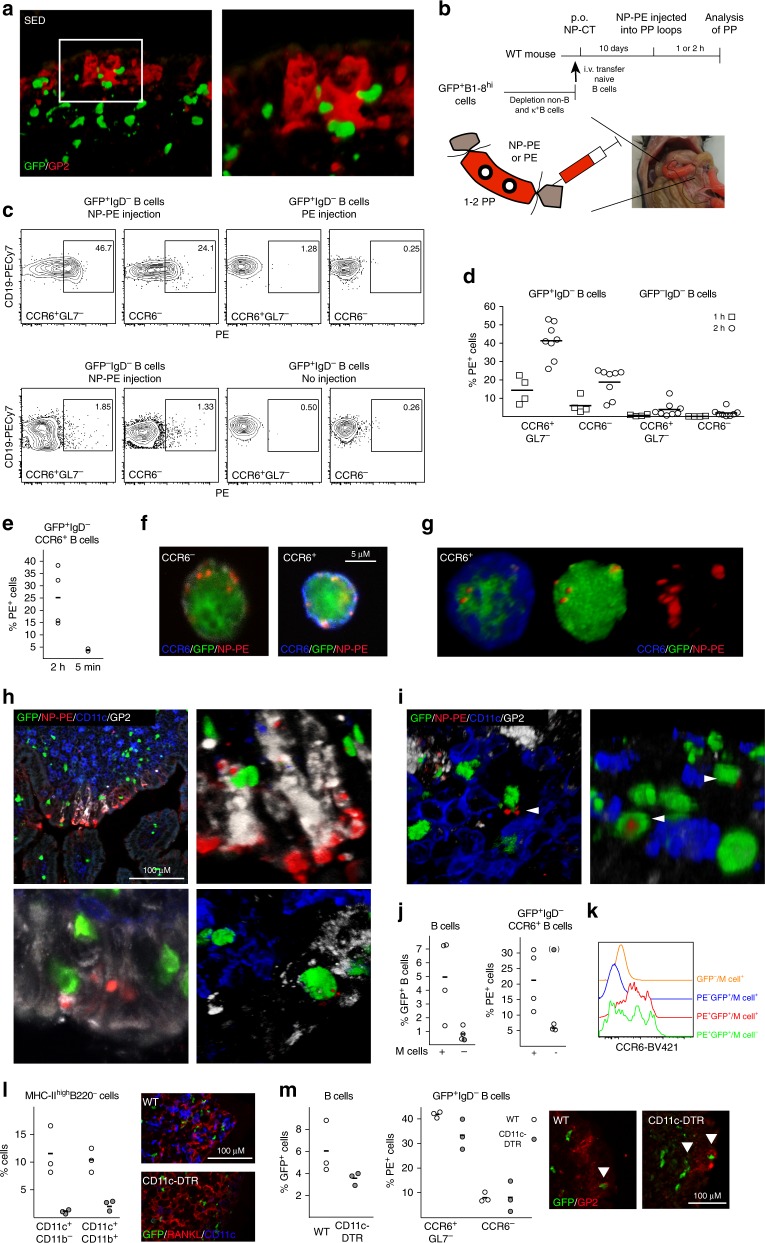
The germinal center (GC) reaction in Peyer's patches (PP) requires continuous access to antigens, but how this is achieved is not known. Here we show that activated antigen-specific CCR6+CCR1+GL7- B cells make close contact with M cells in the subepithelial dome (SED). Using in situ photoactivation analysis of antigen-specific SED B cells, we find migration of cells towards the GC. Following antigen injection into ligated intestinal loops containing PPs, 40% of antigen-specific SED B cells bind antigen within 2 h, whereas unspecifc cells do not, indicating B cell-receptor involvment. Antigen-loading is not observed in M cell-deficient mice, but is unperturbed in mice depleted of classical dendritic cells (DC). Thus, we report a M cell-B cell antigen-specific transporting pathway in PP that is independent of DC. We propose that this antigen transporting pathway has a critical role in gut IgA responses, and should be taken into account when developing mucosal vaccines.


Conflict of interest statement

The authors declare no competing interests.

Figures

Fig. 1
Fig. 1
A majority of Peyer′s patch (PP) germinal center (GC) B cells lack expression of GL7. a A schematic depiction of the experimental model used to study specific B cell responses in the PP and spleen following per oral (p.o.) or intraperitoneal (i.p.) immunization. b Gating strategy and percentage of NP-specific GFP+ B cells of all CD19+ B cells in PP on day four and ten or in the spleen (Spl) on day ten after a single NP-CT p.o. or i.p. immunization. c Representative microscopy images of PP and spleen tissue sections showing GL7+ (red) and GL7 GFP+ (green) B220+ (blue) B cells in PP GC following immunization. d Flow cytometry contour graphs and percentage  of GL7+ activated IgD GFP+ B cells in PP and in the spleen on day ten following p.o. and i.p. immunizations, respectively. e 3D confocal microscopy image of a GC in PP with GL7+ (white) or GL7 proliferating Ki67+ (blue) GFP+ (green) B cells co-labeled for B220+ (red). Close-ups of different labeling patterns of activated NP-specific GFP+ or non-specific endogenous GFP- B cells in the GC image to the right. f A representative intracellular flow cytometry analysis of sorted GFP+ B cells of pooled PPs from two mice on day ten following oral immunization with NP-CT to assess the frequency of BCL6-expressing activated IgD GL7+ or GL7 NP-specific B cells. g, h PP sections were labeled with FAS (red), EFNB1 (blue) and GL7 (white) to better show the demarcation of the GC reaction. Activated GFP+ B cells (green) are mostly within the GC borders while variably expressing GL7 (white). These are results from at least three independent experiments with 3–5 mice in each. Source data are provided as a Source Data file
Fig. 2
Fig. 2
Location and activation status of GL7+ and GL7 antigen-specific B cells in Peyer’s patch (PP) germinal centers (GC). a Representative microscopy image showing that NP-specific GFP+ B cells (green) localize both to the light, CD86+ (red), and dark, CXCR4+ (blue), zones of the GC (GL7+) in PPs following p.o. immunization with NP-CT. b Flow cytometry dot-plots demonstrating expression of light (CD83+) and dark (CXCR4+) zone phenotypic markers in GL7+ and GL7 GFP+ and endogenous GL7+ GFP B cells using the gating scheme in Supplementary Fig. 2a. c, d Flow cytometry histograms and heat maps depicting expression of surface markers on GL7+ or GL7 NP-specific GFP+ or endogenous GFP B cells in PP following a single p.o. immunization. c Representative flow data demonstrating the expression of CD62L, CD95 and CD23. d Heatmaps depicting the relative expression (MFI[sample]/MFI[maximum for any sample]) for the indicated markers in three mice. e Model used for adoptive transfer of sorted GL7+ or GL7 activated GFP+ B cells from PP to a “naïve” host that had been given NP-CT 24 h prior to cell transfer. f, g At 8–10 days following the transfer of sorted activated GFP+ B cells, the frequency of activated GFP+ B cells of all CD19+ B cells in PPs of the recipient mice and their distribution in GL7+ and GL7 cell populations were determined using flow cytometry. h A representative image demonstrating the GC location of sorted and transferred GL7+ or GL7 GFP+ (green) B cells in the PP of recipient mice. Sections were stained with B220 (red) and GL7 (white) antibodies to reveal the position of the GC. These are representative data from at least three independent experiments with 3–5 mice in each experiment giving similar results. Source data are provided as a Source Data file
Fig. 3
Fig. 3
RNASeq analysis of GL7+ and GL7 antigen-specific Peyer’s patch (PP) B cells. a GFP+ antigen-specific B cells were sorted into GL7+ or GL7 populations on day ten following an oral immunization with NP-CT and their gene expression profiles were analyzed using RNAseq. Concomitantly GL7 (naïve) and GL7+ B cells from PP and GL7 B cells from the spleen of unimmunized control mice were sorted for a comparative analysis of gene expression profiles. A principle component analysis of RNAseq data demonstrated global gene expression similarities between GL7+ and GL7 GFP+ B cells that were distinctly different from GFP naïve splenic or PP B cells, but similar to endogenous activated GFP GL7+ GC B cells. b Venn diagrams comparing gene expression changes between groups. In the upper panel, naïve GL7 (n = 3 samples), activated PP GFP+GL7 (n = 3) and activated GFP+/−GL7+ PP (n = 4) PP B cells were compared to GL7 naïve splenic B cells (n = 3), and in the lower panel activated PP GFP+GL7 (n = 3), GFP+GL7+ PP (n = 2) and GFPGL7+ PP (n = 2) were compared to naïve GL7 PP B cells (n = 3). Genes with a fold change > 1.5 and FDR adjusted p-value < 0.05 were counted, and the figures in each Venn field indicate the number of shared genes between groups. c Heat map of global gene expression in the PP B cell subpopulations compared to that of sorted naïve splenic B cells. d Heat map depicting the mRNA expression of selected genes in different B cell subpopulations, demonstrating differences between GL7+ and GL7 NP-specific GFP+ B cells with regard to gene expression signatures associated with migratory cues but similarities in expression of GC genes. Differences in gene expression are indicated the same in c and d with the scale at the bottom being applicable to both
Fig. 4
Fig. 4
Antigen-specific activated GL7 B cells are present in the Peyer’s patch (PP) sub-epithelial dome (SED) during an ongoing response. a, b Representative microscopy images showing activated and proliferating B cells in PP and SED. a The right panel and close-ups show GFP+ (green) proliferating (Ki67; red) and resting B cells that do not express GL7 in SED, with proliferating GL7+ (red; left panel) or GL7 B cells in the GC ten days after an oral immunization with NP-CT. b Activated GFP+ (green) B cells in SED are GL7 (blue) and express CCR6 (red), while GC GFP+ B cells do not express CCR6 regardless of GL7 expression. c A representative intracellular flow cytometry analysis of sorted GFP+ B cells from pooled PP from two mice on day ten following an oral immunization with NP-CT to quantitively assess BCL6 and GL7 expression on CCR6- (GC) and CCR6+ (SED) NP-specific B cells. A majority (>70%) of GFP+ CCR6 B cells in GC expressed BCL6 and of those one quarter also expressed GL7, whereas only around 20% of the CCR6+ SED B cells were BCL6+ of which essentially all lacked GL7. d, e Confocal microscopy images of the PP SED region following oral immunization with NP-CT showing expression of d AICDA (red) and IgD (blue) and e IgA (white) and BCL6 (red) in GFP+ (green) B cells. f Confocal microscopy demonstrating close contact between NP-specific GFP+ (green) B cells and CD4 T cells (red) and CD11c cells (blue) (white arrowheads in the close-ups) and g close interactions between NP-specific GFP+ B cells (green) and GP2+ (red) M cells in the EPCAM+ epithelial layer (blue) of the follicle associated epithelium of the PP. These are representative data from at least 3 independent experiments with each experiment giving similar results. Source data are provided as a Source Data file
Fig. 5
Fig. 5
Migration of activated NP-specific B cells from the SED to GC regions of the Peyer’s patch following oral immunization. a Schematic representation of the model used to detect movements of B cells in the PP by photoactivation. B1–8hi B cells expressing PA-GFP or CFP were adoptively transferred into AIDCre/+ Rosa26fl-stop-fltdTomato mice that were subsequently orally immunized with NP-CT. At 10 days after transfer, PPs were exposed and SED or GC areas were photoactivated based on CFP and tdTomato expression and the position of the photoactivated cells was subsequently analyzed 4 h later. b Photoactivation was guided to the SED region based on the presence of CFP+ cells. Four hours after activation approximately 40% of the GFP+ B cells had left the photo-converted area in SED. These were often found close to or within the GC at this point (marked with white arrowheads). In addition, macrophages were evident by auto-fluorescence (marked with orange arrowheads; also see Supplementary Fig. 5a). c The GC was detected based on the large density of tdTomato+ cells in the area. Four hours after photoactivation most of the PA-GFP+ B cells remained within the GC area. d The percentage of B cells that had migrated from the photoactivated area within 4 h. The analysis represents one experiment performed on three distinct PP. Photoactivated areas are marked with dashed line rectangles and close up areas with normal line quadrants. Similar results were obtained in 3 independent experiments. Scale bar = 80 µm. Source data are provided as a Source Data file
Fig. 6
Fig. 6
Peyer’s patch M cells provide antigen-specific B cells with luminal antigen for transport towards the germinal center area. a A 3D confocal microscopy image of GFP+ B cells (green) in contact with GP2+ M cells after oral immunization with NP-CT. b Schematic representation of a ligated loop model used to study antigen up-take from the lumen. c Flow cytometry contour plots analyzing antigen-specific binding of NP-PE to GFP+ and endogenous GFP B cells. The left panels show NP-PE binding to antigen-specific (top) or endogenous (bottom) B cells 2 h after NP-PE injection, and the right control experiments with loops injected with unconjugated PE or PBS. d, e The graphs show the binding of NP-PE to SED (CCR6+GL7), non-SED (CCR6) GFP+ or endogenous GFP- B cells 5 min, 1 or 2 h after injection. f, g Sorted CCR6+ (blue) and CCR6- PE+ B cells were fixed and spread on microscope slides to determine the cellular distribution of NP-PE (red). h Representative confocal microscopy images show antigen accumulation (NP-PE; red) on M cells (GP2+; white) 1 h after NP-PE inoculation with GFP+ B cells (green) accessing antigen in and/or below M cells. i Antigen-specific B cells (GFP+; green) carrying antigen (NP-PE; red) while not contacting M cells (GP2+; white) or DC (CD11c+; blue). j The proportion GFP+ B cells in PP following oral immunization and the frequency of NP-PE binding SED B cells two hours after NP-PE injection into ligated loops of M cell deficient RANK-FL/Villin-Cre+ or control mice are shown. Averages were computed without an outlayer (gray) based on less than 30 GFP+ events. k A histogram depicting CCR6 expression in NP-PE+ and control B cells from M cell deficient or control mice. l DC were depleted from CD11c-DTR transgenic mice 24 h after a DT injection, with no CD11c-expressing cells in the RANKL-expressing (red) SED. m The left diagram show the proportion GFP+ B cells after DT-mediated DC depletion 24 h before loop experiments  and in control mice, the middle graph the frequency of NP-PE binding B cells in ligated loops, and the microscopy photo to the right interactions between antigen-specific B cells (green) and M cells (GP2+; red). Source data are provided as a Source Data file

References

    1. Reboldi A, et al. IgA production requires B cell interaction with subepithelial dendritic cells in Peyer’s patches. Science. 2016;352:aaf4822. doi: 10.1126/science.aaf4822. - DOI - PMC - PubMed
    1. Lycke NY, Bemark M. The regulation of gut mucosal IgA B-cell responses: recent developments. Mucosal Immunol. 2017;10:1361–1374. doi: 10.1038/mi.2017.62. - DOI - PubMed
    1. Reboldi A, Cyster JG. Peyer’s patches: organizing B-cell responses at the intestinal frontier. Immunol. Rev. 2016;271:230–245. doi: 10.1111/imr.12400. - DOI - PMC - PubMed
    1. Fagarasan S, Kawamoto S, Kanagawa O, Suzuki K. Adaptive immune regulation in the gut: T cell-dependent and T cell-independent IgA synthesis. Annu. Rev. Immunol. 2010;28:243–273. doi: 10.1146/annurev-immunol-030409-101314. - DOI - PubMed
    1. Neutra MR, Pringault E, Kraehenbuhl JP. Antigen sampling across epithelial barriers and induction of mucosal immune responses. Annu. Rev. Immunol. 1996;14:275–300. doi: 10.1146/annurev.immunol.14.1.275. - DOI - PubMed

Publication types