. 2019 Jun 3;10(1):2395.
doi: 10.1038/s41467-019-10291-0.

A comprehensive single cell transcriptional landscape of human hematopoietic progenitors

Affiliations

A comprehensive single cell transcriptional landscape of human hematopoietic progenitors

Danilo Pellin et al. Nat Commun. .

Abstract

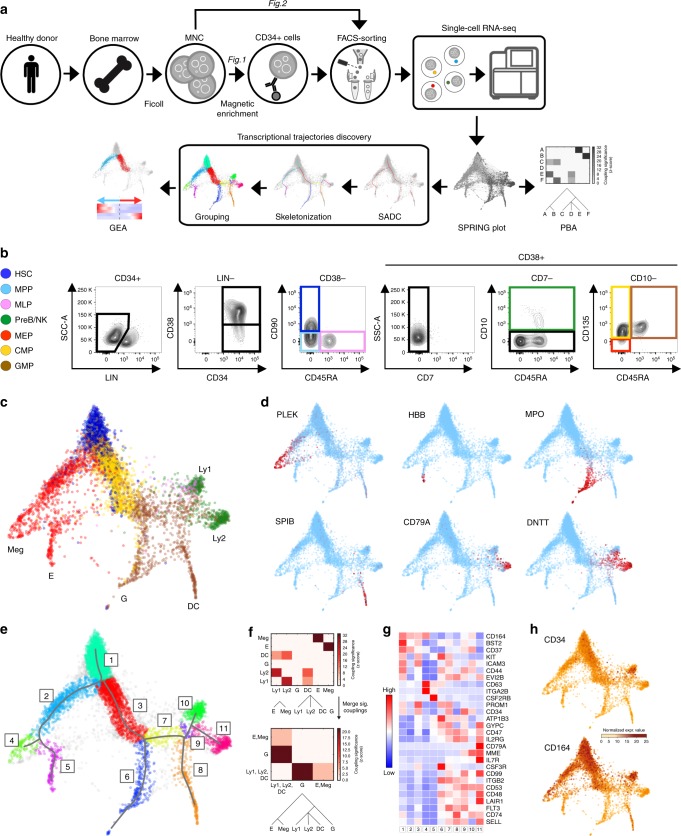
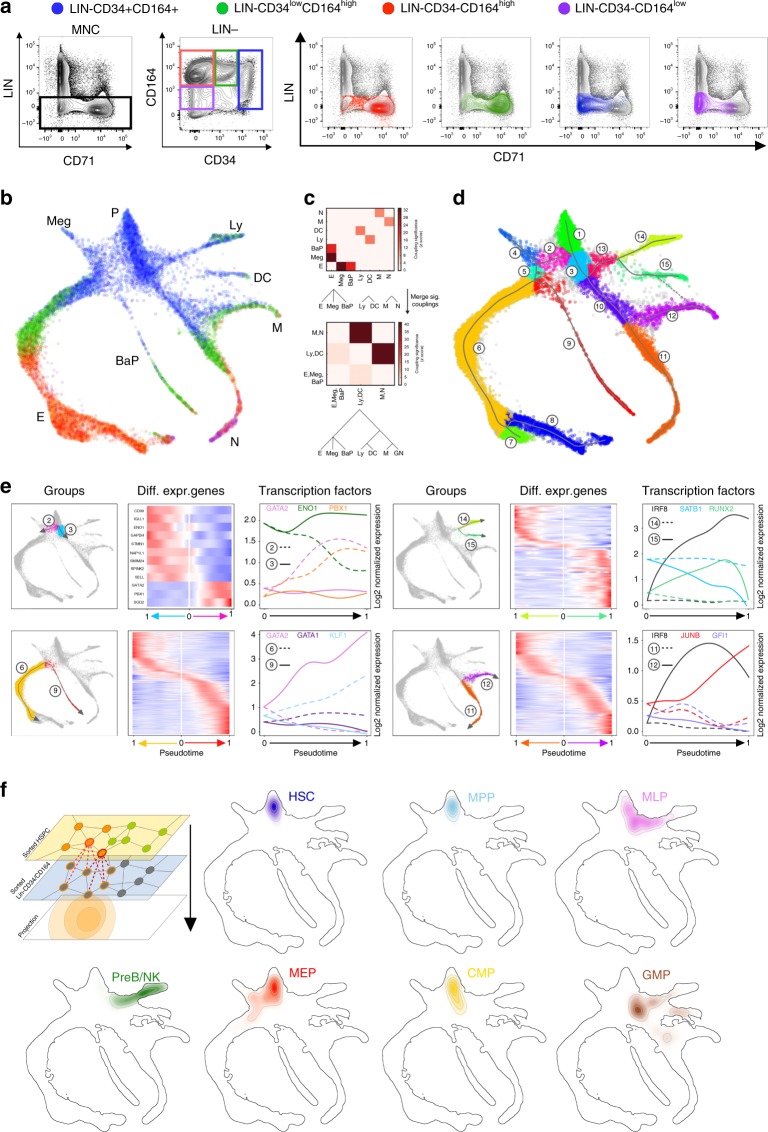
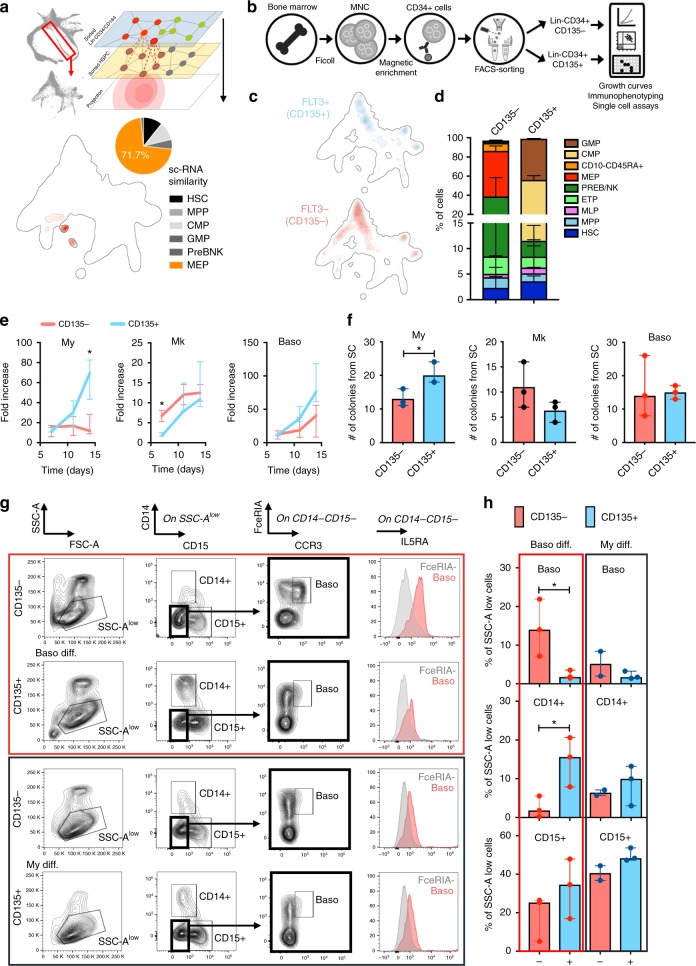
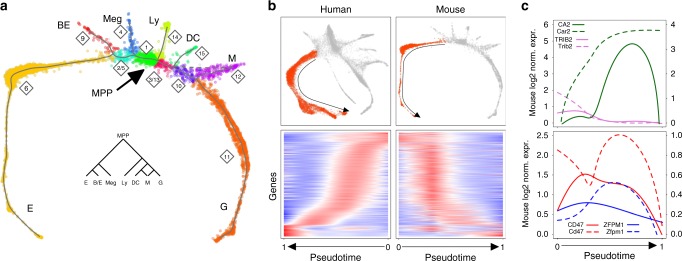
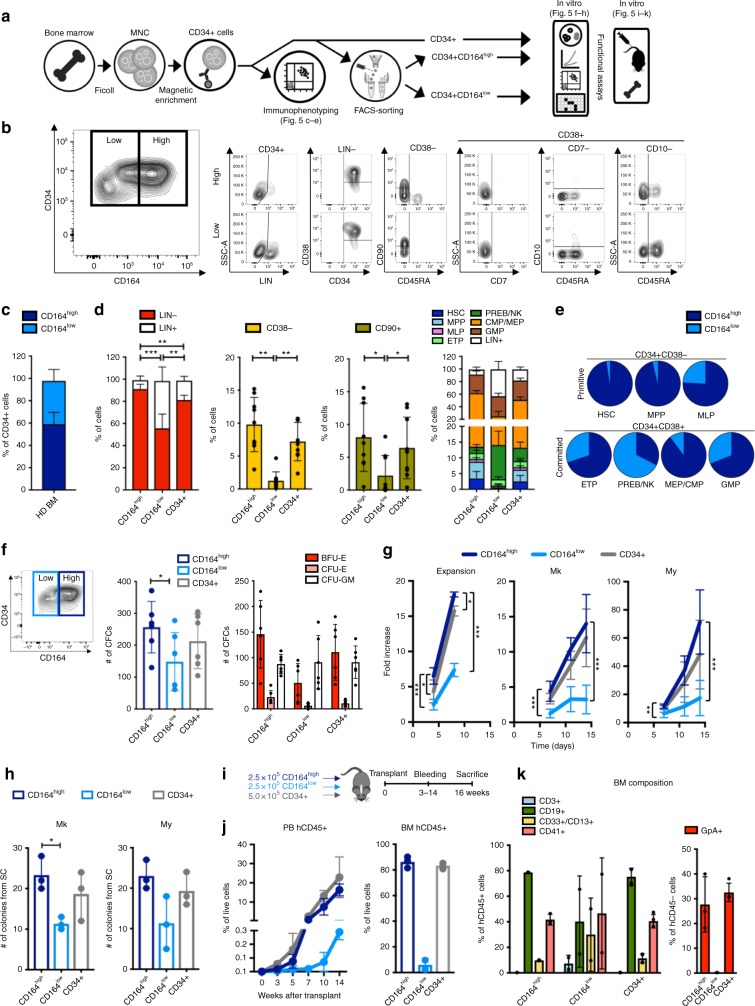
Hematopoietic Stem/Progenitor cells (HSPCs) are endowed with the role of maintaining a diverse pool of blood cells throughout the human life. Despite recent efforts, the nature of the early cell fate decisions remains contentious. Using single-cell RNA-Seq, we show that existing approaches to stratify bone marrow CD34+ cells reveal a hierarchically-structured transcriptional landscape of hematopoietic differentiation. Still, this landscape misses important early fate decisions. We here provide a broader transcriptional profiling of bone marrow lineage negative hematopoietic progenitors that recovers a key missing branchpoint into basophils and expands our understanding of the underlying structure of early adult human haematopoiesis. We also show that this map has strong similarities in topology and gene expression to that found in mouse. Finally, we identify the sialomucin CD164, as a reliable marker for the earliest branches of HSPCs specification and we showed how its use can foster the design of alternative transplantation cell products.


Conflict of interest statement

The authors declare no competing interests.

Figures

Fig. 1
Fig. 1
Experimental workflow and transcriptional map for human HSPCs. a Schematic for experimental design and workflow of data analysis. Two experiments have been performed on two separate healthy donors to generate two single-cell transcriptome maps (MNC, mononuclear cells; PBA, population balance analysis; GEA, Gene expression analysis). b Gating strategy used for the FACS sorting of seven HSPC subsets from magnetic beads purified CD34+ cells of a healthy donor BM (HSC, hematopoietic stem cells; MPP, multipotent progenitors; MLP, multi-lymphoid progenitors; Pre-B/NK, Pre-B lymphocytes/natural killer cells; MEP, megakaryocyte-erythroid progenitors; CMP, common myeloid progenitors; GMP, granulocyte–monocyte progenitors). c SPRING plot of the seven HSPCs single-cell transcriptomes. Each point is one cell. Labels at the edges represent the transcriptional states associated to early lineage commitment (Meg, megakaryocytes; E, erythroid cells; G, granulocytes; DC, dendritic cells; Ly1/Ly2, lymphoid B, T, NK cells). Color legend as in b. d Representative gene expression maps of lineage defining genes (PLEK, Meg; HBB, E; MPO, G; SPIB, DC; CD79A, and DNTT, Ly1/2). e Classification of individual cells into homogenous transcriptional groups numbered from 1 to 11, based on inferred principal trajectories (Supplementary Fig. 3a for details). f Predicted hierarchy based on two steps PBA. g Heatmap showing the expression average in groups shown in e for statistically significant genes coding for CD markers (likelihood ratio test [LRT] adjusted p value < 0.05). h Gene expression maps of CD34 and CD164
Fig. 2
Fig. 2
Human Lin− compartment investigation by means of CD34/CD164 fractionating. a Gating strategy for the FACS sorting of four subsets inside the Lin—fraction of a healthy donor BM, according to CD34 and CD164 expression (left panels). Relative contribution of CD71+ progenitors is shown in the right panels. b SPRING plot of the four Lin−CD34/CD164 subsets single-cell transcriptomes. Each point is one cell. Labels at the edges represent the transcriptional states associated to early lineage commitment (P, early progenitor cells; Meg, megakaryocytes; E, erythroid cells; BaP, basophil progenitors; N, neutrophils; M, monocytes; DC, dendritic cells; Ly-T/B/NK, lymphoid T/B/NK cells). Color legend as in a. Gene expression maps are available in Supplementary Fig. 4. c Predicted hierarchy based on two steps PBA. d Classification of individual cells into homogenous transcriptional groups numbered from 1 to 15, based on inferred principal trajectories. Solid lines show results based on final converged iteration (Supplementary Fig. 3b for details). Dashed lines added manually to highlight a potential additional trajectory not present in final iteration and inferred by visual inspection (DC-M). e Gene dynamics associated to branching and fate decisions. Plots on the left, branching and groups; mirror heatmaps, expression of statistically significant genes differentially expressed along each branch pseudotime (LRT adjusted p value < 0.05). Plots on the right, a selection of three transcription factors differentially expressed along each branch (LRT adjusted p value < 0.05). f Projection of the transcriptional states of the seven HSPCs onto the Lin−CD34/CD164 map
Fig. 3
Fig. 3
Cell fate analyses of Lin−CD34+CD135− cells support the MEP-associated origin of basophil progenitors. a Projection of the transcriptional profile of cells belonging to group 9 in Lin−CD34/CD164 data set onto sorted HSPCs map. Pie chart on the bottom represents the immunophenotipic characteristic for HSPC cells identified as most similar. b Experimental design. Lin−CD34+CD135− and Lin−CD34+CD135+ populations were sorted from the BM CD34+ cells of three healthy donors and their lineage potential was investigated through in vitro functional assays. c Spatial distribution estimated by using a two-dimensional kernel density estimator for cell exhibiting: top graph, high expression (at RNA level) of FLT3 gene (normalized expression > 0.9); bottom graph, no expression of FLT3 gene (normalized expression = 0). d Bar graph showing the content of HSPCs in CD135− and CD135+ fractions. Values are proportions estimates ± SE, estimated using method of moments and Dirichlet-Multinomial model. Hypothesis testing has been performed by means of independent samples, heteroscedastic, two-tailed Student’s t test. Details are provided in Supplementary Table 3. e Growth curves from three different culture conditions. My, Myeloid differentiating culture; Mk, Megakaryocyte differentiation culture; Baso, Basophil differentiation culture. Values are median ± error. Statistics by independent samples, two-tailed Student’s t test for each time point considered independently from the others (*p < 0.05). f Single-cell (SC) assay showing the total number of colonies obtained from CD135− and CD135+ fractions at the end of the three different culture conditions. Shown are median ± error. Statistics by independent samples, two-tailed Student’s t test (*p < 0.05). g FACS analysis of bona fide Basophils (Baso) defined as CD14−CD15−FceRIA+CCR3+IL5RA+ cells on CD135− and CD135+ populations upon basophil (upper panel) and myeloid (lower panel) differentiation culture. FceRIA− pick indicates the negative control. h Bar graphs summarizing the cytometric analysis described in g. Shown are the percentage of Baso, CD14+ cells and CD15+ cells on CD135− and CD135+ populations from the basophil (left panel) and myeloid (right panel) differentiation culture. Values are median ± error. Statistics by independent samples, two-tailed Student’s t test (*p < 0.05)
Fig. 4
Fig. 4
Human Lin−CD34/CD164 versus mouse Kit+ transcriptome map and gene expression dynamics analysis. a Classification of individual cells into 11 homogenous transcriptional groups, based on inferred principal trajectories on mouse Kit+ transcriptome data (Supplementary Fig. 3c for details). Group labels and colors have been set to highlight similarities with Lin−CD34/CD164 fractionating map. Solid lines show results based on final converged iteration (Supplementary Fig. 3c for details). Dashed lines added manually to highlight a potential additional trajectory not present in final iteration and suggested by PBA analysis reported in the middle (DC-M). MPP, MultiPotent progenitor cells; Meg, megakaryocytes; BE, baso/eosinophils; E, erythroid cells; Ly, lymphoid cells; DC, dendritic cells; M, monocytes; G, granulocytes. b Comparison of human and mouse transcriptional states during erythropoiesis. Upper panels, schemes of the comparison. Mirror heatmaps, expression of the 721 orthologous genes selectively expressed along the human and mouse erythroid differentiation (LRT adjusted p value < 0.05). c Representative comparable dynamics of the orthologues TRIB2/Trib2 and CA2/Car2 reported in Tusi et al. vs divergent dynamics of the orthologues CD47/Cd47 and ZFPM1/Zfpm1 reported in Pishesha et al.
Fig. 5
Fig. 5
Immunophenotyping and in vitro/in vivo functional assays of CD164 expressing subsets in BM CD34+ cells. a Experimental design. b Representative FACS plots showing the contribution of Lin−/+ cells and HSPC subsets in CD164high and CD164low fractions of CD34+ cells. c Percentage of CD164high and CD164low fractions in CD34+ cells. Shown are Mean ± SD from nine independent BM. d Bar graphs showing the content of Lin−/+, CD38−, CD90+ cells and HSPCs in CD164high and CD164low fractions, and in CD34+ cells. Values are Mean ± SD from nine independent BM. Statistics by independent samples, heteroscedastic, two-tailed Student’s t test (*p < 0.05, **p < 0.0005, ***p < 0.0001). For the HSPCs bar graph, plotted values are proportion estimates ± SE, estimated using method of moments and Dirichlet-Multinomial model. Details are provided in Supplementary Table 4. e Pie chart distribution of CD164high and CD164low fractions on HSPC subsets from nine independent BM. f Bar graphs showing the total number (left) and type of colonies (right) scored at day 14 in a methylcellulose-based colony-forming unit (CFU) assay. Top left, sorting gating strategy (CFCs, colony-forming cells, BFU-E, burst-forming unit-erythroid cells, CFU-E, colony-forming unit-erythroid cells, CFU-GM,colony-forming unit-granulocyte/macrophages). Shown are mean ± SD from six independent BM. Statistics by independent samples, heteroscedastic, two-tailed Student’s t test (*p < 0.05). g Growth curves from three different culture conditions. Mk, Megakaryocyte; My, Myeloid. Values are mean ± SD from nine independent BM. Statistics by independent samples, heteroscedastic, two-tailed Student’s t test (*p < 0.05, **p < 0.0005, ***p < 0.0001). h Single-cell (SC) assay showing the total number of colonies obtained from each population in the Mk (left) and My (right) differentiating culture. Shown are median ± error from three independent BM. Statistics by independent samples, two-tailed Student’s t test (*p < 0.01). i Experimental design. Sorted CD164high and CD164low populations were transplanted in NBSGW mice each at the dose of 2.5 × 105 cells/mouse. In order to reflect the real proportions in the human BM, immunomagnetic-selected CD34+ cells were transplanted at the dose of 5.0 × 105 cells/mouse. The human engraftment was evaluated in the murine peripheral blood at different time points, and in BM and spleen at 16 weeks post transplant. j Human CD45+ cell engraftment in murine PB (left; CD164high, n = 3; CD164low, n = 3; CD34+, n = 4 mice) and BM (right; CD164highn = 3; CD164low, n = 2; CD34+, n = 4 mice). k Relative contribution of human cell populations inside the hCD45+ and hCD45− compartments in murine BM. (CD164high, n = 3; CD164low, n = 2; CD34+, n = 4 mice)

References

    1. Kawamoto H, Ikawa T, Masuda K, Wada H, Katsura Y. A map for lineage restriction of progenitors during hematopoiesis: The essence of the myeloid-based model. Immunol. Rev. 2010;238:23–36. doi: 10.1111/j.1600-065X.2010.00959.x. - DOI - PubMed
    1. Ema H, Morita Y, Suda T. Heterogeneity and hierarchy of hematopoietic stem cells. Exp. Hematol. 2014;42:74–82. doi: 10.1016/j.exphem.2013.11.004. - DOI - PubMed
    1. Eaves C. Hematopoietic stem cells: concepts, definitions, and the new reality. Blood. 2015;125:2605–2614. doi: 10.1182/blood-2014-12-570200. - DOI - PMC - PubMed
    1. Laurenti E, et al. The transcriptional architecture of early human hematopoiesis identifies multilevel control of lymphoid commitment. Nat. Immunol. 2013;14:756–763. doi: 10.1038/ni.2615. - DOI - PMC - PubMed
    1. Doulatov S, Notta F, Laurenti E, Dick JE. Hematopoiesis: a human perspective. Cell. Stem. Cell. 2012;10:120–136. doi: 10.1016/j.stem.2012.01.006. - DOI - PubMed

Publication types