. 2019 Jun 3;9(1):8167.
doi: 10.1038/s41598-019-44547-y.

Disrupted Maturation of the Microbiota and Metabolome among Extremely Preterm Infants with Postnatal Growth Failure

Affiliations

Disrupted Maturation of the Microbiota and Metabolome among Extremely Preterm Infants with Postnatal Growth Failure

Noelle E Younge et al. Sci Rep. .

Abstract

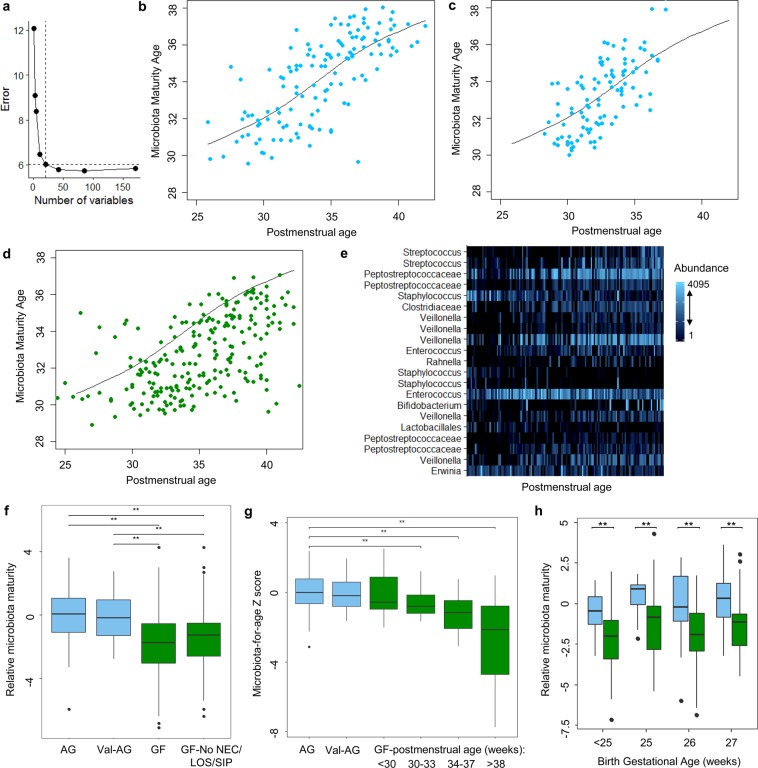
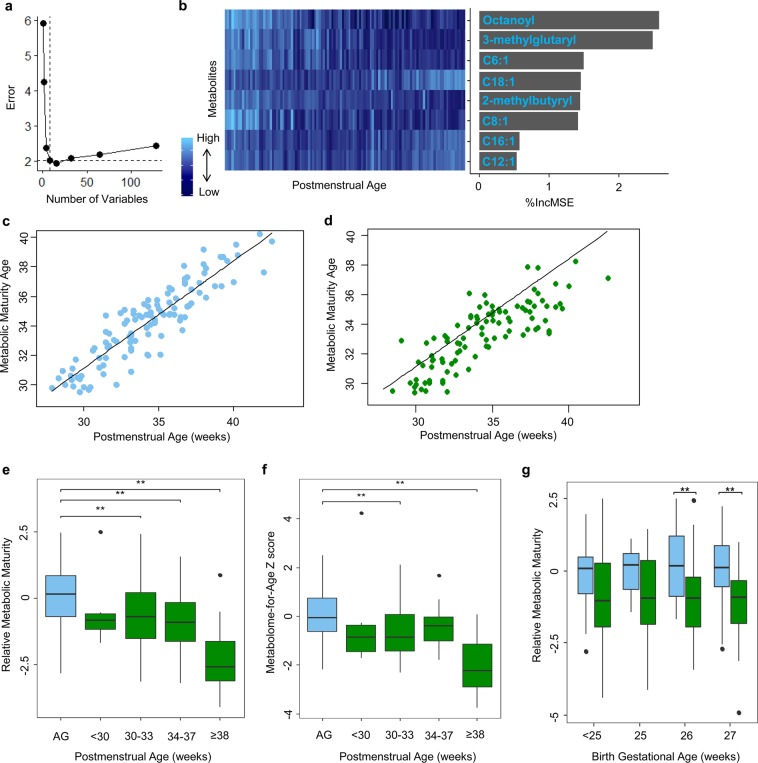
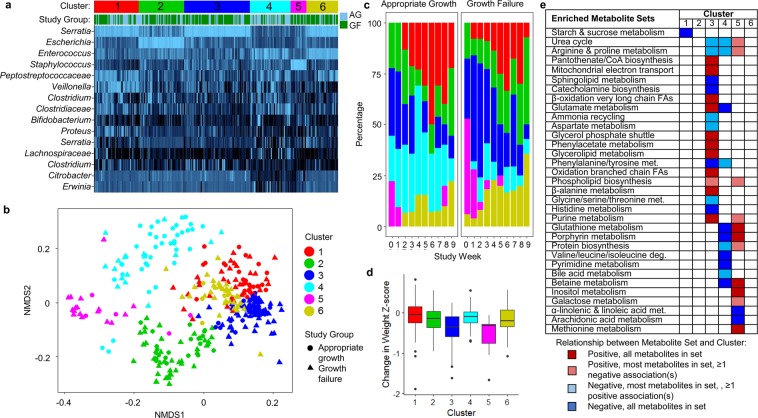
Growth failure during infancy is a major global problem that has adverse effects on long-term health and neurodevelopment. Preterm infants are disproportionately affected by growth failure and its effects. Herein we found that extremely preterm infants with postnatal growth failure have disrupted maturation of the intestinal microbiota, characterized by persistently low diversity, dominance of pathogenic bacteria within the Enterobacteriaceae family, and a paucity of strictly anaerobic taxa including Veillonella relative to infants with appropriate postnatal growth. Metabolomic profiling of infants with growth failure demonstrated elevated serum acylcarnitines, fatty acids, and other byproducts of lipolysis and fatty acid oxidation. Machine learning algorithms for normal maturation of the microbiota and metabolome among infants with appropriate growth revealed a pattern of delayed maturation of the microbiota and metabolome among infants with growth failure. Collectively, we identified novel microbial and metabolic features of growth failure in preterm infants and potentially modifiable targets for intervention.


Conflict of interest statement

The authors declare no competing interests.

Figures

Figure 1
Figure 1
Microbiota diversity and composition. (a) Shannon diversity was higher over weeks 1–9 in appropriate growth (blue) vs. growth failure (green) (compared by SS-ANOVA with study week as continuous variable, p = 0.002). (b) Bacterial families with significant differences in relative abundance between groups by SS-ANOVA. The shaded areas represent the time intervals over which the abundance was higher in appropriate growth (blue) or growth failure (red). (c) Relative abundance of the top 10 bacterial families over time. (d) Bacterial genera with higher relative abundance in appropriate growth (blue) or growth failure (red) by SS-ANOVA. AG, appropriate growth. GF, growth failure.
Figure 2
Figure 2
Maturation of the microbiota. A 21-feature random forest regression model was constructed with the appropriate growth samples (R2 = 58%, p = 0.001). The number of features was selected by cross-validation (a). The predicted microbiota maturity age increased with postmenstrual age (b). The model was applied to a separate cohort of infants with appropriate growth (c) and to infants with growth failure (d). The spline derived from the appropriate growth infants in the primary cohort is shown in each panel (bd). The 21 features in the model and their abundance (rarefied counts) over time (i.e., postmenstrual age) are shown (e). Relative microbiota maturity and microbiota-for-age Z scores were similar in the two appropriate growth cohorts, but significantly lower in growth failure (f,g). Microbiota maturity was also significantly lower when the analysis was restricted to infants without sepsis, necrotizing enterocolitis, or intestinal perforation (f). Relative microbiota maturity age was lower in infants with growth failure than infants with appropriate growth when infants were stratified by gestational age at birth (h). **p < 0.05 by pairwise Wilcoxon rank sum test with Benjamini-Hochberg adjustment. AG, appropriate growth. GF, growth failure. LOS, late-onset sepsis. NEC, necrotizing enterocolitis. SIP, spontaneous intestinal perforation. Val-AG, validation cohort appropriate growth.
Figure 3
Figure 3
Maturation of the metabolome. An 8-feature random forest regression model was constructed using acylcarnitine profiles of infants with appropriate growth. (a) The number of features was selected by cross-validation. (b) Heatmap of the 8 metabolites included in the model over time, ranked in order of importance in the model by the percent difference in mean squared error (%IncMSE). (c) Metabolic maturity age increased with postmenstrual age in the appropriate growth infants. (d) The model was then applied to infants with growth failure. The metabolic maturity age of many of the infants with growth failure fell below the spline derived from infants with appropriate growth in both the primary analysis of the full 58 infant cohort and the secondary analysis of infants without sepsis, necrotizing enterocolitis, or intestinal perforation (shown). (e) Relative metabolic maturity and metabolome-for-age Z scores were significantly lower in growth failure (green) than in appropriate growth (blue), both when including all infants and when including only infants without sepsis, necrotizing enterocolitis, or intestinal perforation (shown). (g) Relative metabolic maturity was lower among infants with growth failure (green) than infants with appropriate growth across birth gestational age strata (blue); the difference between groups was statistically significant among infants born at 26 weeks and 27 weeks of gestation. **p < 0.05, as determined by the pairwise Wilcoxon rank sum tests with Benjamini-Hochberg adjustment. AG, appropriate growth.
Figure 4
Figure 4
Microbiota clusters. (a) Relative abundance of the top 15 OTUs in the 6 clusters. (b) Non-metric multidimensional scaling (NMDS) plot of clusters. (c) The distribution of clusters by growth group and time. (d) Change in weight z-scores between consecutive samples. Clusters 3 and 5 were associated with significantly greater weight z-score reductions than samples in clusters 1, 2, 4, and 6. (e) Metabolite sets enriched in clusters. AG, appropriate growth; deg., degradation; FAs, fatty acids; GF, growth failure; met., metabolism.

References

    1. Ehrenkranz RA, et al. Longitudinal growth of hospitalized very low birth weight infants. Pediatrics. 1999;104:280–289. doi: 10.1542/peds.104.2.280. - DOI - PubMed
    1. Horbar JD, et al. Weight Growth Velocity and Postnatal Growth Failure in Infants 501 to 1500 Grams: 2000–2013. Pediatrics. 2015;136:e84–92. doi: 10.1542/peds.2015-0129. - DOI - PubMed
    1. Johnson MJ, Wootton SA, Leaf AA, Jackson AA. Preterm birth and body composition at term equivalent age: a systematic review and meta-analysis. Pediatrics. 2012;130:e640–649. doi: 10.1542/peds.2011-3379. - DOI - PubMed
    1. Ong KK, et al. Postnatal growth in preterm infants and later health outcomes: a systematic review. Acta Paediatr. 2015;104:974–986. doi: 10.1111/apa.13128. - DOI - PMC - PubMed
    1. Belfort MB, Gillman MW, Buka SL, Casey PH, McCormick MC. Preterm infant linear growth and adiposity gain: trade-offs for later weight status and intelligence quotient. J Pediatr. 2013;163:1564–1569 e1562. doi: 10.1016/j.jpeds.2013.06.032. - DOI - PMC - PubMed

Publication types

MeSH terms

Substances