Randomized Controlled Trial
. 2019 Jul;3(7):746-757.
doi: 10.1038/s41562-019-0611-9. Epub 2019 Jun 3.

Closed-loop digital meditation improves sustained attention in young adults

Affiliations
Randomized Controlled Trial

Closed-loop digital meditation improves sustained attention in young adults

David A Ziegler et al. Nat Hum Behav. 2019 Jul.

Abstract

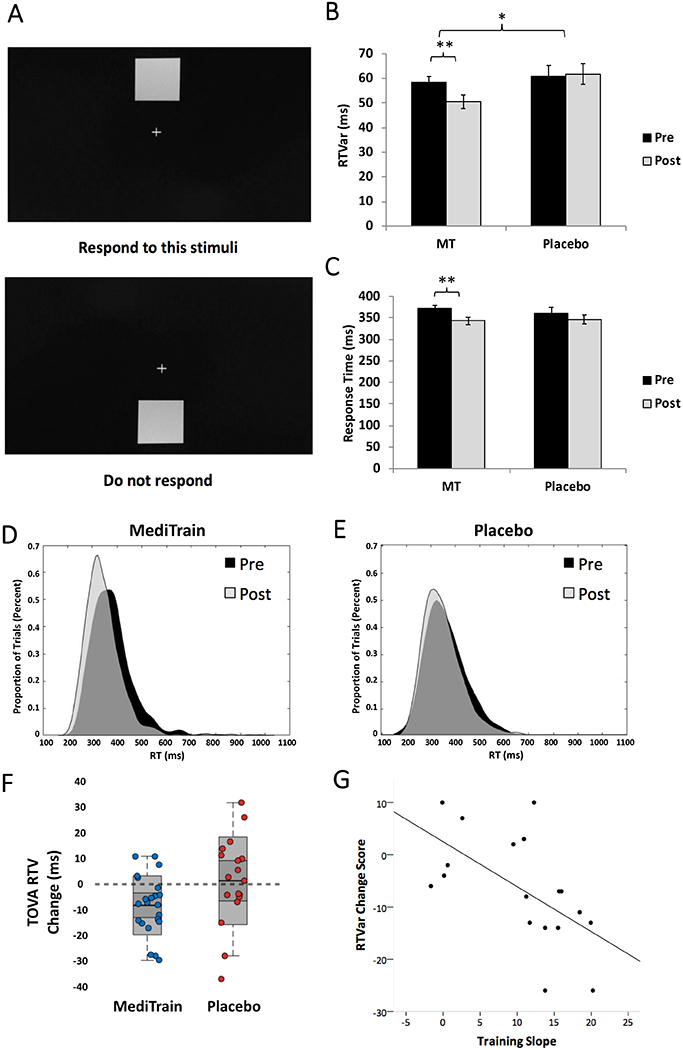
Attention is a fundamental cognitive process that is critical for essentially all aspects of higher-order cognition and real-world activities. Younger generations have deeply embraced information technology and multitasking in their personal lives, school and the workplace, creating myriad challenges to their attention. While improving sustained attention in healthy young adults would be beneficial, enhancing this ability has proven notoriously difficult in this age group. Here we show that 6 weeks of engagement with a meditation-inspired, closed-loop software program (MediTrain) delivered on mobile devices led to gains in both sustained attention and working memory in healthy young adults. These improvements were associated with positive changes in key neural signatures of attentional control (frontal theta inter-trial coherence and parietal P3b latency), as measured by electroencephalography. Our findings suggest the utility of delivering aspects of the ancient practice of focused-attention meditation in a modern, technology-based approach and its benefits on enhancing sustained attention.


Conflict of interest statement

Competing Interests. AG is co-founder, shareholder, BOD member, and advisor for Akili Interactive, a company that produces therapeutic video games. MediTrain and the apps used for the control condition are not currently associated with Akili. The other authors declare no competing interests.

Figures

Figure 1.
Figure 1.. MediTrain Training Curves.
Each gray line represents data from an individual MediTrain participant (n = 20) and the bold green bar represents the average of all participants. On average, the group went from an initial time of 20 sec to 47.5 sec at the end of the first week to a time of 346 sec at the completion of the sixth week.
Figure 2.
Figure 2.. Improvements in Sustained Attention.
A) stimuli and protocol for the vigilance task; B) Response Time variability (RTVar) post-treatment was significantly lower (ANCOVA F1,37 = 6.4, p = 0.016, Cohen’s d = −0.66, 95% CI: −17.8 to −2.0) in MediTrain (MT; n = 22) compared to placebo (n = 18), with MediTrain participants showing a significant decrease in RTVar from pre- (mean = 58.2ms, SE = 2.6ms) to post- (mean = 50.5ms, SE = 2.8ms; Δ = −7.98 ms, two-tailed paired t21 = −3.5, p = 0.002, 95% CI: −12.7 to −3.1), while control participants showed no significant difference in RTVar from pre- (mean = 60.7 ms, SE = 4.6ms) to post- (mean = 61.8ms, SE = 4.2ms; Δ = 1.1 ms, two-tailed paired t17 = 0.29, p = 0.78, 95% CI: −7.0 to 9.1). C) While RTs did not differ between groups after treatment, only MediTrain participants were significantly faster at post-treatment compared to baseline. D) Histograms of RT distributions for MediTrain at pre (black) and post (gray) intervention and for E) Placebo at pre (black) and post (gray) intervention. F) Change scores (post – pre) for RTVar for individual MediTrain (blue circles) and placebo (red circles) participants. Shaded boxes represent 95% confidence intervals. G) Scatterplot and best-fit line for the correlation between training slopes and change in RTVar on the vigilance task in MediTrain participants. Error bars represent SE of the mean, *ANCOVA p < 0.05, **two-tailed paired t-test p < 0.01.
Figure 3.
Figure 3.. Correlations between RTVar and neural markers of attention for Experiment 3.
A) In an independent sample of participants (n = 69) who completed a single EEG session, RTvar during vigilance task performance was significantly correlated with the latency of the P3b ERP at parietal electrode Pz (Pearson r67 = 0.280, p = 0.020), such that participants with faster P3b latencies exhibited less variable RTs. B) RTvar was also negatively correlated with the area under the curve (AUC) for P3b at parietal electrode Pz (Pearson r67 = −0.368, p = 0.002), such that participants with greater P3b AUC values exhibited less variable RTs. C) RTvar was also significantly correlated with frontal midline theta ITC from 200–300 ms after onset of infrequent target stimuli (Pearson r67 = −0.365, p = 0.002), indicating that participants with greater frontal midline theta ITC values tend to have less variable RTs. D) We also found a correlation between RTVar and frontal midline theta power from 200–300 ms after onset of infrequent target stimuli (Pearson r67 = −0.270, p = 0.025), indicating that participants with greater frontal midline theta power tend to have less variable RTs.
Figure 4.
Figure 4.. Changes in mid-frontal theta ITC.
A) Time-frequency plot of the difference in theta-band ITC for MediTrain (n = 12) versus placebo (n = 12) groups at post-intervention while completing the vigilance task; B) Change scores (post – pre) for P3B latencies for individual MediTrain (blue circles) and placebo (red circles) participants. Shaded boxes represent 95% confidence intervals. C) An ANCOVA of Phase Locking Values (PLV; see Methods for details) revealed a significant difference in post-intervention theta-band ITC, corrected for pre-intervention levels (ANCOVA F1,21 = 9.71, p = 0.005, Cohen’s d = 1.27, 95% CI: 0.33 to 0.42); PLV were computed for the time window depicted by the dotted rectangle in A. *ANCOVA or one-sample t-test p < 0.05. D) Theta-band ITC differences between the MediTrain group and placebo group at the post-intervention time point was source localized to medial and lateral prefrontal cortex.
Figure 5.
Figure 5.. Changes in P3b Latencies.
A) ERP waveforms from the Pz electrode during the vigilance task for MediTrain and placebo at pre- and post-intervention; B) Change scores (post – pre) for theta ITC for individual MediTrain (blue circles) and placebo (red circles) participants. Shaded boxes represent 95% confidence intervals. C) An ANCOVA revealed a significant difference between training groups in the post-intervention P3b peak latencies (F1,21 = 15.4, p = 0.001, Cohen’s d = 1.02, 95% CI: 328 to 353). Post-hoc analyses showed that participants in the MediTrain group exhibited significantly faster P3b peaks (two-tailed paired t11 = 3.083 , p = 0.010, Cohen’s d = 0.89 95% CI: 10.4 to 62.2) at post-intervention (mean = 319.8 ms, SE = 13.9 ms) than at pre (mean = 356.1 ms, SE = 15.2 ms), while placebo participants had significantly slower P3b peaks (two-tailed paired t11 = −2.236 , p = 0.047, Cohen’s d = −0.65, 95% CI: −29.71 to −0.24) at post-intervention (mean = 360.7 ms, SE = 14.7 ms) than at pre (mean = 345.7 ms, SE = 16.7 ms); D) Topographical distribution on P3b at peak latency (350 ms) collapsed across all participants at pre. Error bars and shading represent SE of the mean, **ANCOVA p < 0.01, *two-tailed paired t-test p < 0.05.
Figure 6.
Figure 6.. Improvements in Visual Discrimination and Working Memory.
A) Visual discrimination and distractor filtering task stimuli and protocol; B) RTVar post-treatment was significantly lower in MediTrain (MT) compared to placebo (F1,38 = 5.5, p = 0.024, Cohen’s d = −0.73, 95% CI: 0.2 to 0.3), with MediTrain participants showing a significant decrease in RTVar from pre- (mean = 329 ms, SE = 3.1 ms) to post- (mean = 248 ms, SE = 2.9 ms; t21 = −5.7, p < 0.0001, 95% CI = −0.12 to −0.06), while control participants showed no significant difference in RTVar from pre- (mean = 336 ms, SE = 3.0 ms) to post- (mean = 345 ms, SE = 5.1 ms; t18 = −0.13, p = 0.9, 95% CI: 0.079 to 0.069). C) Change scores (post – pre) for Filter RTVar for individual MediTrain (blue circles) and placebo (red circles) participants. Shaded boxes represent 95% confidence intervals. D) Change Localization Task stimuli and protocol and E) An ANCOVA showed a significant group difference in capacity (k-score: the number of items a participant is able to keep in mind during a delay) at post-training (F(1,36) = 4.4, p = 0.04, Cohen’s d = 0.66, 95% CI = 0.006 to 0.35), with MediTrain participants showing a significant increase in k from pre- (mean = 3.11, SE = 0.09) to post-training (mean = 3.3, SE = 0.08, paired-sample t19 = 3.4, p = 0.003, 95% CI = 0.067 to 0.28), while the placebo control group did not show a change in k score from pre- (mean = 3.16, SE = 0.11) to post-training (mean = 3.15, SE = 0.11, Δ = −0.02, paired-sample t18 = −0.15, p = 0.89, 95% CI = −0.16 to 0.14). F) Change scores (post – pre) for CLT k-scores for individual MediTrain (blue circles) and placebo (red circles) participants. Shaded boxes represent 95% confidence intervals. Error bars represent SE of the mean, *ANCOVA p < 0.05, **paired-samples t-test p < 0.01.

References

    1. Rideout VJ, Foehr UG & Roberts DF Generation M2: Media in the Lives of 8- to 18-Year-Olds. (2010).
    1. Moisala M et al. Media multitasking is associated with distractibility and increased prefrontal activity in adolescents and young adults. Neuroimage 134, 113–121 (2016). - PubMed
    1. Ophir E, Nass C & Wagner AD Cognitive control in media multitaskers. Proceedings of the National Academy of Sciences of the United States of America 106, 15583–15587 (2009). - PMC - PubMed
    1. Ralph BC, Thomson DR, Cheyne JA & Smilek D Media multitasking and failures of attention in everyday life. Psychological research 78, 661–669 (2014). - PubMed
    1. Chun MM, Golomb JD & Turk-Browne NB A taxonomy of external and internal attention. Annu Rev Psychol 62, 73–101 (2011). - PubMed

Publication types