. 2019 Jun;25(6):911-919.
doi: 10.1038/s41591-019-0457-8. Epub 2019 Jun 3.

Identification of rare-disease genes using blood transcriptome sequencing and large control cohorts

Collaborators, Affiliations

Identification of rare-disease genes using blood transcriptome sequencing and large control cohorts

Laure Frésard et al. Nat Med. 2019 Jun.

Abstract

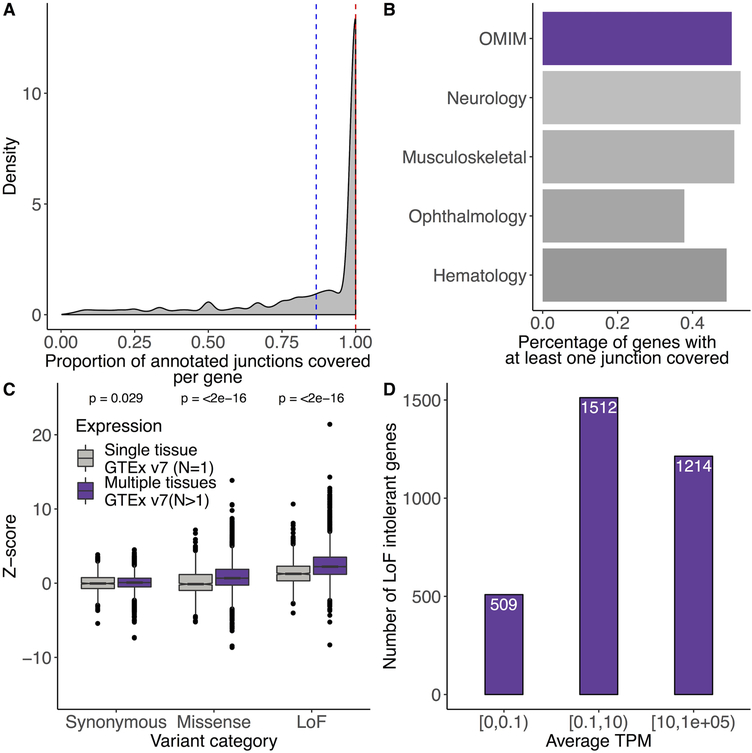
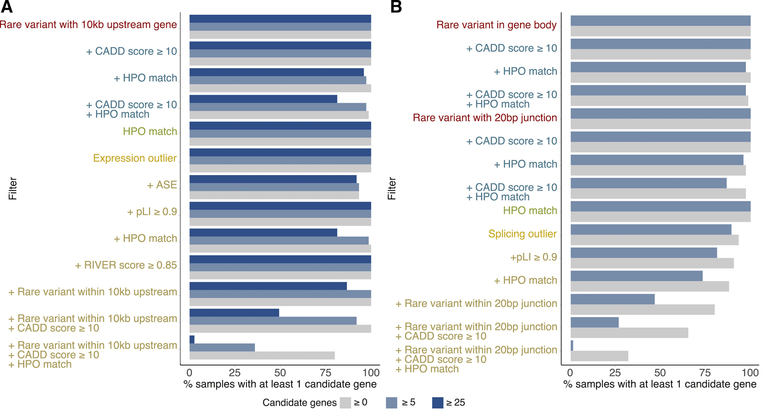
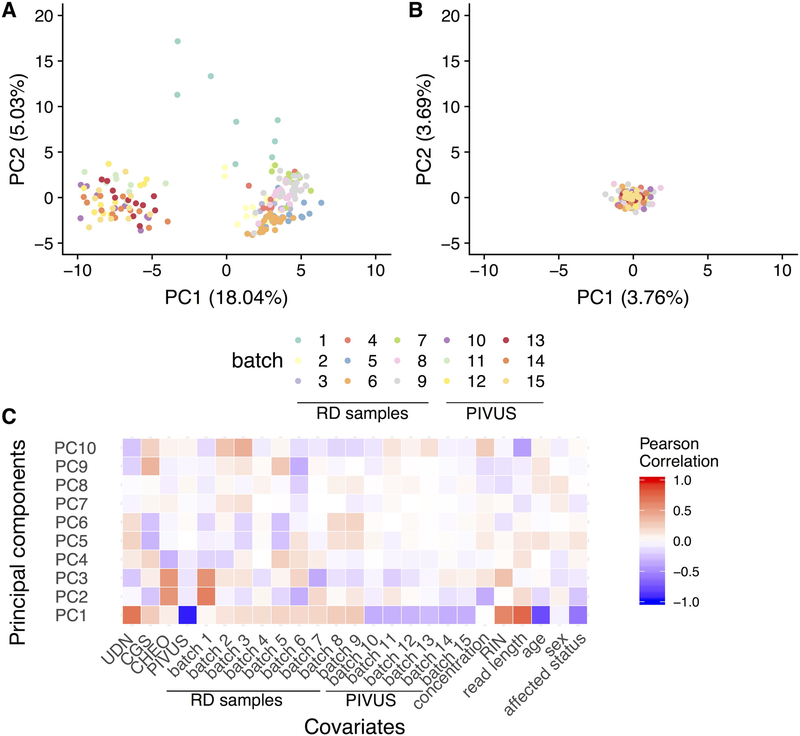
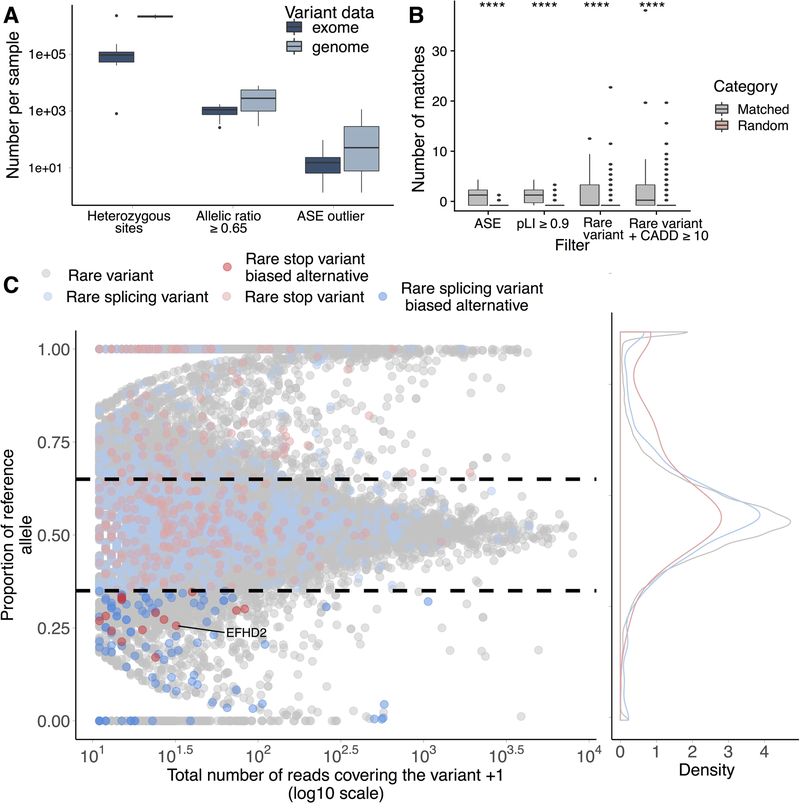
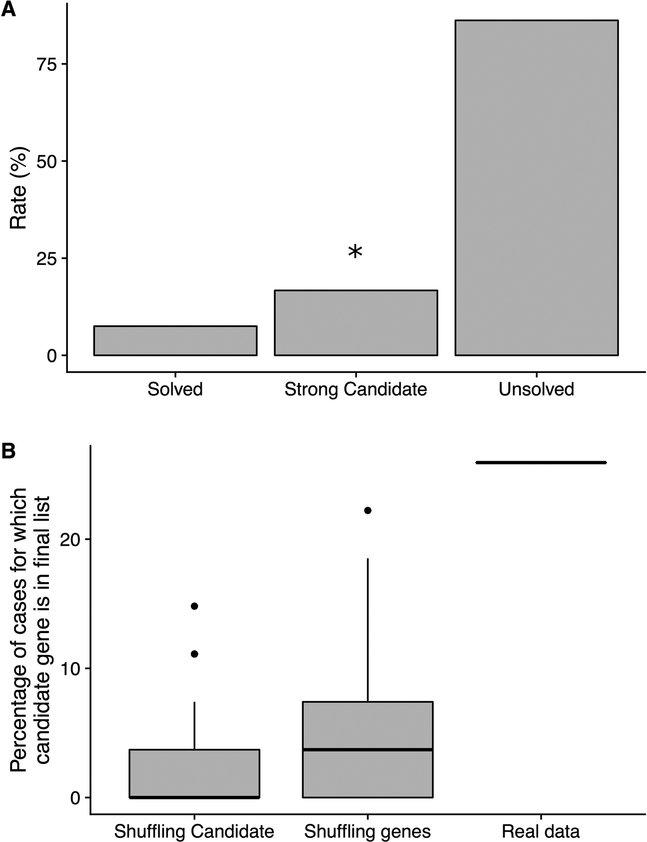
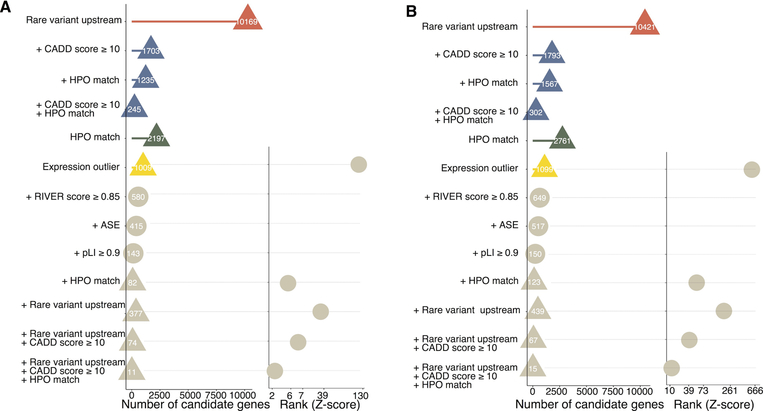
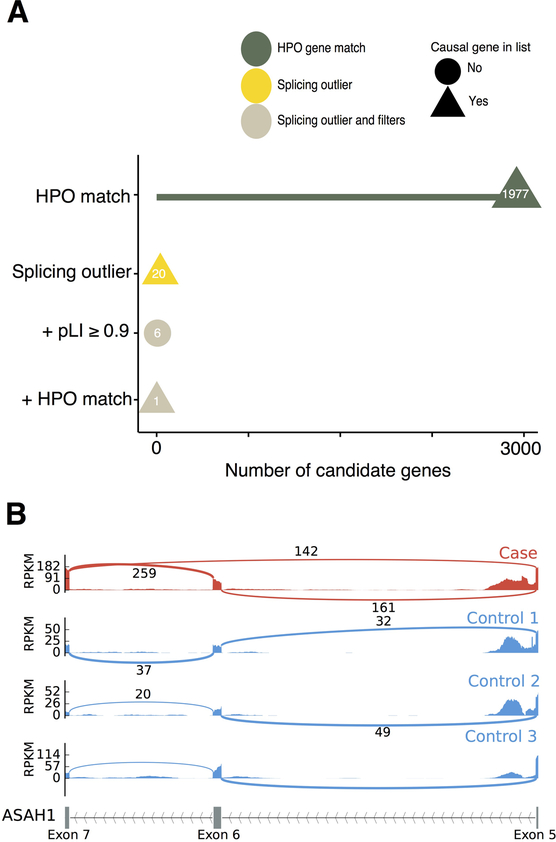
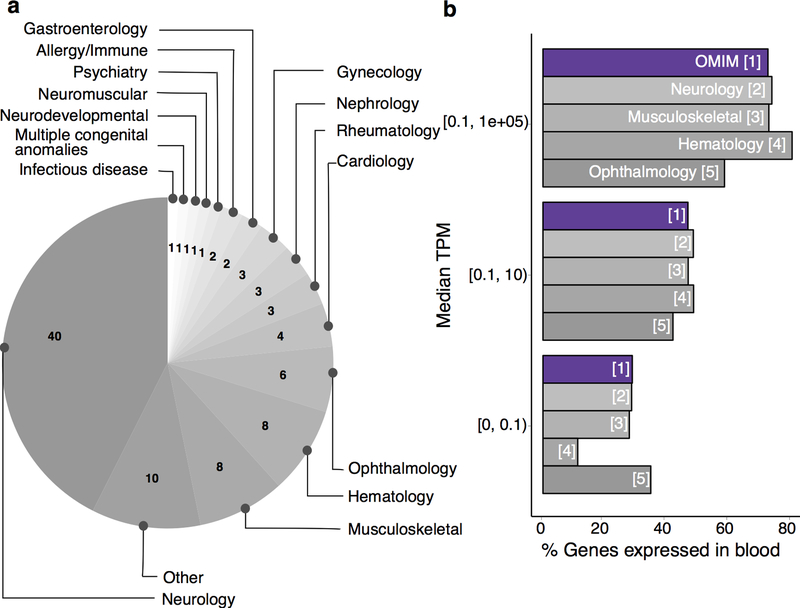
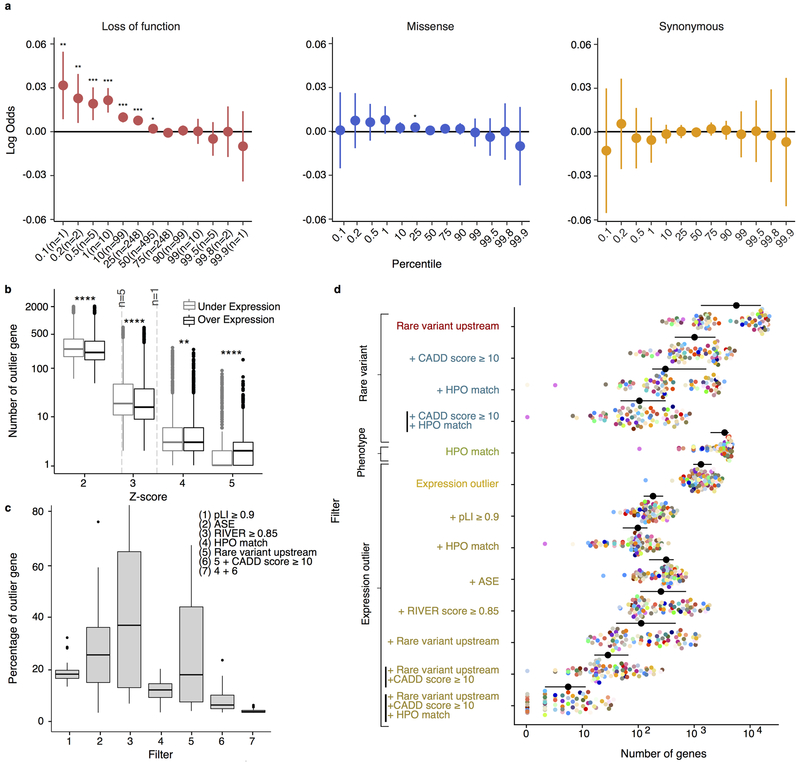
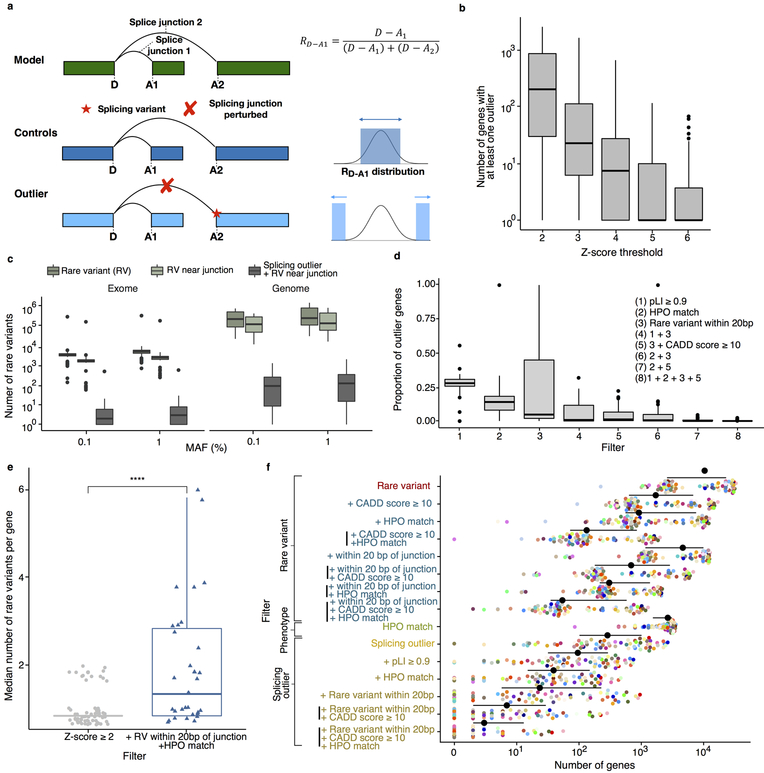
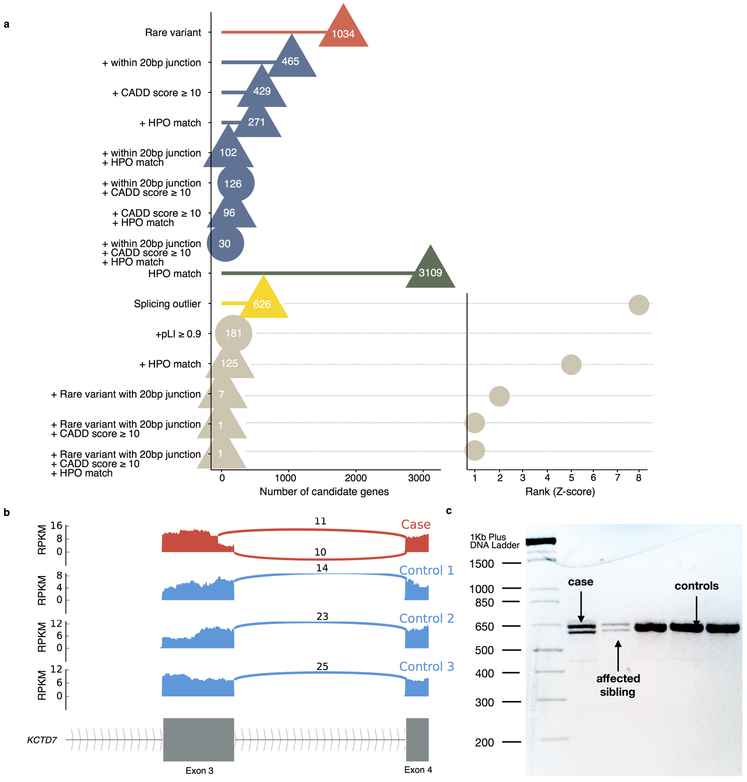
It is estimated that 350 million individuals worldwide suffer from rare diseases, which are predominantly caused by mutation in a single gene1. The current molecular diagnostic rate is estimated at 50%, with whole-exome sequencing (WES) among the most successful approaches2-5. For patients in whom WES is uninformative, RNA sequencing (RNA-seq) has shown diagnostic utility in specific tissues and diseases6-8. This includes muscle biopsies from patients with undiagnosed rare muscle disorders6,9, and cultured fibroblasts from patients with mitochondrial disorders7. However, for many individuals, biopsies are not performed for clinical care, and tissues are difficult to access. We sought to assess the utility of RNA-seq from blood as a diagnostic tool for rare diseases of different pathophysiologies. We generated whole-blood RNA-seq from 94 individuals with undiagnosed rare diseases spanning 16 diverse disease categories. We developed a robust approach to compare data from these individuals with large sets of RNA-seq data for controls (n = 1,594 unrelated controls and n = 49 family members) and demonstrated the impacts of expression, splicing, gene and variant filtering strategies on disease gene identification. Across our cohort, we observed that RNA-seq yields a 7.5% diagnostic rate, and an additional 16.7% with improved candidate gene resolution.


Conflict of interest statement

Competing Interests Statement

J.D.M. is on Genoox Scientific Advisory Board and Rainbow Genomics Clinical Advisory Board and consults for Illumina. E.A.A. is Co-Founder to Personalis, DeepCell and Advisor to Genome Medical and Sequence Bio. E.I. is a scientific advisor for Precision Wellness for work unrelated to the present project. S.B.M. is on the Scientific Advisory Board for Prime Genomics.

Figures

Extended Data Fig. 1
Extended Data Fig. 1. Gene expression patterns across whole blood samples.
We used a total of 1,061 whole blood samples from our controls cohorts and rare disease samples. a, Density plot representing the proportion of annotated junctions covered per gene. Those are a subset of genes for which at least one junction is covered with at least five uniquely mapped reads across at least 20% of the samples. On average (blue dashed line) 86%, (median of 100%—red dashed line) of junctions fulfil those criteria. b, Percentage of genes from disease genes panels in which at least one junction is covered with at least five uniquely mapped reads in at least 20% of samples. We observe that about 50% of genes from OMIM, Neurology, Musculoskeletal, Ophthalmology or Hematology panels are fulfilling this criteria. c, Tolerance to different types of mutations (from ExAC) in function of the expression status in a single versus multiple tissues (two-sided Wilcoxon test, Pvalue ≤ 2 × 10−16). Analysis performed on 620 individuals from GTEx v.7 across 22 tissues. Boxplots represent median value, with lower and upper hinges corresponding to the 25th and 75th percentiles, and lower and upper whiskers extend from the hinge to the smallest and largest value at most 1.5× interquartile range of the hinge, respectively. Genes that are expressed in multiple tissues tend to be more sensitive to missense and LoF mutations. d, Number of LoF intolerant genes stratified by expression level in blood. We considered genes with pLI score ≥ 0.9 as LoF intolerant.
Extended Data Fig. 2
Extended Data Fig. 2. Correction for batch effects: Expression data.
Analyses performed on n = 909 DGN samples and 143 rare diseases (cases and family controls). a, Plot of first two principal components run on uncorrected gene expression data. Samples are coloured by batch. Largest cluster (green dots) are DGN control samples (n = 909). b, Plot of first two principal components run on gene expression data after regressing out significant surrogate variables found by SVA. c, Correlation between known covariates and all significant surrogate variables (SVs). We observed that SV2 is highly correlated with the read type, and the sequencing technology corresponding to differences between DGN and the other samples.
Extended Data Fig. 3
Extended Data Fig. 3. Use of regression splines in expression data normalization.
a, Normalized gene expression residuals from 1,052 samples in an example gene without correction (left panel), after regressing out significant surrogate variables (SVs) (middle panel) and significant SVs plus regression splines on top SVs significantly associated with batch and study (right panel). Residuals were plotted against SV2 for illustration purposes (SV2 is significantly associated with batch (P value < 1 × 10–30, two-sided t-test from linear regression, no adjustment for multiple correction). b, Mean number of outlier genes per sample (n = 990) in each batch (absolute Z-score > 8) after correction with SVs (left panel) and SVs with regression splines (right panel). Standard deviation is displayed above each bar. Regression splines resulted in a more consistent number of outlier genes across samples in all batches. c, Benjamini & Hochberg adjusted P values resulting from a per-gene likelihood ratio test comparing linear regression model fit both with and without regression splines. Regression splines improve the model fit for 2,644 genes (P value ≤ 0.05,17.6% of all genes in dataset). Red dashed line indicates P value = 0.05 cutoff. d, Change in R2, in decreasing order, across all genes in the dataset (n = 14,988) after correcting data using significant SVs with regression splines, compared to correcting data using significant SVs without regression splines. Mean change in R2 is 0.036 (s.d. = 0.025).
Extended Data Fig. 4
Extended Data Fig. 4. Impact of the number of controls on loss-of-function intolerance enrichment.
a, Enrichment of case (red, n = 64) under-expression outliers in LoF sensitive genes as we increase the number of controls (7,600 random subsets for each sample size indicated in legend). This enrichment was not observed for rare disease family member controls (gray, n = 34). b, Benjamini & Hochberg adjusted −log10 P value associated with the enrichment at different number of controls (two-sided t-test, n = 64 cases). Horizontal line indicates 0.05 significance cutoff. The P values are decreasing as we increase the number of controls. When switching cases for controls (gray) we observed significant negative log odds when using the a smaller number of controls, but this trend disappeared when using the full set of 900 controls. For a and b, Boxplots represent median value, with lower and upper hinges corresponding to the 25th and 75th percentiles, and lower and upper whiskers extend from the hinge to the smallest and largest value at most 1.5× interquartile range of the hinge, respectively.
Extended Data Fig. 5
Extended Data Fig. 5. Percentage of samples left when filtering outliers.
Filters have various impacts on the number of samples with at least one candidate gene. By combining several layers of filters we are drastically reducing the number of candidate genes but also the number of samples for which we have candidates. We recommend to relax filter stringency after looking at sets of genes that match the most stringent criterion. a, Expression outliers. After filtering for outlier genes matching HPO terms, with a deleterious rare variant within 10 kb, we observed less than 2.6% of samples with over 25 candidate genes. b, Splicing outliers. When keeping only genes with HPO match, and a deleterious rare variant with 20 bp of the outlier junction, we observed less than 1.3% of samples with more than five candidate genes.
Extended Data Fig. 6
Extended Data Fig. 6. Correction for batch effects - Splicing data.
Analyses performed on 65 PIVUS samples and 143 rare disease samples. a, Plot of first two principal components (PCs) run on uncorrected splicing ratio data. Samples are coloured by batch. We observed that PC1 was separating PIVUS controls samples (left) from rare disease samples (right). b, Plot of first two PCs on splicing ratios after regressing out PCs explained up to 95% of the variance in the data. Batches were no longer separated on the first PCs. c, Correlation between known covariates 10 first PCs. We observed that PC1 is highly correlated with the batch, whereas PCs 2 and 3 separated samples from one institution (batch 1, CHEO) from others. We also observed that PC1 is highly correlated with RIN, highlighting differences in quality across samples.
Extended Data Fig. 7
Extended Data Fig. 7. Allele specific expression across rare disease samples.
a, Prevalence of ASE events in rare diseases samples (n = 112). Results are displayed separately for exome and genome sequencing. b, Difference in proportion of genes matching HPO terms for top 20 ASE outliers per case in comparison to random genes (100 random gene sets for each sample, n = 109 samples). Analysis performed for all genes, genes with pLI ≥ 0.9, genes with a rare variant (RV) and genes with a RV with CADD score ≥ 10. The top 20 ASE outlier genes are enriched for overlap with HPO-associated genes per case, regardless of the filters applied to the extreme ASE genes and background genes (**** P value ≤ 1 × 10−4, two-sided Wilcoxon test). For a and b, Boxplots represent median value, with lower and upper hinges corresponding to the 25th and 75th percentiles, and lower and upper whiskers extend from the hinge to the smallest and largest value at most 1.5× interquartile range of the hinge respectively. c, Rare deleterious variants are biased toward the alternative allele across all samples. A stop–gain variant was highly expressed in EFHD2 for one sample where there were matching symptoms.
Extended Data Fig. 8
Extended Data Fig. 8. Diagnostic rate after analysis of 80 distinct cases.
a, Overview of cases. Solved: causal gene found and further validated. Strong candidate: Strong candidate after RNA-seq analysis (out of a subset of 30 affected individuals for which we have prior candidate genes information from literature). Unsolved: Other cases for which further investigation is needed. b, Percentage of cases for which prior candidate gene is in final set of filtered genes (outlier with deleterious rare variant in a gene linked to symptoms). Analysis was performed only on a subset of 30 cases for which we have prior candidate gene information and for which we have genetic information. Shuffling candidates corresponds to the percentage of cases for which we observe a prior candidate genes in the most stringent gene list when shuffling gene lists across individuals (10,000 permutations). On average, no match is found. Shuffling genes correspond to the percentage of prior candidate genes we observed within the final set of DNA-only filters when sampling from this list a matched number of genes corresponding to the expression filters. Average matched percentage is 4.1% after 10,000 permutations. Real data corresponds to the percentage of cases for which we found a candidate gene in the most stringent RNA-based filter set. We find a match for 7 affected samples out of 30, that is, 25.9 % of cases. There is significantly more match in real data in comparison to permuted data (two-sided Wilcoxon rank sum test, P value < 10–5). Boxplots represent median value, with lower and upper hinges corresponding to the 25th and 75th percentiles, and lower and upper whiskers extend from the hinge to the smallest and largest value at most 1.5× interquartile range of the hinge, respectively.
Extended Data Fig. 9
Extended Data Fig. 9. Identification of disease gene through expression outlier detection.
MECR case. a, Proband results. After our most stringent filter, there are 11 candidate genes left and MECR is rank 2nd by Z-score. b, Proband’s brother. After filtering, only 15 out of 1,099 expression outliers are left and MECR is ranked 10th in that list.
Extended Data Fig. 10
Extended Data Fig. 10. Solved case without genetic data: ASAH1 case.
a, After filtering our detected splicing outliers for genes related to the phenotype (through HPO IDs), only eight genes were left, with ASAH1 being the most extreme outlier (Z-score = 3.9) and for which we previously confirmed the association with SMA-PME phenotype in the case. b, Sashimi plot of the case and 2 controls of the ASAH1 gene. For the case (red track), we observed an alternative transcript skipping exon 6 (supported by 142 reads). This pattern was never observed in controls.
Figure 1:
Figure 1:. Using blood RNA-seq to study rare disease genes.
a: Disease categories of sequenced affected patients. The majority of cases belong to neurology (n=40), musculoskeletal and orthopedics(n=8), hematology (n=8) and ophthalmology (n=8) categories. b: Percentage of disease genes (from curated lists) expressed in blood. We used the median TPM across 909 DGN samples, 65 PIVUS samples and our 143 samples.
Figure 2:
Figure 2:. Expression outliers in rare disease samples.
a: Enrichment for case or control outlier genes in intolerance to LoF (red), missense (blue) and synonymous (yellow) mutations at different percentiles of gene expression. Represented here as the log odds ratio with 95% Wald confidence intervals using 931 samples. P-values were calculated based on the z -statistic. No adjustment for multiple testing. b Impact of Z-score thresholds on number of outliers. Differences between under and over expression outliers were tested using a two-sided Wilcoxon rang sum test. No adjustment for multiple testing. Vertical dashed lines indicate mean Z-score for n=1 and n=5 percentiles across all genes used in analysis (N = 14,988). For a and b: significance level: **** p-value≤1×10⁻⁴; *** p-value≤1×10⁻³; ** p-value≤1×10⁻²; * p-value≤5×10⁻². c: Proportion of under-expression outlier genes remaining after filters (n=75 cases with genetic information). Adding genetic information (rare variant within 10kb upstream of the gene body) allows to filter down to 50% of the original set of outliers. Keeping only genes for which HPO information of the affected individual match helps narrow down to less than 10% of candidates. For b and c: Boxplots represent median value, with lower and upper hinges corresponding to the 25th and 75th percentiles, and lower and upper whiskers extend from the hinge to the smallest and largest value at most 1.5 * inter-quartile range of the hinge respectively. d: Number of candidate genes at each filter for all cases with genetic information (n=75). Average number of candidate genes and s.d are represented in black for each filter.
Figure 3:
Figure 3:. Splicing outlier detection.
a: Splicing outlier definition. Gene model is in green, rectangles represent 3 exons. In this model, we show junction information for one donor (D) and two acceptors(A1 and A2). For each sample for this gene we have coverage information for the two existing splicing junctions (D-A1 and D-A2). We defined the proportion of one splice junction as the number of reads overlapping this junction divided by the total number of reads spanning all junctions from a common donor (or acceptor). b: Number of genes with at least one splicing outlier at different Z-score thresholds (n=208 samples from PIVUS and rare disease cohorts). c: Number of rare variants in each sample, in total, nearby junction and associated with a splicing outlier (n=111 samples with genetic information). Rare variants were defined as variants with MAF≤0.1%. d: Impact of different filters on splicing outlier discoveries (n=75 cases with genetic information). e: We observed a significant increase (two-sided Wilcoxon test, p-value 9.8×10⁻⁵) in the median number of rare variants with CADD score≥10 in the gene when filtering outliers with a rare variant within 20 bp of the junction and relevant to the disease phenotype (HPO match) (n=109 samples with splicing outliers and genetic data). f: Number of candidate genes at each filter for all cases with genetic information (n=75). Mean value and s.d. are represented in black for each filter. For b and d and e: Boxplots represent median value, with lower and upper hinges corresponding to the 25th and 75th percentiles, and lower and upper whiskers extend from the hinge to the smallest and largest value at most 1.5 * inter-quartile range of the hinge respectively.
Figure 4:
Figure 4:. Identification of disease gene through splicing outlier detection.
a: Splicing outliers in the KCTD7 case. Number of candidate genes obtained throughout different filters using genetic data, splicing outlier data, and phenotypic data. Shape indicates if the causal gene is in the list. After filtering for splicing outliers with a deleterious rare splice variant within 20 bp of a splice junction and limiting the search to genes for which there is a link to phenotype (HPO match), 1 candidate gene was left, KCTD7. b: Sashimi plot of the case and 3 controls of the splicing gain region in KCTD7. For the case only (red track), we observed a new splicing junction ahead of the annotated one in exon 3. c: cDNA gel from fibroblast cDNA of exons 2–4 of KCTD7 for the proband, her affected sibling and three unaffected controls (no independent replicate). Both for the case and her affected brother we observed 2 fragments of different size, corresponding to the alternative splice products induced by the splice-gain mutation. In control samples, only one fragment is observed, corresponding to the original transcript.

References

    1. Amberger JS, Bocchini CA, Schiettecatte F, Scott AF & Hamosh A OMIM.org: Online Mendelian Inheritance in Man (OMIM®), an online catalog of human genes and genetic disorders. Nucleic Acids Research 43, D789–D798 (2015). - PMC - PubMed
    1. Boycott KM et al. International Cooperation to Enable the Diagnosis of All Rare Genetic Diseases. The American Journal of Human Genetics 100, 695–705 (2017). - PMC - PubMed
    1. Gilissen C, Hoischen A, Brunner HG & Veltman JA Unlocking Mendelian disease using exome sequencing. Genome Biology 12, 228 (2011). - PMC - PubMed
    1. Yang Y et al. Clinical Whole-Exome Sequencing for the Diagnosis of Mendelian Disorders. New England Journal of Medicine 369, 1502–1511 (2013). - PMC - PubMed
    1. Ewans LJ et al. Whole-exome sequencing reanalysis at 12 months boosts diagnosis and is cost-effective when applied early in Mendelian disorders. Genet. Med (2018). doi:10.1038/gim.2018.39 - DOI - PubMed

Publication types