. 2019 Apr 16;9(10):5975-5990.
doi: 10.1002/ece3.5181. eCollection 2019 May.

Differential gene expression in relation to mating system in Peromyscine rodents

Affiliations

Differential gene expression in relation to mating system in Peromyscine rodents

Jesyka Meléndez-Rosa et al. Ecol Evol. .

Abstract

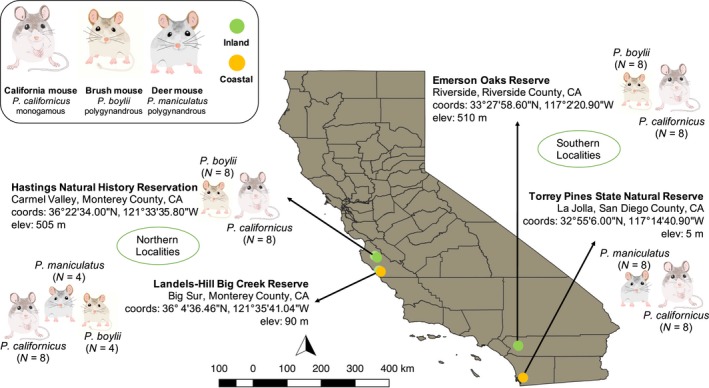
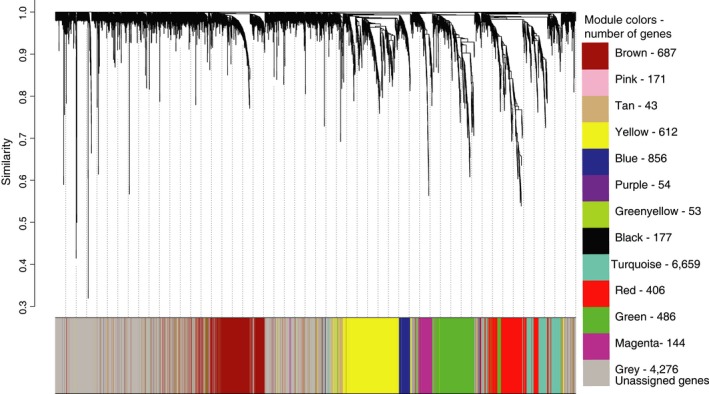
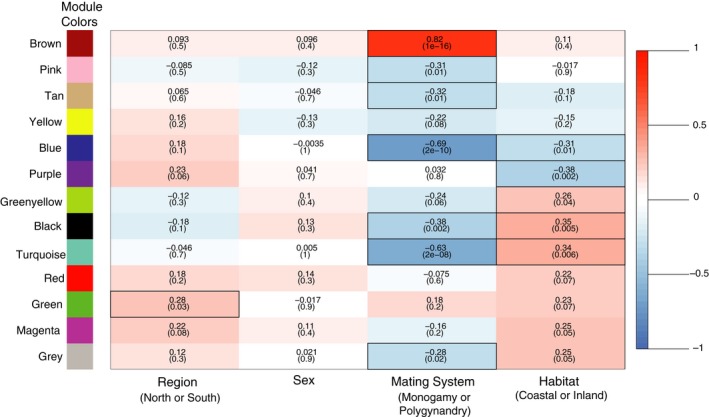
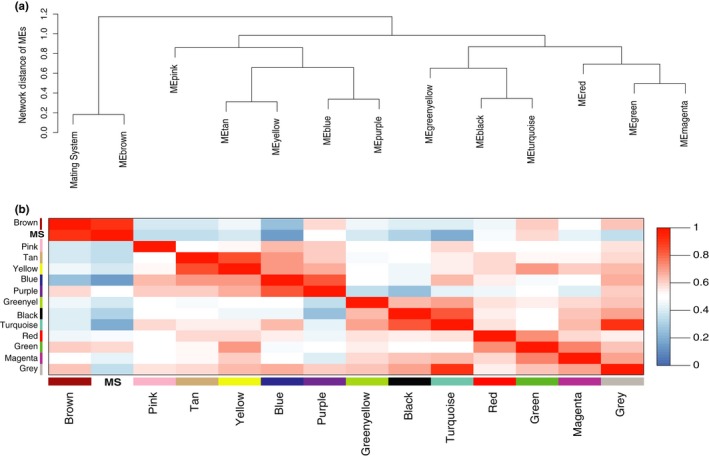
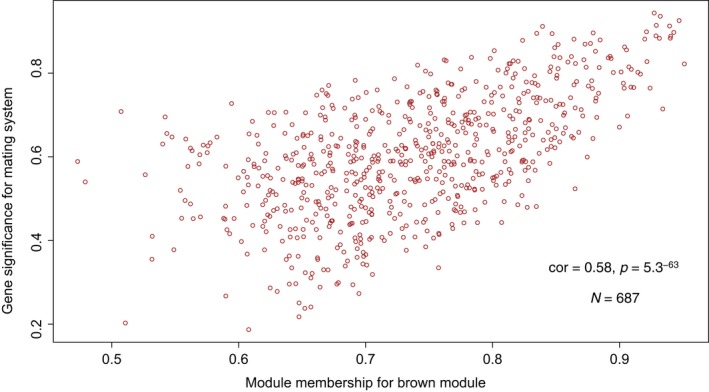
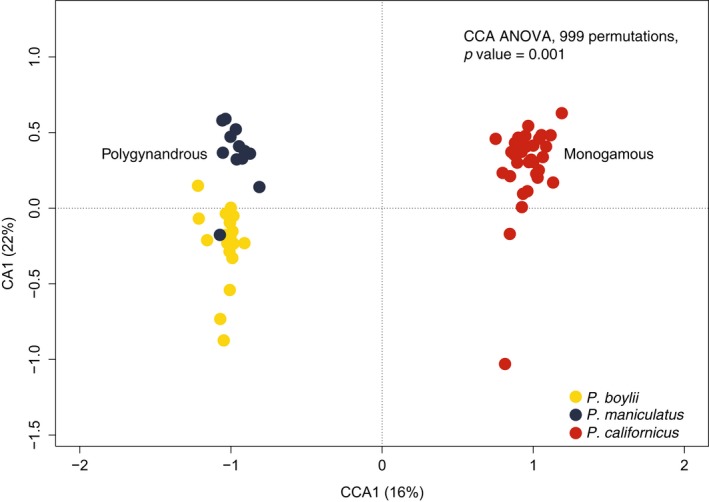
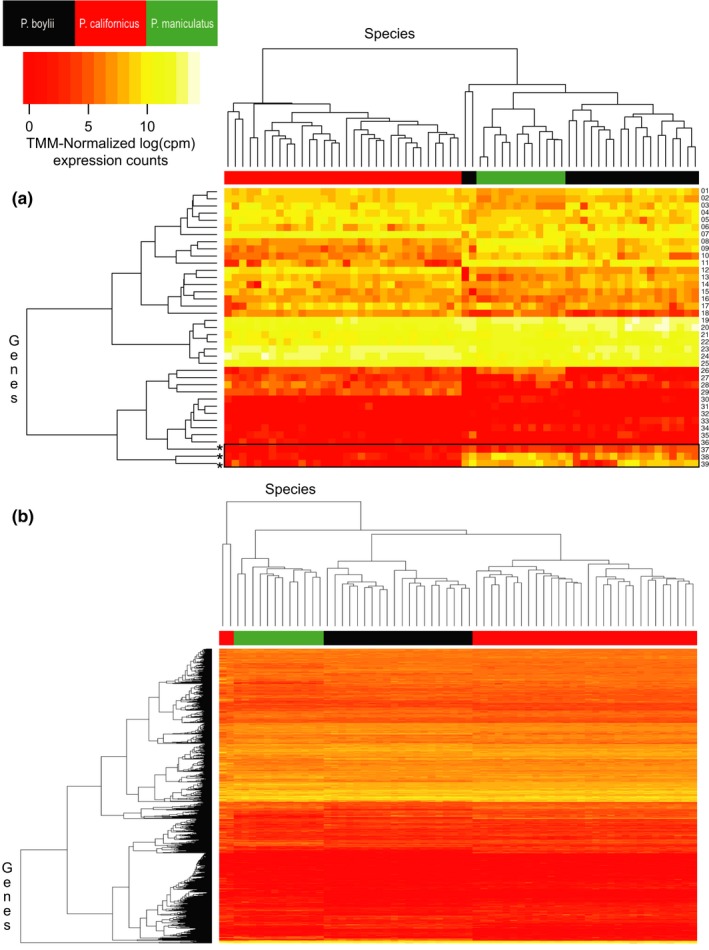
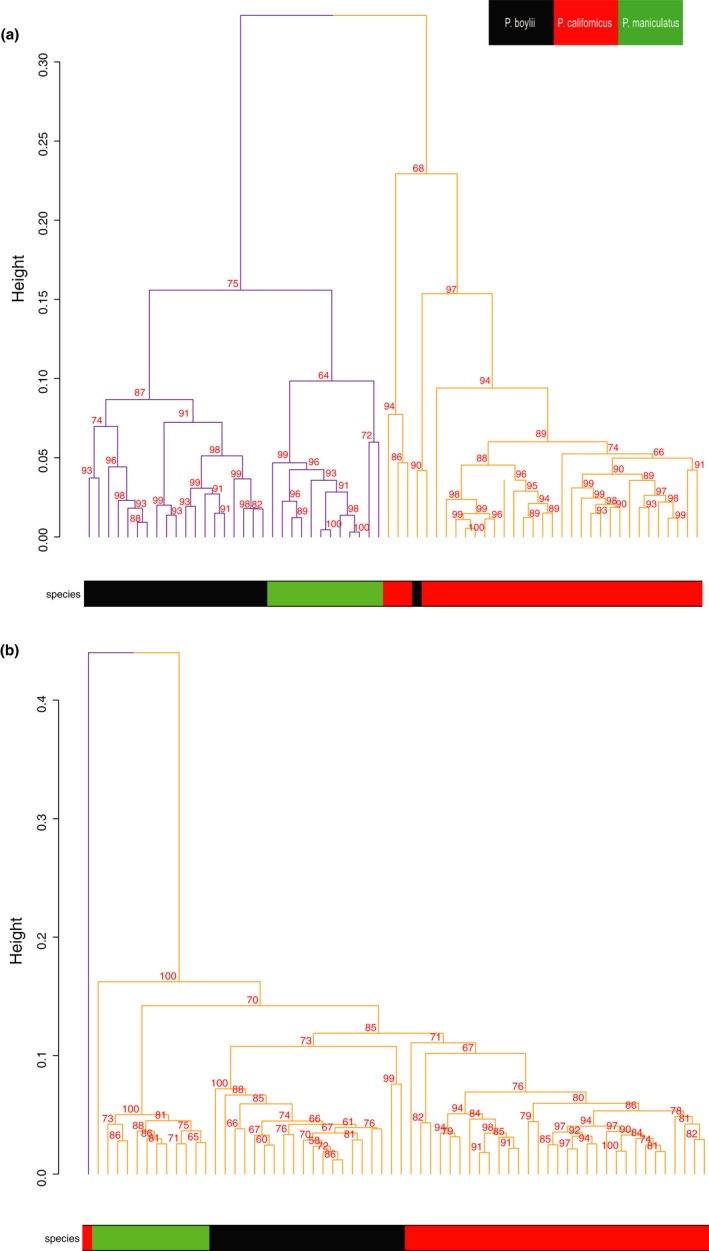
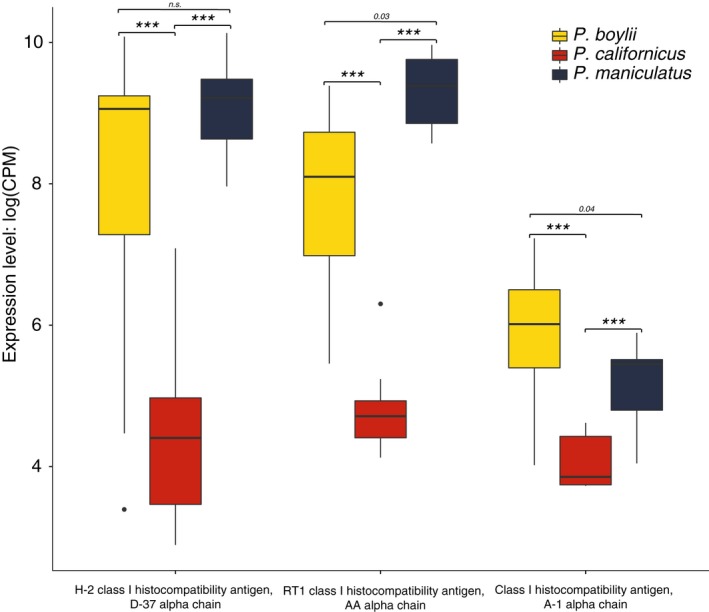
Behaviors that increase an individual's exposure to pathogens are expected to have important effects on immunoactivity. Because sexual reproduction typically requires close contact among conspecifics, mating systems provide an ideal opportunity to study the immunogenetic correlates of behaviors with high versus low risks of pathogen exposure. Despite logical links between polygynandrous mating behavior, increased pathogen exposure, and greater immunoactivity, these relationships have seldom been examined in nonhuman vertebrates. To explore interactions among these variables in a different lineage of mammals, we used RNAseq to study the gene expression profiles of liver tissue-a highly immunoactive organ-from sympatric populations of the monogamous California mouse (Peromyscus californicus) and two polygynandrous congeners (P. maniculatus and P. boylii). Differential expression and co-expression analyses revealed distinct patterns of gene activity among species, with much of this variation associated with differences in mating system. This tendency was particularly pronounced for MHC genes, with multiple MHC Class I genes being upregulated in the two polygynandrous species, as expected if exposure to sexually transmitted pathogens varies with mating system. Our results underscore the role of mating behavior in influencing patterns of gene expression and highlight the use of emerging transcriptomic tools in behavioral studies of free-living animals.

Keywords: gene expression; mating systems; monogamy; peromyscus; promiscuity; transcriptomics.


Figures

Figure 1
Figure 1
Field site localities in California and sampling regimes for the three species of Peromyscus examined. For each sampling locality, the species present are indicated, as is the number of adults sampled. Northern and southern sampling localities are indicated; coastal (orange) versus inland (green) localities are also identified
Figure 2
Figure 2
Hierarchical clustering of genes by expression profiles. Similarities in expression profiles for 14,624 genes were assessed via weighted correlation network analysis (WGCNA). Along the x‐axis, each terminal twig represents a distinct locus. For each locus, the y‐axis indicates the degree of similarity in expression across all samples examined; similarity was assessed using a topological overlap measure, with values approaching 0 indicating greater similarity in expression across samples. Loci were assigned to color‐coded modules based on similarities in gene expression, with genes that could not be assigned to any module placed in the gray cluster. A list of these color‐coded modules and the number of loci contained in each are provided at the right
Figure 3
Figure 3
Relationships between gene expression and selected attributes of the animals sampled. Gene modules are indicated to the left of the table. Cells contain Pearson correlation coefficients between a module eigengene (first principal component for each gene module) and each of four potential predictors of gene expression; each predictor is identified at the bottom of the table; and the p‐value for each correlation is also shown. Red cells denote positive correlations, white cells denote no significant correlations, and blue cells denote negative correlations; color intensity denotes the relative strength of the correlation; and the scale for associated correlation coefficients is shown at right. Significant correlations (p < 0.05) are outlined with a black box
Figure 4
Figure 4
Relationships between gene expression and mating system. In (a), gene modules (MEs) are hierarchically clustered based on similarities in patterns of expression for the genes in each module; for the mating system variable, gene expression was assessed for the monogamous versus the polygynandrous study species. The y‐axis depicts the network distance between modules, with values closer to 0 indicating greater similarity between expression patterns in modules. In (b), a matrix of pairwise comparisons of module eigengene adjacency (connection strength), including the trait mating system (MS), is shown. Red cells denote high adjacency (positive Pearson correlations) between modules while blue cells denote low adjacency (negative correlations); white cells denote no significant correlation between modules. Color intensity denotes the relative strength of the correlation, as indicated in the color scale bar to the right
Figure 5
Figure 5
Relationships between gene significance for mating system and module membership for each of the 687 loci included in the brown gene module. Module membership (x‐axis) is a measure of how correlated the level of expression of each gene is with the module to which that gene was assigned; in this case the brown module. Gene significance (y‐axis) is a measure of how correlated each gene is with mating system; a gene significance of 0 would indicate that the gene is not significant with regard to mating system. Together, these measurements indicate that genes in the brown module are also correlated with mating system
Figure 6
Figure 6
Differentiation of the study taxa based on patterns of gene expression. Data are from constrained correspondence analysis of normalized values of gene expression for each species with mating system included as the constraint. Each point represents an individual mouse (N = 64). The x‐axis shows the total amount of variation we can explain with mating system
Figure 7
Figure 7
Comparisons of gene expression levels for (a) MHC loci (N = 39) and (b) all genes examined (N = 14,624). Measures of expression are TMM‐normalized logCPM (log counts per million); the scale for expression counts is shown in the upper left corner. In both panels, the x‐axis is a dendrogram that clusters expression data by similarity between individuals; color coding for species is shown in the upper left. The y‐axis clusters genes by similarities in expression profiles. The three loci showing increased expression in the polygynandrous species—relative to monogamous species—are indicated with asterisks at the bottom left of panel A. Gene descriptions for the numbered genes in panel A can be found in Table S2 of the supporting information Appendix S1
Figure 8
Figure 8
Hierarchical cluster dendrogram of individuals based on (a) MHC gene expression and (b) liver transcriptome expression. Approximately unbiased (AU) p‐values (%) are provided for each node. AU p‐values are calculated via multiscale bootstrap resampling (10,000 iterations), and an AU p‐value over 95% indicates cluster support at a 0.05 significance level. Distinct clusters are shown with different colors. The y‐axis measures the distance between the clusters as “height.” Species are indicated using a colored bar on the x‐axis, and a legend is provided in the top right corner
Figure 9
Figure 9
Box plot of expression levels as logCPM (log counts per million)—transcript counts per million—for the three most differentially expressed MHC genes. Kruskal–Wallis tests for each gene were significant p < 0.001, with Peromyscus maniculatus and Peromyscus boylii displaying significantly higher expression levels relative to Peromyscus californicus for all three genes (Dunn's Test; all p < 0.001, holm corrected)

Similar articles

Cited by

References

    1. Aljanabi, S. M. , & Martinez, I. (1997). Universal and rapid salt‐extraction of high quality genomic DNA for PCR‐based techniques. Nucleic Acids Research, 25(22), 4692–4693. 10.1093/nar/25.22.4692 - DOI - PMC - PubMed
    1. Barabási, A.‐L. , & Bonabeau, E. (2003). Scale‐free networks. Scientific American, 288(5), 60–69. 10.1038/scientificamerican0503-60 - DOI - PubMed
    1. Bengston, S. E. , Dahan, R. A. , Donaldson, Z. , Phelps, S. M. , van Oers, K. , Sih, A. , & Bell, A. M. (2018). Genomic tools for behavioural ecologists to understand repeatable individual differences in behaviour. Nature Ecology & Evolution, 2(6), 944–955. 10.1038/s41559-017-0411-4 - DOI - PMC - PubMed
    1. Bessa‐Gomes, C. , Legendre, S. , & Clobert, J. (2004). Allee effects, mating systems and the extinction risk in populations with two sexes: Allee effects, mating systems and the extinction risk. Ecology Letters, 7(9), 802–812. 10.1111/j.1461-0248.2004.00632.x - DOI
    1. Bi, K. , Vanderpool, D. , Singhal, S. , Linderoth, T. , Moritz, C. , & Good, J. M. (2012). Transcriptome‐based exon capture enables highly cost‐effective comparative genomic data collection at moderate evolutionary scales. BMC Genomics, 13(1), 403 10.1186/1471-2164-13-403 - DOI - PMC - PubMed