. 2020 Mar 1;112(3):247-255.
doi: 10.1093/jnci/djz112.

Temporal Stability and Prognostic Biomarker Potential of the Prostate Cancer Urine miRNA Transcriptome

Affiliations

Temporal Stability and Prognostic Biomarker Potential of the Prostate Cancer Urine miRNA Transcriptome

Jouhyun Jeon et al. J Natl Cancer Inst. .

Abstract

Background: The development of noninvasive tests for the early detection of aggressive prostate tumors is a major unmet clinical need. miRNAs are promising noninvasive biomarkers: they play essential roles in tumorigenesis, are stable under diverse analytical conditions, and can be detected in body fluids.

Methods: We measured the longitudinal stability of 673 miRNAs by collecting serial urine samples from 10 patients with localized prostate cancer. We then measured temporally stable miRNAs in an independent training cohort (n = 99) and created a biomarker predictive of Gleason grade using machine-learning techniques. Finally, we validated this biomarker in an independent validation cohort (n = 40).

Results: We found that each individual has a specific urine miRNA fingerprint. These fingerprints are temporally stable and associated with specific biological functions. We identified seven miRNAs that were stable over time within individual patients and integrated them with machine-learning techniques to create a novel biomarker for prostate cancer that overcomes interindividual variability. Our urine biomarker robustly identified high-risk patients and achieved similar accuracy as tissue-based prognostic markers (area under the receiver operating characteristic = 0.72, 95% confidence interval = 0.69 to 0.76 in the training cohort, and area under the receiver operating characteristic curve = 0.74, 95% confidence interval = 0.55 to 0.92 in the validation cohort).

Conclusions: These data highlight the importance of quantifying intra- and intertumoral heterogeneity in biomarker development. This noninvasive biomarker may usefully supplement invasive or expensive radiologic- and tissue-based assays.


Figures

Figure 1.
Figure 1.
Digital rectal examination (DRE)-urine microRNA (miRNA) transcriptome profile. A) Overview of analysis of urine miRNA abundance variance in 10 prostate cancer patients. B) Parameter selection to optimize miRNA abundance. NanoString nCounter technology was used for miRNA abundance profiling. Similarity (ρ) represents miRNA profile similarity between two control samples. Misinterpreted samples indicate the fraction of samples with failed normalization. The similarity between control samples is likely to be increased when there are more misinterpreted samples. Because samples are misinterpreted when less than 10% of assayed miRNAs are detected after normalization, this correlation could be an inevitable effect of small size of detected miRNAs to calculate a similarity. To mitigate this effect, we only considered parameters that show high similarity between controls and zero misinterpreted samples (arrow). C) Normalized miRNA transcriptome profile. Bars (top) represent the number of detected miRNAs in patient urine and control samples, respectively. Bars (right) represent the number of samples a given miRNA is detected in (normalized transcript count > 0).
Figure 2.
Figure 2.
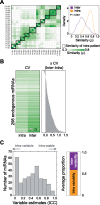
Intra- and interindividual variance of miRNA abundance. A) Global similarity of miRNA transcriptome. Distribution of correlation coefficient (ρ) of intra- and interindividual patients were compared using two-sided Wilcoxon test. B) Coefficient of variations (CVs) of 298 microRNAs (miRNAs) (left) and their differences between intra- and interindividual (right). C) The distribution of estimated variability of 298 miRNA abundances. Intra- and intervariability are estimated using intraclass correlation coefficient (ICC). Bar graph (right) shows the average proportion of intraindividual variability and interindividual variability of miRNA abundance.
Figure 3.
Figure 3.
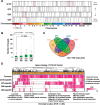
Biological properties of microRNAs (miRNAs) and their target genes. A) Chromosomal positions of assayed miRNAs. miRNAs are divided into four variable groups depending on intraclass correlation coefficient (ICC) (Q25, Q50, Q75, and Q100). Dashed red boxes indicate enriched chromosomes in a given variable group (q < 0.1). Q25 and Q100 represent miRNAs that are most and least variable within individuals, respectively. B) Number of target genes in variable groups. The number in parentheses under each variable group represents the total number of miRNAs that have known target genes. Two-sided Wilcoxon test was used to measure the statistically significant difference of the number of target genes of intrastable (Q100) and intravariable (Q25) miRNAs. C) Overlapped target genes among variable groups. D) Enriched biological functions of target genes in variable groups. In total, 1215 gene ontology (GO) terms showing q < 0.25 in at least one variable group are colored. Common indicates targets that are regulated by all four variable groups. Full GO terms and their enriched scores are in Supplementary Table 5 (available online). FDR = false discovery rate.
Figure 4.
Figure 4.
A predictive model distinguishes prostate cancer risk groups. A) Design of the machine-learning–based predictive model to classify two risk groups (high- and low-risk). B) The performance of predictive model in a training cohort (n = 99). Bold line indicates mean AUC of 10 times repeated fivefold cross-validation. Shadow indicates all cross-validated AUCs. C) The performance of predictive model in a validation cohort (n = 40). Receiver operating characteristic (ROC) curves of intrastable, intravariable, and randomly selected microRNA (miRNA) signatures are compared. D) AUC distribution of random models. In total, 10 000 random models were generated and their AUCs calculated. Dashed vertical lines represent AUCs of intrastable, intravariable, and randomly selected miRNA signatures (median AUC of random models). The intrastable signature has performance exceeding most randomly generated models. CI = confidence interval.

Comment in

References

    1. Siegel R, Naishadham D, Jemal A.. Cancer statistics, 2013. CA Cancer J Clin. 2013;63(1):11–30. - PubMed
    1. Musunuru HB, Yamamoto T, Klotz L, et al. Active surveillance for intermediate risk prostate cancer: survival outcomes in the Sunnybrook experience. J Urol. 2016;196(6):1651–1658. - PubMed
    1. Troyer DA, Mubiru J, Leach RJ, et al. Promise and challenge: markers of prostate cancer detection, diagnosis and prognosis. Dis Markers. 2004;20(2):117–128. - PMC - PubMed
    1. Loeb S, Vellekoop A, Ahmed HU, et al. Systematic review of complications of prostate biopsy. Eur Urol. 2013;64(6):876–892. - PubMed
    1. Cooper CS, Eeles R, Wedge DC, et al. Analysis of the genetic phylogeny of multifocal prostate cancer identifies multiple independent clonal expansions in neoplastic and morphologically normal prostate tissue. Nat Genet. 2015;47(4):367–372. - PMC - PubMed

Publication types