

Abnormal blood lactate accumulation during repeated exercise testing in myalgic encephalomyelitis/chronic fatigue syndrome
- PMID: 31161646
- PMCID: PMC6546966
- DOI: 10.14814/phy2.14138
Abnormal blood lactate accumulation during repeated exercise testing in myalgic encephalomyelitis/chronic fatigue syndrome
Abstract
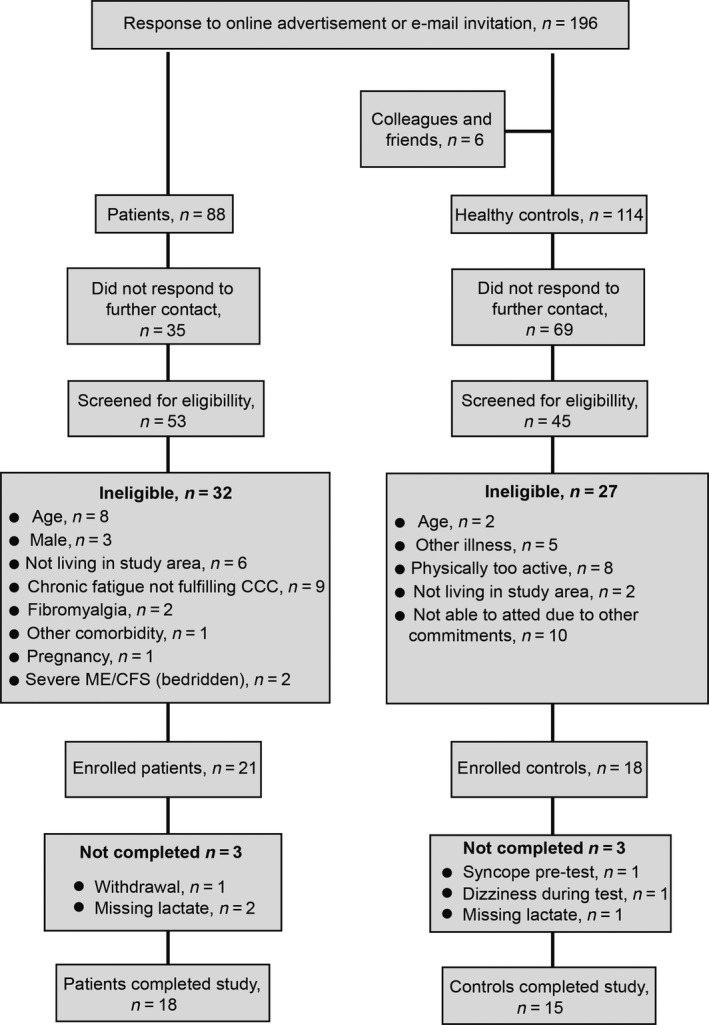
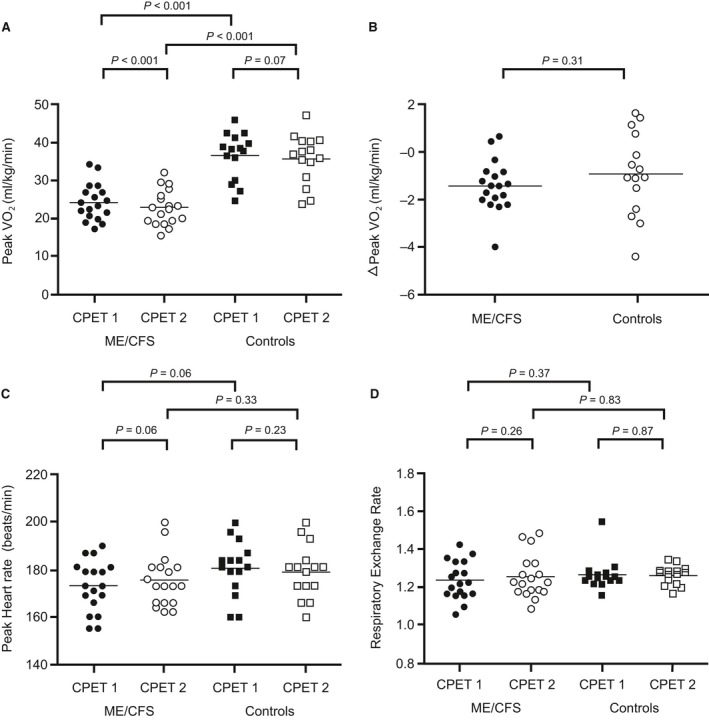
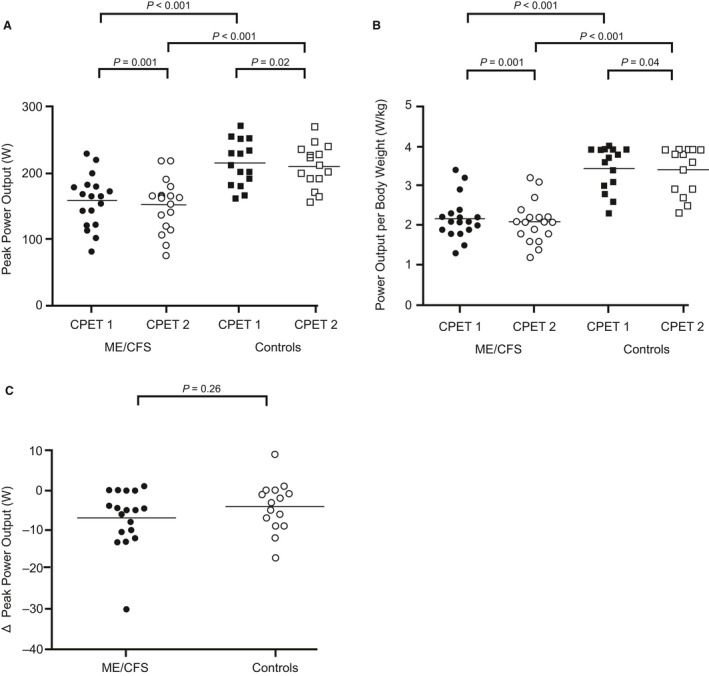
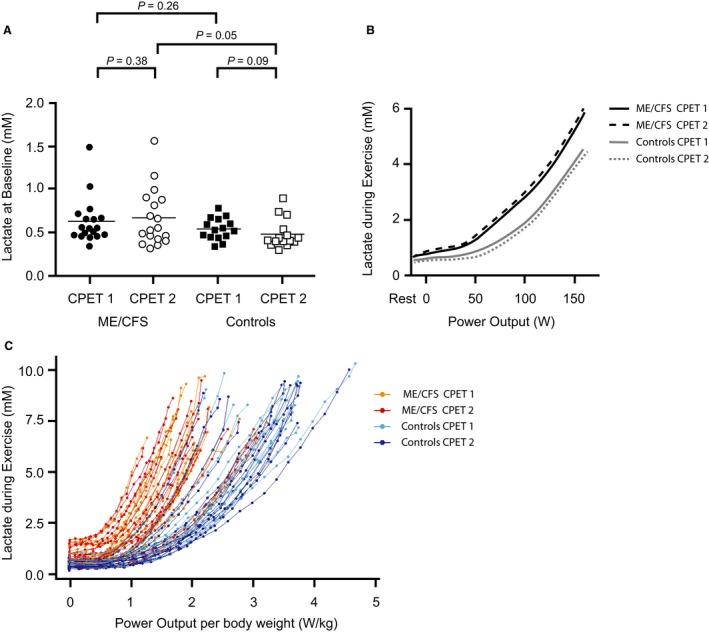
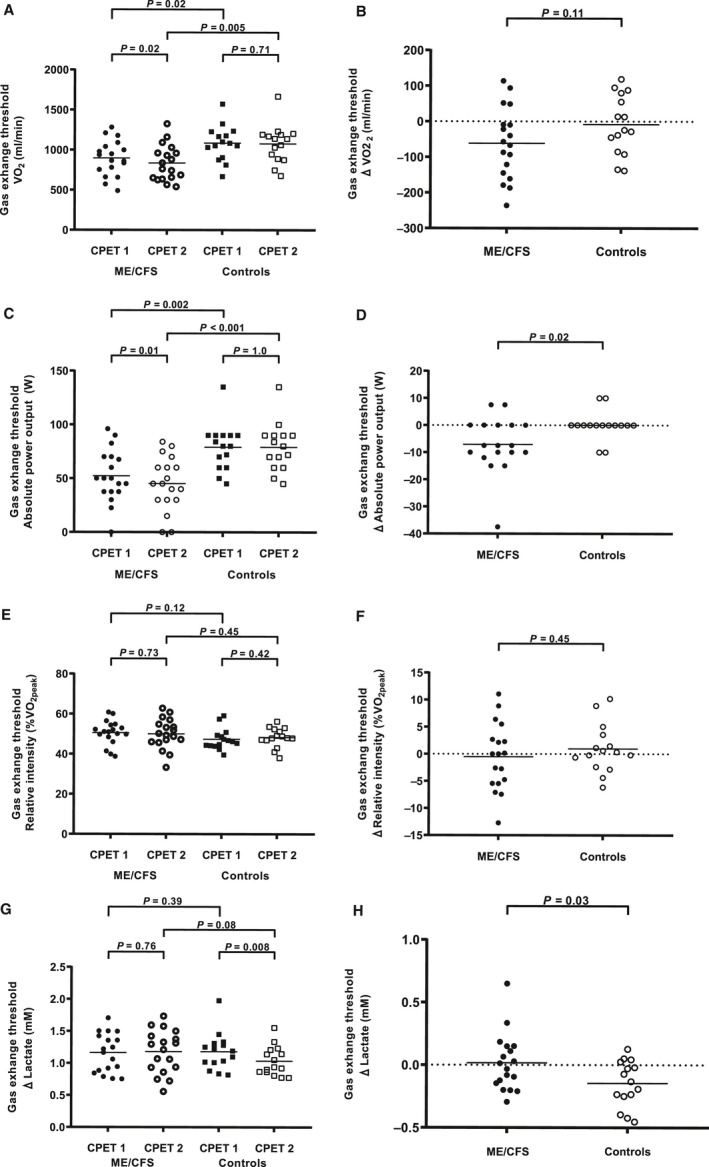
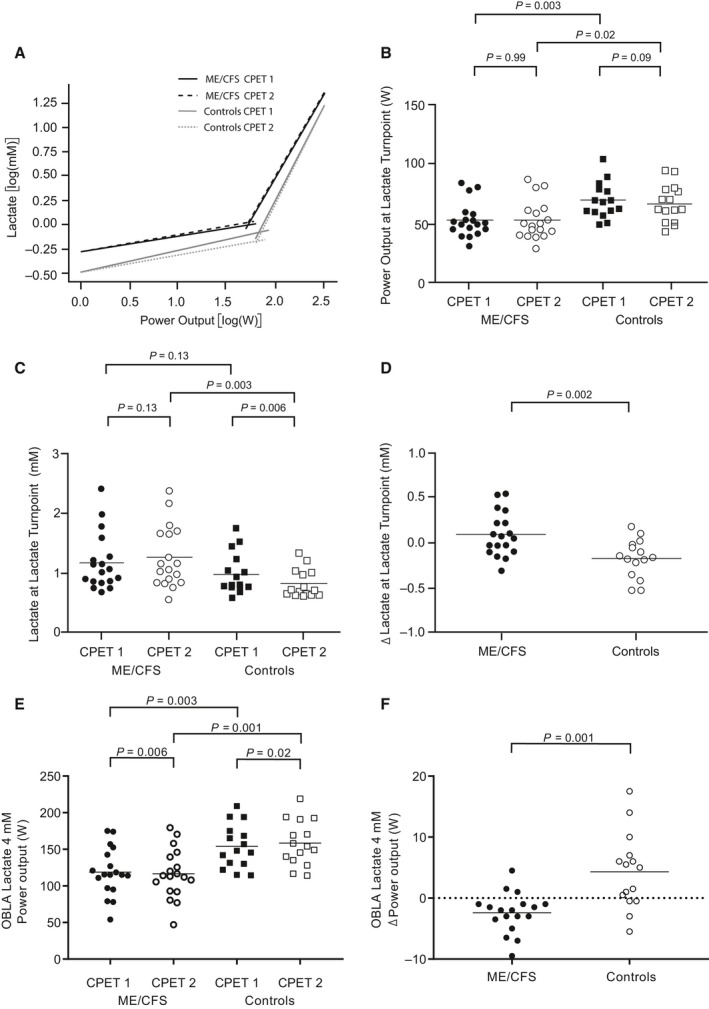
Post-exertional malaise and delayed recovery are hallmark symptoms of myalgic encephalomyelitis/chronic fatigue syndrome (ME/CFS). Studies on repeated cardiopulmonary exercise testing (CPET) show that previous exercise negatively affects oxygen uptake (VO2 ) and power output (PO) in ME/CFS. Whether this affects arterial lactate concentrations ([Laa ]) is unknown. We studied 18 female patients (18-50 years) fulfilling the Canadian Consensus Criteria for ME/CFS and 15 healthy females (18-50 years) who underwent repeated CPETs 24 h apart (CPET1 and CPET2 ) with [Laa ] measured every 30th second. VO2 at peak exercise (VO2peak ) was lower in patients than in controls on CPET1 (P < 0.001) and decreased in patients on CPET2 (P < 0.001). However, the difference in VO2peak between CPETs did not differ significantly between groups. [Laa ] per PO was higher in patients during both CPETs (Pinteraction < 0.001), but increased in patients and decreased in controls from CPET1 to CPET2 (Pinteraction < 0.001). Patients had lower VO2 (P = 0.02) and PO (P = 0.002) at the gas exchange threshold (GET, the point where CO2 production increases relative to VO2 ), but relative intensity (%VO2peak ) and [Laa ] at GET did not differ significantly from controls on CPET1 . Patients had a reduction in VO2 (P = 0.02) and PO (P = 0.01) at GET on CPET2 , but no significant differences in %VO2peak and [Laa ] at GET between CPETs. Controls had no significant differences in VO2 , PO or %VO2peak at GET between CPETs, but [Laa ] at GET was reduced on CPET2 (P = 0.008). In conclusion, previous exercise deteriorates physical performance and increases [Laa ] during exercise in patients with ME/CFS while it lowers [Laa ] in healthy subjects.
Keywords: Elevated lactate; exercise intolerance; metabolism; oxygen uptake; post-exertional malaise.
© 2019 The Authors. Physiological Reports published by Wiley Periodicals, Inc. on behalf of The Physiological Society and the American Physiological Society.
Conflict of interest statement
None declared.
Figures
References
-
- Agostoni, P. , Salvioni E., Debenedetti C., Vignati C., Cattadori G., Contini M., et al. 2010. Relationship of resting hemoglobin concentration to peak oxygen uptake in heart failure patients. Am. J. Hematol. 85:414–417. - PubMed
-
- Arena, R. , Myers J., Williams M. A., Gulati M., Kligfield P., Balady G. J., et al. 2007. Assessment of functional capacity in clinical and research settings: a scientific statement from the American Heart Association Committee on Exercise, Rehabilitation, and Prevention of the Council on Clinical Cardiology and the Council on Cardiovascular Nursing. Circulation 116:329–343. - PubMed
-
- ATS/ACCP Statement on cardiopulmonary exercise testing . 2003. Am. J. Respir. Crit. Care Med. 167:211–277. - PubMed
-
- Beaver, W. L. , Wasserman K., and Whipp B. J.. 1985. Improved detection of lactate threshold during exercise using a log‐log transformation. J. Appl. Physiol. 59:1936–1940. - PubMed
-
- Bergman, B. C. , Wolfel E. E., Butterfield G. E., Lopaschuk G. D., Casazza G. A., Horning M. A., et al. 1999. Active muscle and whole body lactate kinetics after endurance training in men. J. Appl. Physiol. 87:1684–1696. - PubMed
Publication types
MeSH terms
Substances
LinkOut - more resources
Full Text Sources
Medical
