. 2019 Jun;7(11):e14101.
doi: 10.14814/phy2.14101.

Beta-cell excitability and excitability-driven diabetes in adult Zebrafish islets

Affiliations

Beta-cell excitability and excitability-driven diabetes in adult Zebrafish islets

Christopher H Emfinger et al. Physiol Rep. 2019 Jun.

Abstract

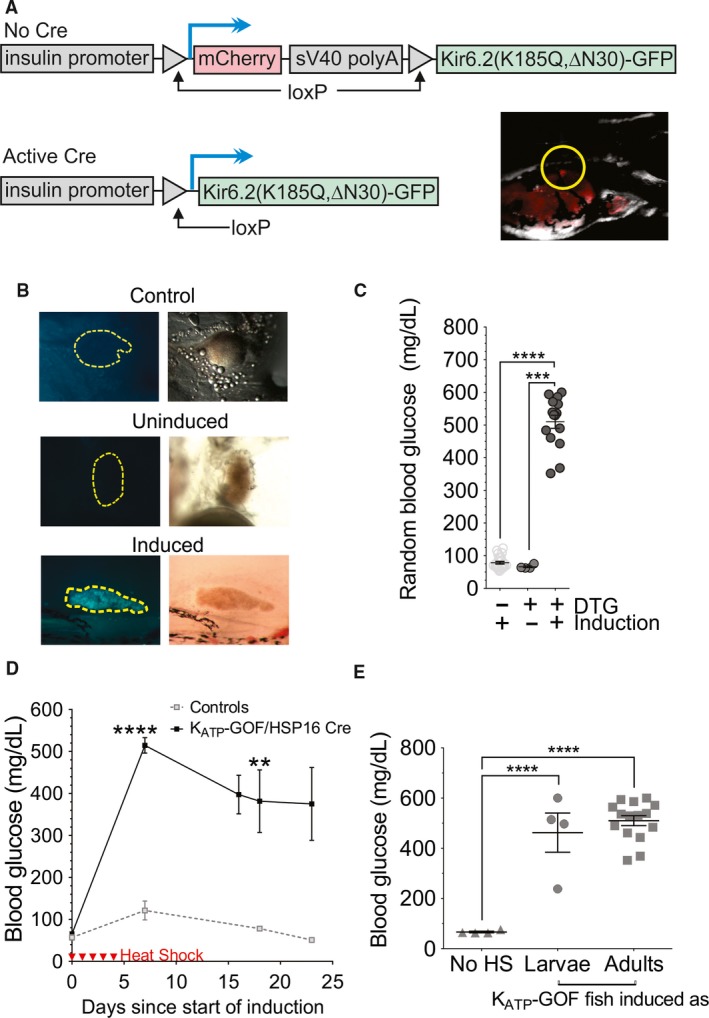
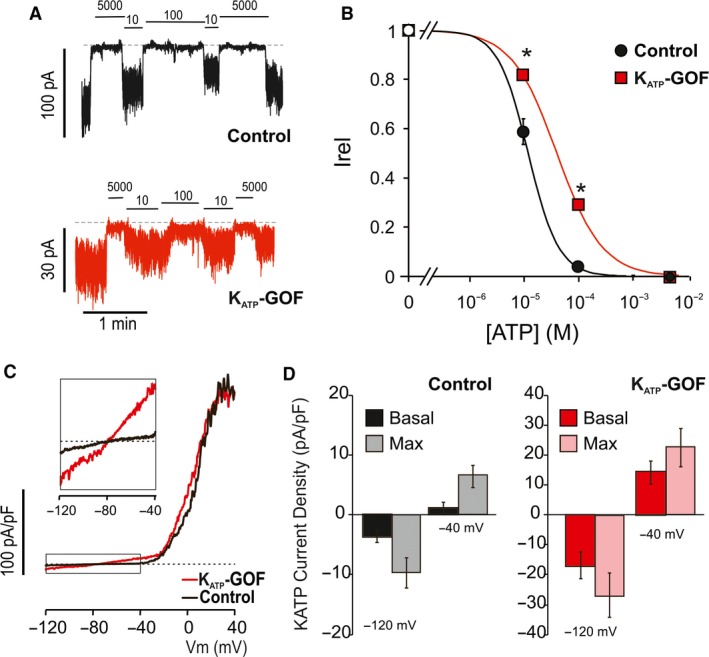
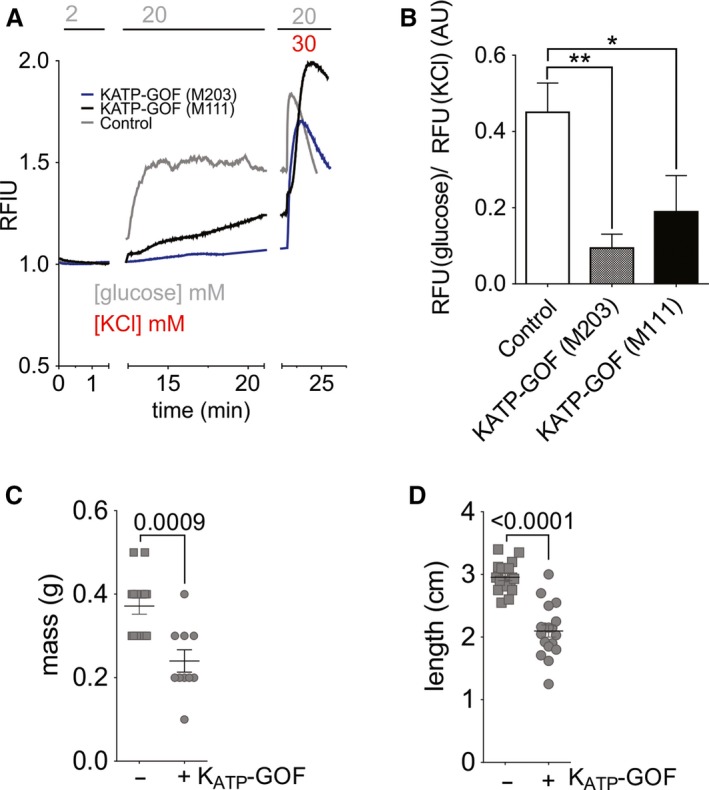
Islet β-cell membrane excitability is a well-established regulator of mammalian insulin secretion, and defects in β-cell excitability are linked to multiple forms of diabetes. Evolutionary conservation of islet excitability in lower organisms is largely unexplored. Here we show that adult zebrafish islet calcium levels rise in response to elevated extracellular [glucose], with similar concentration-response relationship to mammalian β-cells. However, zebrafish islet calcium transients are nor well coupled, with a shallower glucose-dependence of cytoplasmic calcium concentration. We have also generated transgenic zebrafish that conditionally express gain-of-function mutations in ATP-sensitive K+ channels (KATP -GOF) in β-cells. Following induction, these fish become profoundly diabetic, paralleling features of mammalian diabetes resulting from equivalent mutations. KATP -GOF fish become severely hyperglycemic, with slowed growth, and their islets lose glucose-induced calcium responses. These results indicate that, although lacking tight cell-cell coupling of intracellular Ca2+ , adult zebrafish islets recapitulate similar excitability-driven β-cell glucose responsiveness to those in mammals, and exhibit profound susceptibility to diabetes as a result of inexcitability. While illustrating evolutionary conservation of islet excitability in lower vertebrates, these results also provide important validation of zebrafish as a suitable animal model in which to identify modulators of islet excitability and diabetes.

Keywords: KATP; Calcium channels; insulin secretion; metabolism; pancreas; zebrafish.


Conflict of interest statement

None.

Figures

Figure 1
Figure 1
l‐type Ca currents in zebrafish β‐cells. (A) Representative recordings of whole‐cell Ca2+ currents (top) in response to voltage steps (bottom) from −45 mV holding potential to −45 to + 65mV are inhibited by (10 μmol/L) nifedipine (right). Gray line in upper panels indicates 0 pA. (B) Summary of current–voltage relationship for calcium currents in isolated zebrafish β‐cells (14 total primary (1°) and 2 secondary (2°) islet cells).
Figure 2
Figure 2
Intracellular [Ca2+] in adult islets is glucose‐sensitive. (A, left) Islets were imaged in microchambers (~4 μL) cored out of agar, on the bottom of a petri dish. Flow of bulk solution into and out of the dish (~1 mL) was controlled as indicated. (right) GCaMP fluorescence and anti‐insulin staining in representative islet, together with overlay (GCamp fluorescence green, anti‐insulin red). (B) Individual frames of islets at low (2 mmol/L) and high (20 mmol/L) glucose (middle), and in 20 mmol/L glucose plus 30 mmol/L KCl (right). (C) Representative fluorescence traces from individual islets, normalized to initial fluorescence (relative fluorescence units, RFU), during transitions from low glucose to 20 mmol/L d‐ or l‐glucose, and 20 mmol/L glucose plus 30 mmol/L KCl, in absence or presence of diazoxide, as indicated. (D) Summary of calcium responses to high 2 or 20 mmol/L d‐ or l‐glucose, or 20 glucose plus 30 mmol/L KCl, in absence or presence of diazoxide, as indicated from experiments as in C (N = 6–10 in each case). (**) P < 0.05.
Figure 3
Figure 3
Glucose‐ and amino acid‐sensitivity of intracellular [Ca2+]. (A) Summary of [glucose]‐GCamp fluorescence response relationship from experiments as in Figure 1, with peak fluorescence at the indicated glucose concentrations normalized to the maximum fluorescence elicited by KCl depolarization (N = 8–17 islets/concentration). (B) Representative trace showing islet treated with 20 mmol/L glucose in presence of 10 μmol/L nifedipine. (C) Summary of calcium responses to high (20 mmol/L) glucose in absence (N = 8) or presence of nifedipine (N = 10). (*) P < 0.05. (D) Calcium responses to 8 mmol/L glucose in absence or presence of additional amino acids (normalized to maximum fluorescence in KCl. (E) Representative trace for islet calcium responses to sucrose (20 mmol/L).
Figure 4
Figure 4
Ca2+ transients are not well‐coupled between β‐cells in Zebrafish islets. (A) Fluorescence response to switch from 2, to 12, to 20 mmol/L glucose and then KCl. Individual ROI traces are shown for 87 tracked cells from a representative islet, plus averaged trace from the whole islet (red). Some cells (blue) were active at basal (2 mmol/L) glucose. Others activated at 12 mmol/L glucose (green) or only at 20 mmol/L glucose (orange). (B) Representative individual traces from the early 12 mmol/L transition from islet in (A). (C) Cross‐correlation matrix (determined by PeakCaller) of all 87 tracked cells in (A). (D) Representative PCR of Cx35b cDNAs from islets, brains, and hearts of zebrafish. Sets a and b are different pools of islets (biological replicates). (E) Western blot analysis of zebrafish Cx35 protein. Cx35 is detected in zebrafish brain but not in zebrafish islets.
Figure 5
Figure 5
Islet KATP‐GOF results in profound diabetes. (A) Transgenic strategy for conditional KATP‐GOF expression in zebrafish islet. mCherry, expressed under insulin promoter control (upper panel), is excised and KATP‐GOF construct is expressed, after (lower left panel) Cre recombination. A F2 larva is shown in the right lower panel, with the islet highlighted in the yellow circle. (B) GFP (left column) and bright‐field (right column) images of dissected islets from adult control, uninduced KATP‐GOF and induced KATP‐GOF fish (images taken at 12 × ). (C) Random blood glucose levels in controls (N = 25), uninduced (N = 15), and induced (5 days heat‐shock, N = 24) KATP‐GOF zebrafish. In control and induced fish, blood glucose were measured 2 days after the last heat shock. (D) Time course of change in blood glucose following KATP‐GOF induction. (E) Glucose levels in adult (10 week old) KATP‐GOF fish are similarly elevated, whether induced as larvae (N = 4), or as adults (N = 15).
Figure 6
Figure 6
Islet KATP‐GOF expression results in basal KATP and ATP‐insensitive channels. (A) Representative excised inside‐out patch‐clamp recordings (at −50 mV) from β‐cells isolated from control (black) or KATP‐GOF (red) islets, in the presence of ATP at concentrations (in micromolar) as indicated. (B) Steady‐state dependence of membrane current on [ATP] (relative to current in zero ATP (Irel)) for control and KATP‐GOF channels. Data points represent the mean ± SEM. (n = 4 patches in each case). The fitted lines correspond to least squares fits of a Hill equation (see Methods). (*) P < 0.01 compared to wild‐type KATP (controls) by unpaired Student's t test. (C) In whole‐cell mode basal conditions, voltage‐clamp ramps from −120 to −40 mV (over 1 sec) activates similar Kv currents above −20 mV in both KATP‐GOF and control cell. However, basal KATP channel activation is evident in KATP‐GOF cells as additional ~linear current reversing at −80 mV (boxed current is amplified in insert). (D) Averaged basal currents at −120 and −40 mV from experiments as in C (n = 5 control cells, n = 7 KATP‐GOF cells).
Figure 7
Figure 7
KATP‐GOF inhibits glucose‐dependent Ca and causes secondary diabetic complications. (A) Representative recording of intracellular calcium response to switch from 2 to 20 mmol/L glucose in control (gCAMP6s only) and KATP‐GOF/gCAMP6s islets from two different founder lineages (M203, M111). (B) Average calcium response to 20 mmol/L glucose from control (n = 8) and two different founder lineages (M203, n = 8 and M111, n = 7) of KATP‐GOF/gCAMP6s fish, normalized to absolute calcium response to depolarization in KCl. (C) Body mass (N = 10–14) and (D) body length (N = 18) in KATP‐GOF (+) and control (−) fish that were induced as larvae. B, C, and D are analyzed by 1‐way ANOVA followed by Tukey's post‐tests. (*) P < 0.05, (**) P < 0.01.

References

    1. Antunes, C. M. , Salgado A. P., Rosário L. M., and Santos R. M.. 2000. Differential patterns of glucose‐induced electrical activity and intracellular calcium responses in single mouse and rat pancreatic islets. Diabetes 49:2028–2038. - PubMed
    1. Argenton, F. , Zecchin E., and Bortolussi M.. 1999. Early appearance of pancreatic hormone‐expressing cells in the zebrafish embryo. Mech. Dev. 87:217–221. - PubMed
    1. Artimovich, E. , Jackson R. K., Kilander M. B. C., Lin Y.‐C., and Nestor M. W.. 2017. PeakCaller: an automated graphical interface for the quantification of intracellular calcium obtained by high‐content screening. BMC Neurosci. 18:72. - PMC - PubMed
    1. Bavamian, S. , Klee P., Britan A., Populaire C., Caille D., Cancela J., et al. 2007. Islet‐cell‐to‐cell communication as basis for normal insulin secretion. Diabetes Obes. Metab. 9(Suppl 2):118–132. - PubMed
    1. Benninger, R. K. , Zhang M., Head W. S., Satin L. S., and Piston D. W.. 2008. Gap junction coupling and calcium waves in the pancreatic islet. Biophys. J . 95:5048–5061. - PMC - PubMed

Publication types

MeSH terms

LinkOut - more resources