. 2019 Oct 1;200(7):837-856.
doi: 10.1164/rccm.201811-2221OC.

BAL Cell Gene Expression in Severe Asthma Reveals Mechanisms of Severe Disease and Influences of Medications

Affiliations

BAL Cell Gene Expression in Severe Asthma Reveals Mechanisms of Severe Disease and Influences of Medications

Nathaniel Weathington et al. Am J Respir Crit Care Med. .

Abstract

Rationale: Gene expression of BAL cells, which samples the cellular milieu within the lower respiratory tract, has not been well studied in severe asthma.Objectives: To identify new biomolecular mechanisms underlying severe asthma by an unbiased, detailed interrogation of global gene expression.Methods: BAL cell expression was profiled in 154 asthma and control subjects. Of these participants, 100 had accompanying airway epithelial cell gene expression. BAL cell expression profiles were related to participant (age, sex, race, and medication) and sample traits (cell proportions), and then severity-related gene expression determined by correlating transcripts and coexpression networks to lung function, emergency department visits or hospitalizations in the last year, medication use, and quality-of-life scores.Measurements and Main Results: Age, sex, race, cell proportions, and medications strongly influenced BAL cell gene expression, but leading severity-related genes could be determined by carefully identifying and accounting for these influences. A BAL cell expression network enriched for cAMP signaling components most differentiated subjects with severe asthma from other subjects. Subsequently, an in vitro cellular model showed this phenomenon was likely caused by a robust upregulation in cAMP-related expression in nonsevere and β-agonist-naive subjects given a β-agonist before cell collection. Interestingly, ELISAs performed on BAL lysates showed protein levels may partly disagree with expression changes.Conclusions: Gene expression in BAL cells is influenced by factors seldomly considered. Notably, β-agonist exposure likely had a strong and immediate impact on cellular gene expression, which may not translate to important disease mechanisms or necessarily match protein levels. Leading severity-related genes were discovered in an unbiased, system-wide analysis, revealing new targets that map to asthma susceptibility loci.

Keywords: asthma; bronchoalveolar lavage; gene expression; genetics; β-agonist.


Figures
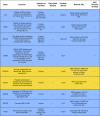
Figure 1.
Figure 1.
Asthma severity gene set. BAL cell genes were correlated with clinical traits indicative of more severe disease (including low asthma quality-of-life questionnaires scores, low FEV1, high bronchodilator response, oral and high-dose inhaled steroid use, high β-agonist use, high emergency department or hospitalization in the past year), and ranked according to their P value significance to these traits. Blue colored rows indicate genes that are inversely correlated or associated with clinical measures of worsening disease severity, whereas yellow colored rows indicate genes that are positively correlated or associated with these clinical measures. AEC = airway epithelial cell; ASL = asthma susceptibility locus; BDR = bronchodilator response; COPD = chronic obstructive pulmonary disease; Dx-Sev = a diagnosis of severe asthma as defined by the European Respiratory Society/American Thoracic Society Task Force definition; ED/Hosp = emergency department visits or hospitalizations in the past year; GABRIEL = A Multidisciplinary Study to Identify the Genetic and Environmental Causes of Asthma in the European Community; GS = glucocorticosteroid; GWAS = genome-wide association study; MAP = mitogen-activated protein; MCP = monocyte chemoattractant protein; MMP = matrix metalloprotinase; NAD = nicotinamide adenine dinucleotide; PDE = phosphdiesterase; PKA = protein kinase A; ROS = reactive oxygen species; SPT = skin prick test; Treg = T regulatory cell.
Figure 1.
Figure 1.
Asthma severity gene set. BAL cell genes were correlated with clinical traits indicative of more severe disease (including low asthma quality-of-life questionnaires scores, low FEV1, high bronchodilator response, oral and high-dose inhaled steroid use, high β-agonist use, high emergency department or hospitalization in the past year), and ranked according to their P value significance to these traits. Blue colored rows indicate genes that are inversely correlated or associated with clinical measures of worsening disease severity, whereas yellow colored rows indicate genes that are positively correlated or associated with these clinical measures. AEC = airway epithelial cell; ASL = asthma susceptibility locus; BDR = bronchodilator response; COPD = chronic obstructive pulmonary disease; Dx-Sev = a diagnosis of severe asthma as defined by the European Respiratory Society/American Thoracic Society Task Force definition; ED/Hosp = emergency department visits or hospitalizations in the past year; GABRIEL = A Multidisciplinary Study to Identify the Genetic and Environmental Causes of Asthma in the European Community; GS = glucocorticosteroid; GWAS = genome-wide association study; MAP = mitogen-activated protein; MCP = monocyte chemoattractant protein; MMP = matrix metalloprotinase; NAD = nicotinamide adenine dinucleotide; PDE = phosphdiesterase; PKA = protein kinase A; ROS = reactive oxygen species; SPT = skin prick test; Treg = T regulatory cell.
Figure 2.
Figure 2.
Heat map of relationships between gene module eigenvalues and participant clinical traits. Forty-nine gene coexpression networks were identified using Weighted Gene Coexpression Network Analysis. In the heat map, positive relationships are red and inverse relationships are blue. The network labeled “Sex” contained mostly Y-chromosome genes and showed the strongest correlation with sex (P = 7e−49). Modules of lymphocyte-specific and eosinophil-specific genes were identified (named Lymph and Eos, respectively) and correlated strongly with % lymphocytes and % eosinophils in the BAL. Only one module correlated strongly with all asthma severity measures: BALcAMP. Asthma dx = asthma diagnosis; AQLQ = asthma quality-of-life questionnaires; BA = β-agonist; BDR = bronchodilator response; BMI = body mass index; DC = dendritic cell; ED_or_Hosp_1 yr = emergency department visit or hospitalization in the past 1 year; Eos = eosinophils; FeNO = fractional exhaled nitric oxide; FEV1_pre_per = FEV1 prebronchodilator, percent predicted; FEV1_pre_liter = FEV1 prebronchodilator in liters; ICS = inhaled corticosteroids, liters; LABA = long-acting β-agonists; Lymph = lymphocytes; Mac = macrophages; Mono = monocytes;PMN = polymorphonuclear; Severe_asthma = diagnosis of severe asthma; WBC = white blood cell.
Figure 3.
Figure 3.
BALcAMP expression in relation to β-agonist use and American Thoracic Society (ATS)-defined asthma severity. BALcAMP expression as represented by the geometric mean was inversely related to (A) β-agonist use and (B) ATS-defined severity classes (P = 0.0003 and P < 0.0001, respectively), suggesting a relationship to both. HC = healthy control subjects; ICS = inhaled corticosteroids; Mod = moderate.
Figure 4.
Figure 4.
Plots of module membership versus gene significance for asthma severity measures and BALcAMP. The closeness of a gene to the center of its module (i.e., eigenvalue) was quantified using a module membership variable. The correlation or association of a gene to a sample trait (e.g., total asthma quality-of-life questionnaire score) was quantified using a gene significance variable. For each gene in the BALcAMP module, module membership versus gene significance was plotted for (A) total Juniper asthma quality-of-life questionnaire score, (B) FEV1% predicted, (C) rate of emergency department visit or hospitalization in the past year, (D) use of inhaled long-acting β-agonists, (E) use of high-dose inhaled corticosteroids, and (F) systemic corticosteroids. As shown in AF, the genes closest to the BALcAMP module eigenvalue also had the strongest relationship to each trait. The gene CREM (highlighted by red box) is notable for being in the top right of each graph. AQLQ = asthma quality-of-life questionnaires; CS = corticosteroids; ED/Hosp = emergency department visits or hospitalizations; ICS = inhaled corticosteroids; LABA = long-acting β-agonists.
Figure 5.
Figure 5.
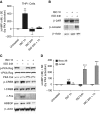
cAMP induction and signaling in THP-1 cells following acute and chronic β-agonist exposure. (A) cAMP levels were induced with acute isoproterenol exposure (ISO 1 h), suppressed with chronic ISO (ISO 24 h), and had a dampened response to chronic followed by acute exposure (ISO 24 h+ 1 h). (B) Human primary alveolar macrophages showed induction of β2-agonist receptor (B2AR) with ISO 1 hour, but suppression of B2AR and induction of B2AR-negative regulator β-Arrestin after 24 hours ISO. (C) ISO 24 hours blocked dephosphorylation of the PKA regulatory subunit (p-PKA Reg), preventing activation and PKA-dependent phosphorylation of CREB (p-CREB). Downstream gene products for c-Fos and HBEGF were induced at ISO 1 hour but suppressed by ISO 24 hours and ISO 24 hours + 1 hour. (D) cAMP induction by acute and prolonged ISO exposure in Beas-2B epithelial and Jurkat T cell lines shows less intense and delayed action, respectively, compared with THP-1 cells. A and D, results are average cAMP values ± SEM relative to untreated cells from three experiments performed on different days. Blots shown are representative from two (B) and three (C) separate experiments from different days. **P < 0.01, by ANOVA compared with other treatments of the same cell type; ***P < 0.001 compared with UnTx and ISO 1 hour. PKA = protein kinase A.
Figure 6.
Figure 6.
Protein expression of BALcAMP genes in asthmatic BAL lysates. (A) GAPDH protein levels were similar between control/mild patients’ BAL lysates and those from patients with severe asthma. CREM (B), FOS (C), and HBEGF (D) protein quantities from BAL samples were standardized to GAPDH for each sample, with variable correlation of protein abundance with gene expression; only HBEGF protein levels correlated with mRNA. P values shown are from two-tailed Student’s t tests. Ctrl = control; Mod = moderate.
Figure 7.
Figure 7.
Cluster of combining airway epithelial cell (AEC) and BAL gene expressions. In a previous study, an AEC T2 gene signature has differentiated “T2-hi” asthma subjects from “T2-lo” subjects and healthy control subjects (19). An epithelial growth and repair (EGR) module had separated severe disease from milder forms. In a combinatorial analysis, 17 hub genes from the severity module of the BAL (BALcAMP) module were combined with 8 EGR hub genes and 8 T2 hub genes in the AEC expression. Using entropy-weighted K-means clustering, participants clustered into five subject clusters, objectively, using minimization of error to determine k. In the heat map, upregulated gene expression is yellow and downregulated gene expression is blue. HC = healthy control; ICS = inhaled corticosteroids; Mild–Mod no ICS = mild–moderate asthma/no inhaled corticosteroids; Mild + ICS = mild asthma with ICS; Mod + ICS = moderate with ICS; SC = subject cluster; Severe = severe asthma.

Comment in

References

    1. Sullivan SD, Rasouliyan L, Russo PA, Kamath T, Chipps BE TENOR Study Group. Extent, patterns, and burden of uncontrolled disease in severe or difficult-to-treat asthma. Allergy. 2007;62:126–133. - PubMed
    1. Wenzel SE. Asthma phenotypes: the evolution from clinical to molecular approaches. Nat Med. 2012;18:716–725. - PubMed
    1. Cookson W. The alliance of genes and environment in asthma and allergy. Nature. 1999;402(Suppl):B5–B11. - PubMed
    1. Belsky DW, Sears MR, Hancox RJ, Harrington H, Houts R, Moffitt TE, et al. Polygenic risk and the development and course of asthma: an analysis of data from a four-decade longitudinal study. Lancet Respir Med. 2013;1:453–461. - PMC - PubMed
    1. Sheehan WJ, Phipatanakul W. Difficult-to-control asthma: epidemiology and its link with environmental factors. Curr Opin Allergy Clin Immunol. 2015;15:397–401. - PMC - PubMed

Publication types

MeSH terms