. 2019 Jun 4;129(7):2904-2919.
doi: 10.1172/JCI127307.

Autophagy is required for lung development and morphogenesis

Affiliations

Autophagy is required for lung development and morphogenesis

Behzad Yeganeh et al. J Clin Invest. .

Abstract

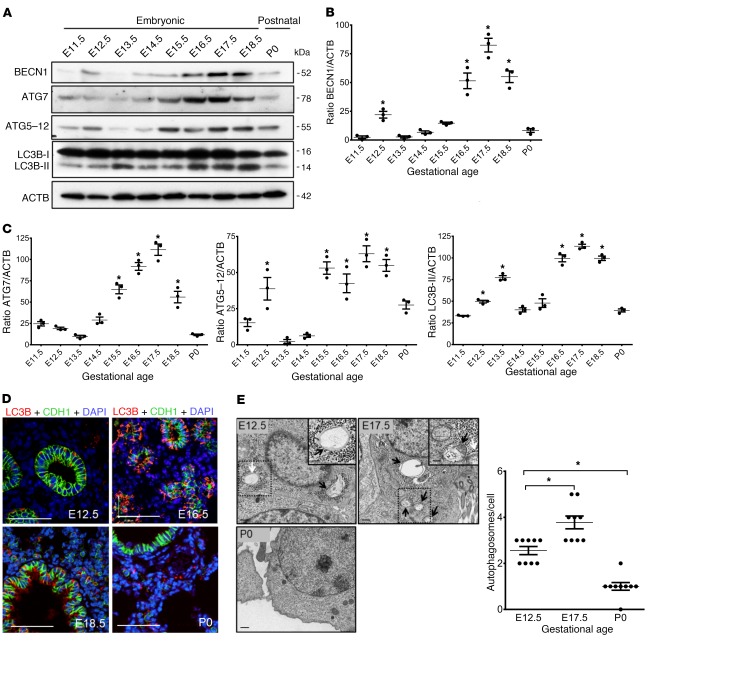
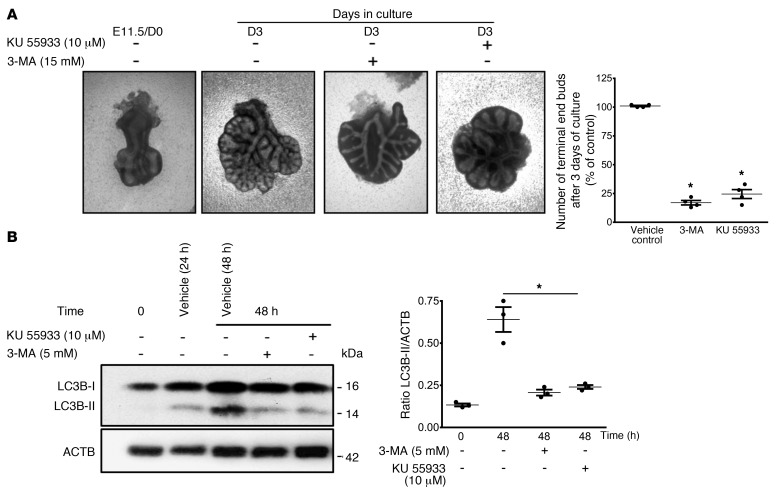
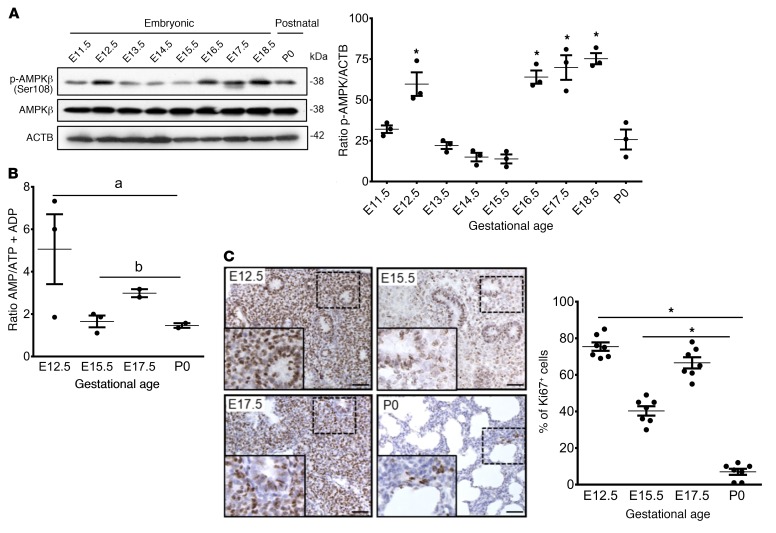
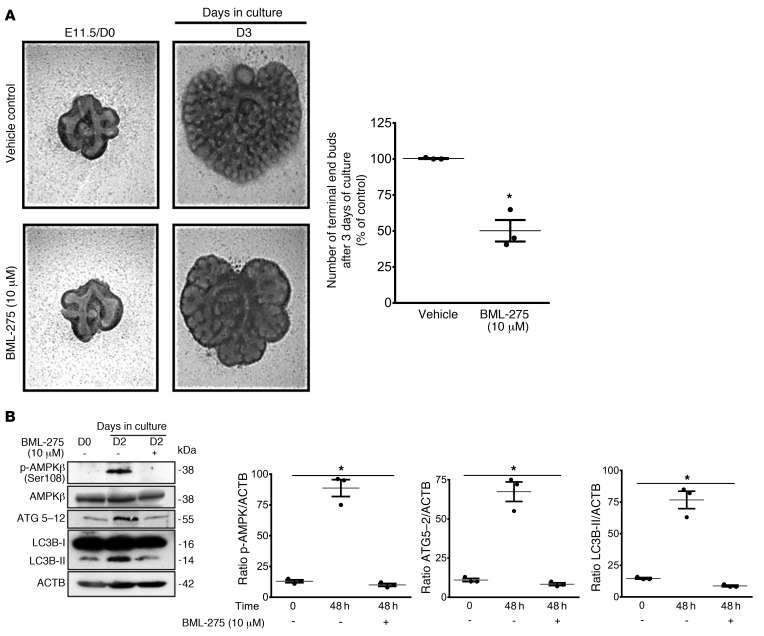
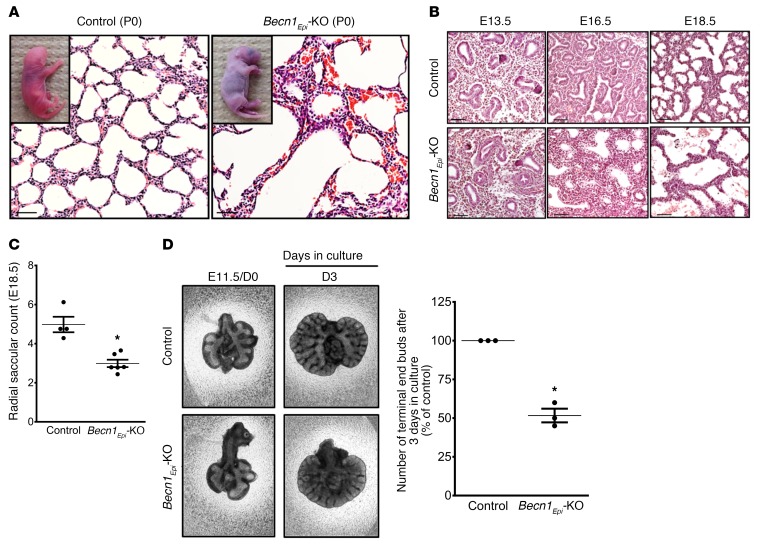
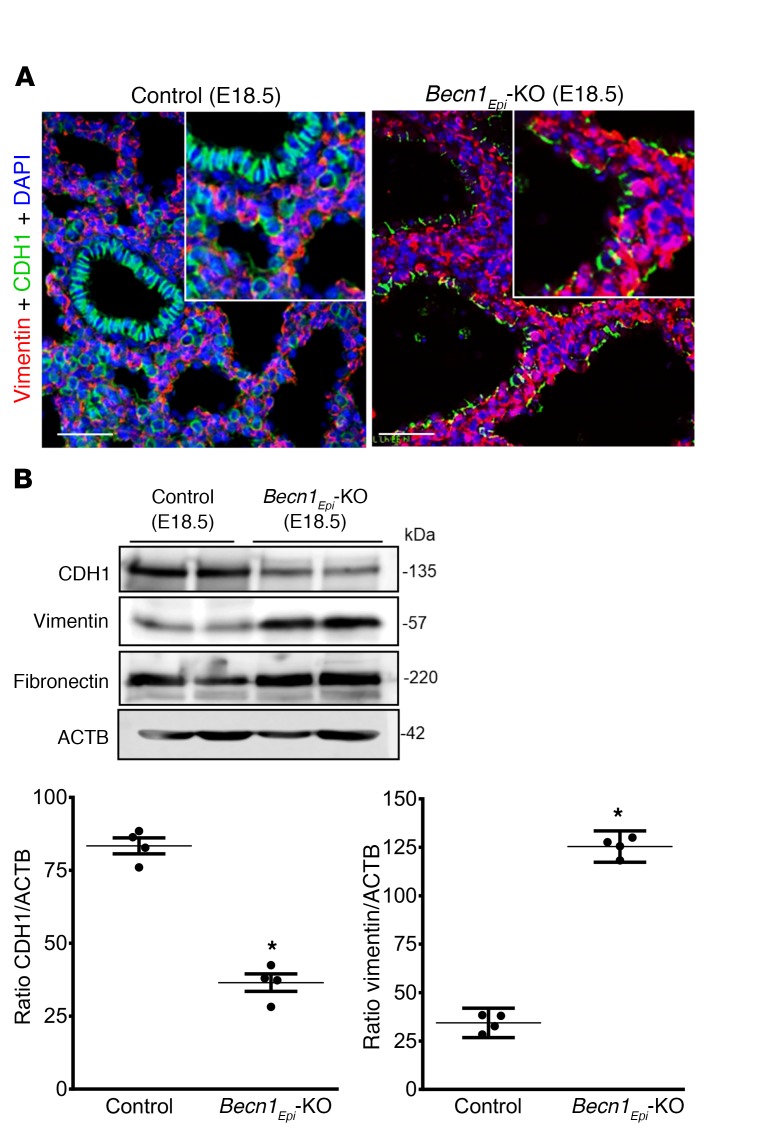
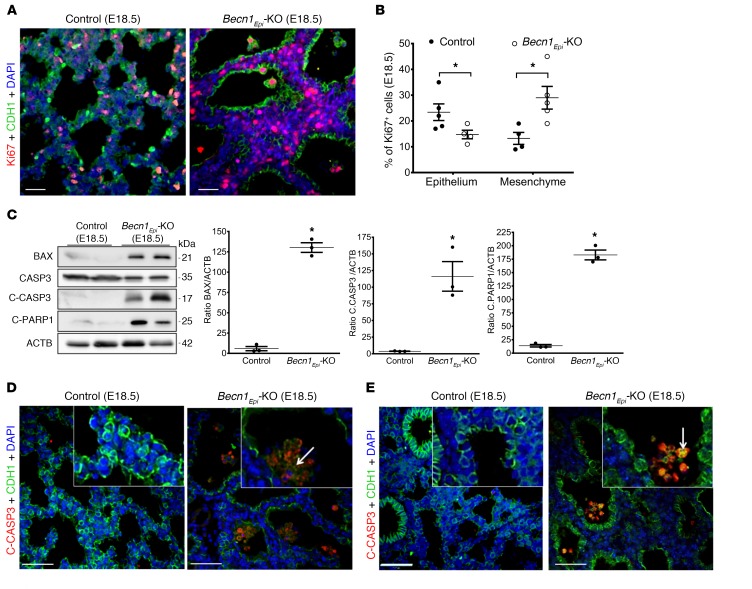
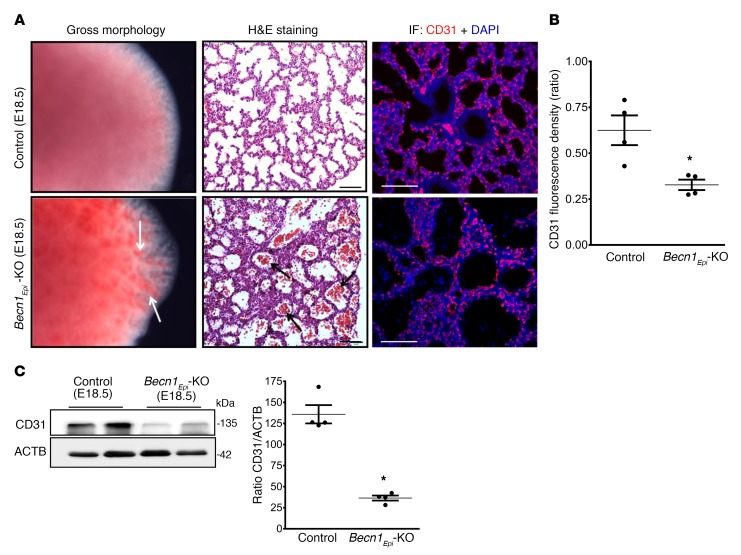
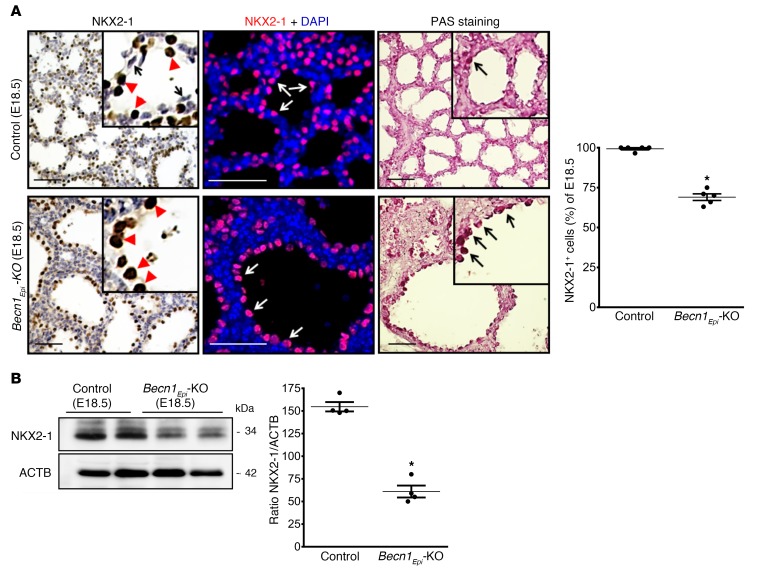
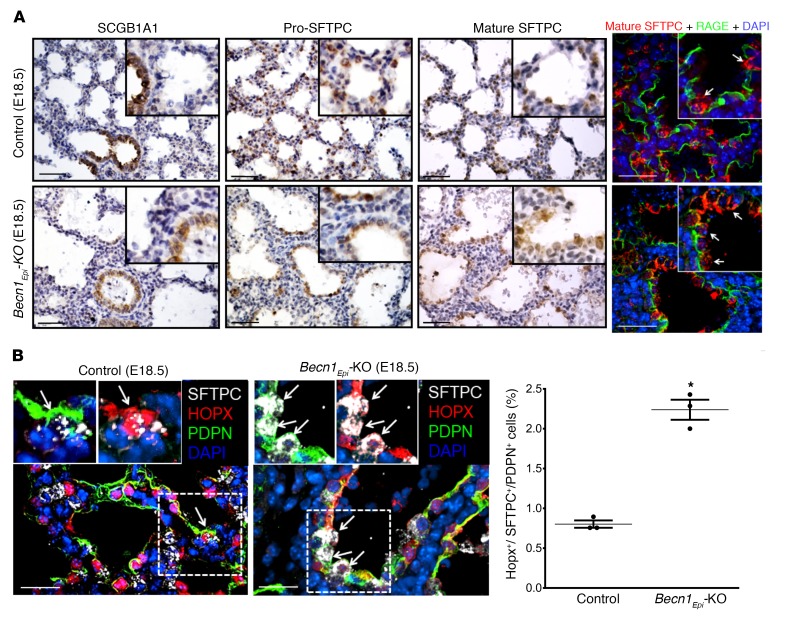
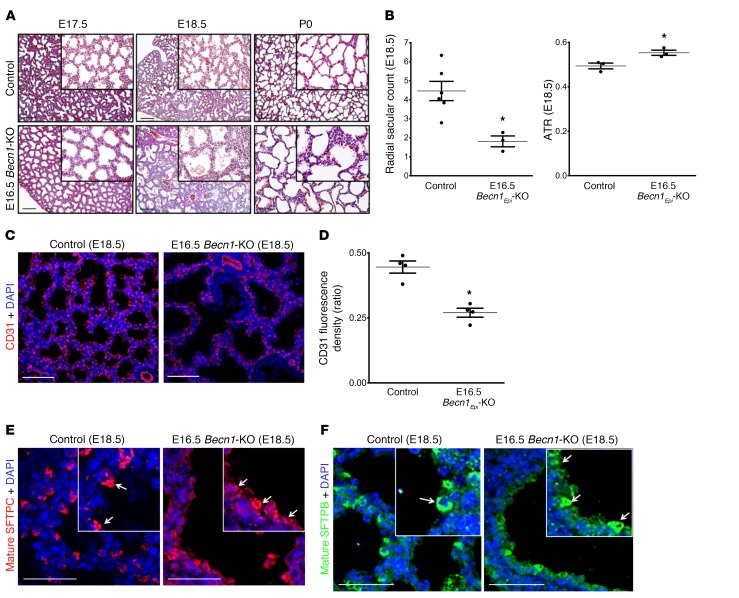
Bronchopulmonary dysplasia (BPD) remains a major respiratory illness in extremely premature infants. The biological mechanisms leading to BPD are not fully understood, although an arrest in lung development has been implicated. The current study aimed to investigate the occurrence of autophagy in the developing mouse lung and its regulatory role in airway branching and terminal sacculi formation. We found 2 windows of epithelial autophagy activation in the developing mouse lung, both resulting from AMPK activation. Inhibition of AMPK-mediated autophagy led to reduced lung branching in vitro. Conditional deletion of beclin 1 (Becn1) in mouse lung epithelial cells (Becn1Epi-KO), either at early (E10.5) or late (E16.5) gestation, resulted in lethal respiratory distress at birth or shortly after. E10.5 Becn1Epi-KO lungs displayed reduced airway branching and sacculi formation accompanied by impaired vascularization, excessive epithelial cell death, reduced mesenchymal thinning of the interstitial walls, and delayed epithelial maturation. E16.5 Becn1Epi-KO lungs had reduced terminal air sac formation and vascularization and delayed distal epithelial differentiation, a pathology similar to that seen in infants with BPD. Taken together, our findings demonstrate that intrinsic autophagy is an important regulator of lung development and morphogenesis and may contribute to the BPD phenotype when impaired.

Keywords: Autophagy; Development; Organogenesis; Pulmonary surfactants; Pulmonology.


Conflict of interest statement

Conflict of interest: The authors have declared that no conflict of interest exists.

Figures

Figure 1
Figure 1. Autophagy activity during embryonic mouse lung development.
(A) Representative immunoblots of the autophagy proteins ATG7, ATG5–12, BECN1, and LC3B-II (lower band) in mouse lung lysates during lung development. (B and C) Densitometric measurements of ATG7, ATG5–12, BECN1, and LC3B-II proteins at various gestation points relative to E11.5 lung. ACTB was used as a protein loading control. Results are expressed as the mean ± SEM from 3 separate experiments. *P < 0.05 versus E11.5. (D) IF confocal microscopic images showing the autophagosome marker LC3B (red) and the epithelial marker E-cadherin (CDH1, green) during lung development. Nuclei were stained with DAPI (blue). (E) Representative TEM images from embryonic (E12.5 and E17.5) and postnatal (P0) mouse lungs. Arrows indicate autophagosomes present in the epithelial cells of the lungs. Scale bars: 500 nm and 250 nm (insets). Graph shows quantitative analysis of the number of autophagosomes per epithelial cell (≥10 micrographs per gestational age for 2 mice; autophagic vacuoles were counted from 8 to 10 randomly selected fields). Results are expressed as the mean ± SEM. *P < 0.05 versus E12.5. Statistical significance for all data was determined by 1-way ANOVA followed by Tukey’s post hoc test.
Figure 2
Figure 2. Autophagy inhibition reduces early lung branching in vitro.
(A) Representative micrographs of lung explant tissue cultured in the presence of the autophagy inhibitors 3-MA (5 mM) and KU 55933 (10 mM). E11.5 lung explants (D0) were treated with inhibitors or vehicle control, and terminal buds were counted after 72 hours of culture (D3) for quantitative evaluation of early branching morphogenesis In the graph, the numbers of terminal end buds on D3 are expressed as a percentage of the vehicle control (mean ± SEM, n = 5 separate explant cultures).*P < 0.05 versus vehicle control. (B, left panel) Representative immunoblot for LC3B-II in lysates of lung explants treated with vehicle, 3-MA or KU after 48 hours of culture. (B, right panel) Densitometric analysis of LC3B-II in lysates of lung explants. ACTB was used as a protein loading control. Results are expressed as the mean ± SEM n = 3 separate explant cultures).*P < 0.05 versus 48-hour vehicle control. Statistical significance for all data was determined by 1-way ANOVA followed by Tukey’s post hoc test.
Figure 3
Figure 3. Autophagy is accompanied by AMPK activation during embryonic mouse lung development.
(A) Representative immunoblots of p-AMPKβ (Ser108) and AMPKβ proteins in mouse lung lysates during lung development. Graph shows densitometric analysis of p-AMPKβ (Ser108) during lung development relative to E11.5 lung. ACTB was used as a protein loading control. Results are expressed as the mean ± SEM (n = 3 separate experiments). *P < 0.05 versus E11.5. (B) AMP/ATP plus ADP ratios in embryonic (E12.5, E15.5, and E17.5) and postnatal (P0) lungs. Data show the mean ± SEM (n = 3 separate experiments). aP < 0.05 versus E12.5; bP < 0.05 versus E17.5. (C) Representative IHC images for Ki67 expression in embryonic (E12.5, E15.5, and E17.5) and postnatal (P0) lung tissue. Scale bars: 50 μm. Graph shows quantitative analysis of Ki67+ cells per mm2. Results are expressed as the mean ± SEM (n = 3 separate lungs). *P < 0.05 versus E12.5. Statistical significance for all data was determined by 1-way ANOVA followed by Tukey’s post hoc test.
Figure 4
Figure 4. Inhibition of AMPK signaling reduces autophagy and early lung branching in vitro.
(A, left panel) Representative micrographs of lung explant tissue cultured with and without the AMPK inhibitor BML-275 (10 mM) for 72 hours (D3). In the graph, the number of terminal end buds on D3 are expressed as a percentage of the vehicle control. Results represent the mean ± SEM from 3 separate experiments. *P < 0.05 versus vehicle control, by Student’s t test). (B) Representative immunoblots of p-AMPKβ (Ser108), AMPKβ, ATG5–12, and LC3B proteins in lysates of lung explants treated with vehicle or BML-275 for 48 hours. Graphs show densitometric analysis of p-AMPKβ (Ser108), ATG5–12, and LC3B-II proteins in lysates of lung explants. ACTB was used as a protein loading control. Results are expressed as the mean ± SEM (n = 3 independent experiments). *P < 0.05 versus 48-hour vehicle control, by 1-way ANOVA followed by Tukey’s post hoc test.
Figure 5
Figure 5. BECN1 is required for normal lung development and morphogenesis.
(A) Representative light photomicrographs of H&E-stained lung sections from littermate control and Becn1Epi-KO pups after birth. Inserts are representative photographs of littermate control and lung-specific Becn1Epi-KO pups immediately after birth. Scale bars: 70 μm. (B) Representative light photomicrographs of H&E-stained lung sections from littermate control and lung-specific Becn1Epi-KO littermates at different stages of lung development (E13.5, E16.5, and E18.5). Scale bars: 50 μm. (C) Graph shows the radial saccular count for E18.5 lungs from control (WT) mice and Becn1Epi-KO littermates. Data represent the mean ± SEM (n = 5 separate mouse lungs). *P < 0.05 versus control, by Student’s t test. (D) Representative explant cultures of E11.5 control (WT) and Becn1Epi-KO lung tissue that was cultured for 72 hours to evaluate branching morphogenesis. Graph indicates the number of terminal air sacs expressed as the mean ± SEM (n = 5 separate experiments). *P < 0.05 versus control, by Student’s t test.
Figure 6
Figure 6. Conditional deletion of epithelial Becn1 affects mesenchymal thinning of the developing lung.
(A) Co-IF staining of CDH1 (green) and vimentin (red) in Becn1Epi-KO and littermate control lungs at E18.5. Nuclei were stained with DAPI (blue). Scale bars: 50 μm; original magnification, ×40 (insets). (B) Representative Western blot for CDH1, vimentin, and fibronectin. Graphs show the densitometric analysis of CDH1 and vimentin expression in whole-lung lysates harvested from Becn1Epi-KO and littermate controls at E18.5. ACTB was used as a protein loading control. Data represent the mean ± SEM (n = 4 separate lungs). *P < 0.05 versus control, by Student’s t test.
Figure 7
Figure 7. Conditional deletion of Becn1 perturbs epithelial cell proliferation and apoptosis during lung development.
(A) Co-IF staining of CDH1 (green) and Ki67 (red) in Becn1Epi-KO and littermate control lungs at E18.5. Nuclei were stained with DAPI (blue). Scale bars: 30 μm. (B) Percentage of Ki67+ epithelial and nonepithelial cells in Becn1Epi-KO and littermate control lungs at E18.5. Data represent the mean ± SEM (n = 3 separate lungs). *P < 0.05, by Student’s t test. (C) Representative immunoblots for BAX, CASP3, C-CASP3, and C-PARP in whole-lung lysates harvested from Becn1Epi-KO and littermate control embryos at E18.5. Graphs show densitometric analysis of BAX, C-CASP3, and C-PARP protein expression. ACTB was used as a protein loading control. Data represent the mean ± SEM (n = 4 separate pups). *P < 0.05 versus WT control, by Student’s t test. (D and E) Co-IF staining for E-cadherin (green) with the apoptosis markers C-CASP3 (D, red) and C-PARP (E, red) in Becn1Epi-KO and littermate control lungs at E18.5. Scale bars: 50 μm; original magnification, ×40 (insets).
Figure 8
Figure 8. Conditional deletion of Becn1 alters proper pulmonary vascular development.
(A) Left panel: Gross morphology of E18.5 lungs from control (WT) and Becn1Epi-KO embryos. White arrows point to hemorrhage regions in Becn1Epi-KO lung. Middle panel: Representative light photomicrographs of H&E-stained lung sections from E18.5 littermate control (WT) and Becn1Epi-KO mice. Note the infiltration of red blood cells in the enlarged air spaces (black arrows) in Becn1Epi-KO lung. Right panel: Confocal IF microscopic images of embryonic lungs (E18.5) stained for the endothelial cell marker CD31 (red). Nuclei were stained with DAPI (blue). Scale bars: 100 μm (middle panel) and 50 μm (right panel). (B) Quantification of the CD31/DAPI fluorescence ratio of E18.5 lungs from control (WT) and Becn1Epi-KO embryos. Data represent the mean ± SEM (n = 3 separate lungs). *P < 0.05 versus WT control, by Student’s t test. (C) Representative immune blot for CD31 on whole E18.5 lung lysates from control (WT) and Becn1Epi-KO embryos. The membrane was re-used in Figure 7C and Figure 8C, which show the same loading control. Graph shows densitometric analysis of CD31 expression. ACTB was used as a protein loading control. Data represent the mean ± SEM (n = 4 separate lungs). *P < 0.05 versus WT control, by Student’s t test.
Figure 9
Figure 9. Conditional deletion of Becn1 reduces NKX2-1 expression.
(A) IHC and confocal IF microscopic images show NKX2-1 and glycogen content (PAS staining) in lung tissue sections from E18.5 Becn1Epi-KO and littermate control (WT) fetuses. In the littermate control, the type II cuboidal alveolar cells stained positive for NKX2-1 (top left inset, red arrowheads), whereas type I squamous alveolar cells lacked NKX2-1 expression (top left inset, black arrows). In the Becn1Epi-KO lung, only NKX2-1+ cuboidal cells were visible (bottom left inset, red arrowheads). In the IF staining (middle panel), NKX2-1+ cells are shown in red, whereas nuclei were stained with DAPI (blue). Scale bars: 50 μm. Graph shows densitometric analysis of NKX2-1 IF results. Data represent the mean ± SEM (n = 4 separate lungs). *P < 0.05 versus control, by Student’s t test. (B) Representative immunoblot for NKX2-1. Graphs shows densitometric analysis of NKX2-1 expression in whole-lung lysate harvested from Becn1Epi-KO and littermate control embryos at E18.5. ACTB was used as a protein loading control. Data represent the mean ± SEM (n = 4 separate lungs). *P < 0.05 versus WT control, by Student’s t test.
Figure 10
Figure 10. Conditional deletion of Becn1 delays distal epithelial differentiation.
(A) Representative IHC images for Clara cell secretory protein (SCGB1A1), pro-SFTPCC, and mature SFTPC expression in lung tissue sections from E18.5 Becn1Epi-KO and littermate control fetuses. Scale bars: 50 μm; original magnification, ×20 (insets). IF microscopic images show lung tissue sections from E18.5 Becn1Epi-KO and littermate control fetuses stained for mature SFTPC (red) and RAGE (green). The white arrows in the insets point to cuboidal alveolar type II epithelial cells. Scale bars: 25 μm; original magnification, ×40 (insets). (B) Confocal IF microscopic images of E18.5 lung tissue from Becn1Epi-KO mice costained for SFTPC (white), HOPX (red), and PDPN (green). Nuclei were stained with DAPI. Arrows indicate alveolar precursor cells detected by an overlap of all these markers. Scale bars: 25 μm; original magnification, ×40 (insets). Graph indicates the percentage of alveolar precursor cells that stained positive for SFTPC, HOPX, and PDPN in E18.5 lung sections from Becn1Epi-KO and littermate control mice. Data are expressed as the mean ± SEM (n = 3 separate experiments). *P < 0.05 versus WT control, by Student’s t test.
Figure 11
Figure 11. Pulmonary phenotype following deletion of epithelial Becn1 at canalicular/saccular stages.
(A) Representative H&E-stained images of lungs from littermate control (WT) and E16.5 Becn1Epi-KO mice at E17.5, E18.5, and immediately after birth (P0). Scale bars: 100 μm; original magnification, ×20 (insets). (B) Graph shows the radial saccular count and the ATR for littermate control and E16.5 Becn1Epi-KO mice at E18.5. Data represent the mean ± SEM (n = 5 separate lungs). *P < 0.05 versus WT control, by Student’s t test. (C) Confocal IF microscopic images of embryonic lungs (E18.5) stained for the endothelial cell marker CD31 (red). Nuclei were stained with DAPI (blue). Scale bars: 50 μm. (D) Quantification of the CD31/DAPI fluorescence ratio in E18.5 lung tissue from control (WT) and E16.5 Becn1Epi-KO embryos. Results are shown as the mean ± SEM (n = 3 separate lungs). *P < 0.05 versus WT control, by Student’s t test. (E and F) Representative confocal IF microscopic images of E18.5 lung tissue sections from E16.5 Becn1Epi-KO and littermate control mice stained for mature SFTPC (E, red) and SFTPB (F, green). Nuclei were stained with DAPI. The white arrows in the insets point to cuboidal alveolar type II epithelial cells. Scale bars: 25 μm; original magnification, x40 (insets).

Comment in

  • Normal lung development needs self-eating.
    Warburton D, Bellusci S. Warburton D, et al. J Clin Invest. 2019 Jun 4;129(7):2658-2659. doi: 10.1172/JCI129442. eCollection 2019 Jun 4. J Clin Invest. 2019. PMID: 31162136 Free PMC article.

References

    1. Edwards MO, Kotecha SJ, Kotecha S. Respiratory distress of the term newborn infant. Paediatr Respir Rev. 2013;14(1):29–36; quiz 36. doi: 10.1016/j.prrv.2012.02.002. - DOI - PubMed
    1. Cardoso WV, Lü J. Regulation of early lung morphogenesis: questions, facts and controversies. Development. 2006;133(9):1611–1624. doi: 10.1242/dev.02310. - DOI - PubMed
    1. Harding R, Hooper SB. Regulation of lung expansion and lung growth before birth. J Appl Physiol. 1996;81(1):209–224. doi: 10.1152/jappl.1996.81.1.209. - DOI - PubMed
    1. Conlon I, Raff M. Size control in animal development. Cell. 1999;96(2):235–244. doi: 10.1016/S0092-8674(00)80563-2. - DOI - PubMed
    1. Cardoso WV. Molecular regulation of lung development. Annu Rev Physiol. 2001;63:471–494. doi: 10.1146/annurev.physiol.63.1.471. - DOI - PubMed

Publication types

Grants and funding