Observational Study
. 2019 Jun;127(6):67005.
doi: 10.1289/EHP4648. Epub 2019 Jun 4.

Ambient Temperature and Markers of Fetal Growth: A Retrospective Observational Study of 29 Million U.S. Singleton Births

Affiliations
Observational Study

Ambient Temperature and Markers of Fetal Growth: A Retrospective Observational Study of 29 Million U.S. Singleton Births

Shengzhi Sun et al. Environ Health Perspect. 2019 Jun.

Abstract

Background: Emerging studies suggest that ambient temperature during pregnancy may be associated with fetal growth, but the existing evidence is limited and inconsistent.

Objectives: We aimed to evaluate the association of trimester-specific temperature with risk of being born small for gestational age (SGA) and birth weight-markers of fetal growth-among term births in the contiguous United States.

Methods: We included data on 29,597,735 live singleton births between 1989 and 2002 across 403 U.S. counties. We estimated daily county-level population-weighted mean temperature using a spatially refined gridded climate data set. We used logistic regression to estimate the association between trimester-specific temperature and risk of SGA and linear regression to evaluate the association between trimester-specific temperature and term birth weight z-score, adjusting for parity, maternal demographics, smoking or drinking during pregnancy, chronic hypertension, and year and month of conception. We then pooled results overall and by geographic regions and climate zones.

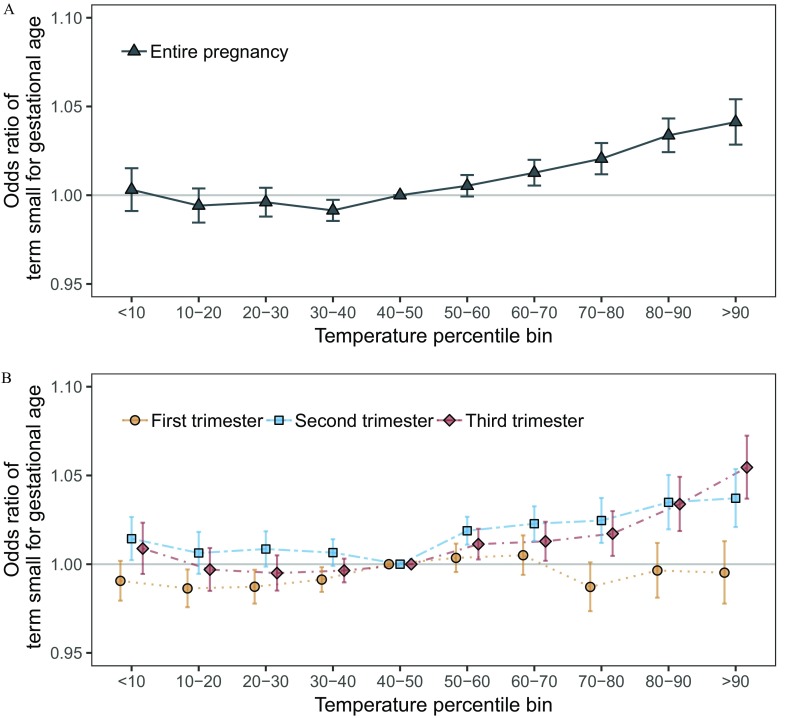
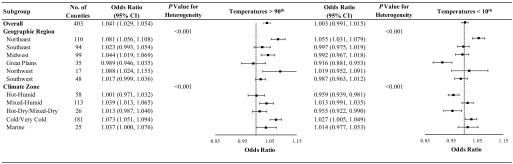
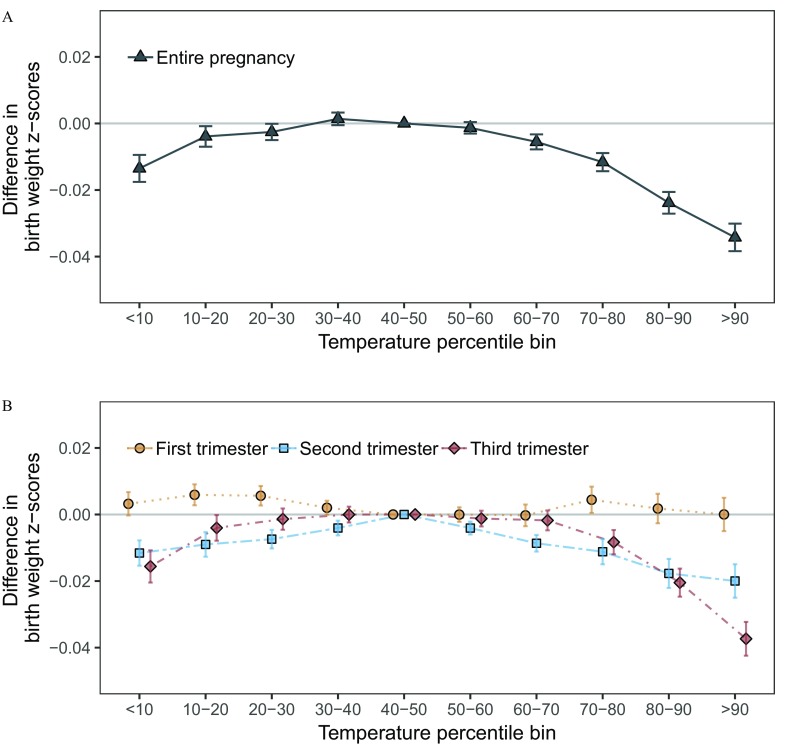
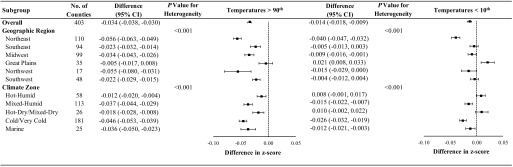
Results: High ambient temperatures ([Formula: see text] percentile) during the entire pregnancy were associated with higher risk of term SGA {odds ratio [OR] [Formula: see text] 1.041 [95% confidence interval (CI): 1.029, 1.054]} and lower term birth weight [standardized to [Formula: see text] (95% CI: [Formula: see text], [Formula: see text]) reduction in birth weight for infants born at 40 weeks of gestation]. Low temperatures ([Formula: see text] percentile) during the entire pregnancy were not associated with SGA [OR [Formula: see text] 1.003 (95% CI: 0.991, 1.015)] but were associated with a small decrement in term birth weight [standardized to [Formula: see text] (95% CI: [Formula: see text], [Formula: see text])]. Risks of term SGA and birth weight were more strongly associated with temperature averaged across the second and third trimesters, in areas the Northeast, and in areas with cold or very cold climates.

Conclusions: Above-average temperatures during pregnancy were associated with lower fetal growth. Our findings provide evidence that temperature may be a novel risk factor for reduced fetal growth. https://doi.org/10.1289/EHP4648.


Figures

Figures 1A (showing data for entire pregnancy) and 1B (showing data for first trimester, second trimester, and third trimester) plot odds ratio of term small for gestational age (ranging between 0.95 and 1.10 at intermissions of 0.5) (y-axis) across temperature percentile bin (ranging between less than 10 and greater than 90 at intermissions of 10 (x-axis).
Figure 1.
Exposure–response curves for the association between small for gestational age and (A) average temperatures during the entire pregnancy and (B) trimester-specific temperatures, among 29,597,735 singleton term births in 403 U.S. counties between 1989 and 2002. Models were adjusted for maternal age, race, marital status, years of education, smoking or drinking during pregnancy, parity, chronic hypertension, and year and month of conception.
Figure 2 shows a tabular representation with eight columns. The first column lists the subgroup. The adjacent columns list number of counties, odds ratio (95 percent confidence interval), p value for heterogeneity, and a forest plot for odds ratio (ranging between negative 0.85 and 1.15 with intermissions of 0.10) associated with temperatures above 90th percentile, followed by difference (95 percent confidence intervals), p value for heterogeneity, and a forest plot for odds ratio (ranging between negative 0.85 and 1.15 with intermissions of 0.10) associated with temperatures below 10th percentile.
Figure 2.
Odds ratio (95% CI) of small for gestational age associated with temperatures above the county-specific 90th percentile and below the county-specific 10th percentile during the entire pregnancy among 29,597,735 singleton term births in 403 U.S. counties between 1989 and 2002, overall and by geographic region and climate zone. Models were adjusted for maternal age, race, marital status, years of education, smoking status, alcohol drinking, parity, chronic hypertension, and year and month of conception. Odds ratios were relative to temperatures ranging from 40th to 50th percentile of each county. CI, confidence interval.
Figures 3A (showing data for entire pregnancy) and 3B (showing data for first trimester, second trimester, and third trimester) plot difference in birth weight z scores (ranging between negative 0.04 and 0.02 at intermissions of 0.2) (y-axis) across temperature percentile bin (ranging between less than 10 and greater than 90 at intermissions of 10 (x-axis).
Figure 3.
Exposure–response curves for the associations between the difference in birth weight z-score and (A) average temperatures during the entire pregnancy and (B) trimester-specific temperatures among 29,597,735 singleton term births in 403 U.S. counties between 1989 and 2002. Models were adjusted for maternal age, race, marital status, years of education, smoking or drinking during pregnancy, parity, chronic hypertension, and year and month of conception.
Figure 4 shows a tabular representation with eight columns. The first column lists the subgroup. The adjacent columns list number of counties, difference (95 percent confidence interval), p value for heterogeneity, and a forest plot for difference in z score (ranging between negative 0.10 and 0.05 with intermissions of 0.5) associated with temperatures above 90th percentile, followed by difference (95 percent confidence intervals), p value for heterogeneity, and a forest plot for difference in z score (ranging between negative 0.10 and 0.05 with intermissions of 0.5) associated with temperatures below 10th percentile.
Figure 4.
Difference in birth weight z-score associated with county-specific temperatures above the 90th percentile and county-specific temperatures below the 10th percentile during the entire pregnancy among 29,597,735 term births in 403 U.S. counties between 1989 and 2002, overall and by geographic region and climate zone. Models were adjusted for maternal age, race, marital status, years of education, smoking status, alcohol drinking, parity, chronic hypertension, and year and month of conception. Odds ratios were relative to temperatures ranging from 40th to 50th percentile of each county. CI, confidence interval.

Comment in

References

    1. Alexander GR, Himes JH, Kaufman RB, Mor J, Kogan M. 1996. A United States national reference for fetal growth. Obstet Gynecol 87(2):163–168, PMID: 8559516, 10.1016/0029-7844(95)00386-X. - DOI - PubMed
    1. Barker DJ. 2006. Adult consequences of fetal growth restriction. Clin Obstet Gynecol 49(2):270–283, PMID: 16721106, 10.1097/00003081-200606000-00009. - DOI - PubMed
    1. Basu R, Rau R, Pearson D, Malig B. 2018. Temperature and term low birth weight in California. Am J Epidemiol 187(11):2306–2314, PMID: 29901701, 10.1093/aje/kwy116. - DOI - PubMed
    1. Bell ML, Belanger K. 2012. Review of research on residential mobility during pregnancy: consequences for assessment of prenatal environmental exposures. J Expo Sci Environ Epidemiol 22(5):429–438, PMID: 22617723, 10.1038/jes.2012.42. - DOI - PMC - PubMed
    1. Bell ML, Ebisu K, Belanger K. 2007. Ambient air pollution and low birth weight in Connecticut and Massachusetts. Environ Health Perspect 115(7):1118–1124, PMID: 17637932, 10.1289/ehp.9759. - DOI - PMC - PubMed

Publication types