Comparative Study
. 2019 Aug;158(2):211-221.
doi: 10.1530/REP-18-0509.

Transcriptomic analysis of vitamin D responses in uterine and peripheral NK cells

Affiliations
Comparative Study

Transcriptomic analysis of vitamin D responses in uterine and peripheral NK cells

J A Tamblyn et al. Reproduction. 2019 Aug.

Abstract

Vitamin D deficiency is prevalent in pregnant women and is associated with adverse pregnancy outcomes, in particular disorders of malplacentation. The active form of vitamin D, 1,25-dihydroxyvitamin D3 (1,25(OH)2D3), is a potent regulator of innate and adaptive immunity, but its immune effects during pregnancy remain poorly understood. During early gestation, the predominant immune cells in maternal decidua are uterine natural killer cells (uNK), but the responsivity of these cells to 1,25(OH)2D3 is unknown despite high levels of 1,25(OH)2D3 in decidua. Transcriptomic responses to 1,25(OH)2D3 were characterised in paired donor uNK and peripheral natural killer cells (pNK) following cytokine (CK) stimulation. RNA-seq analyses indicated 911 genes were differentially expressed in CK-stimulated uNK versus CK-stimulated pNK in the absence of 1,25(OH)2D3, with predominant differentially expressed pathways being associated with glycolysis and transforming growth factor β (TGFβ). RNA-seq also showed that the vitamin D receptor (VDR) and its heterodimer partner retinoid X receptor were differentially expressed in CK-stimulated uNK vs CK-stimulated pNK. Further analyses confirmed increased expression of VDR mRNA and protein, as well as VDR-RXR target in CK-stimulated uNK. RNA-seq analysis showed that in CK-stimulated pNK, 1,25(OH)2D3 induced 38 and suppressed 33 transcripts, whilst in CK-stimulated uNK 1,25(OH)2D3 induced 46 and suppressed 19 genes. However, multiple comparison analysis of transcriptomic data indicated that 1,25(OH)2D3 had no significant overall effect on gene expression in either CK-stimulated pNK or uNK. These data indicate that CK-stimulated uNK are transcriptionally distinct from pNK and, despite expressing abundant VDR, neither pNK nor uNK are sensitive targets for vitamin D.


Figures
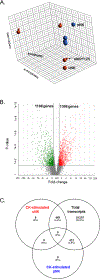
Figure 1.
Figure 1.. Transcriptomic analysis of cytokine (CK) stimulated pNK and uNK cells.
A. Principal component analysis (PCA) analysis of CK-stimulated uNK and pNKs in the presence and absence of 1,25(OH)2D3. 3-dimensional dot-plot summarising the main sources of variance across the whole RNA-seq data set by principal components; PC1 29.9%, PC2 11.9%, PC3 9.3%. This includes pNK (red), uNK (blue) in the presence (small dot) and absence (large dot) of 1,25(OH)2D3 co-treatment. B. Volcano plot summary of differentially expressed genes in CK-stimulated uNK relative to CK-stimulated pNK. Significantly up-regulated genes in CK-stimulated uNKs are in red (n=1098), down-regulated genes in green (n=1188), with those not significantly different in grey (n= 11163). A cut-off of p≤0.05 and fold change ≤−1.5 or ≥+1.5 was used to determine significance. C. Venn diagram summarising the distribution of differentially-expressed genes in CK-stimulated uNK relative to CK-stimulated pNK compared to total transcripts in CK-stimulated uNK and CK pNK following adjustment for false discover rate (FDR): p value ≤ 0.05; log2 fold-change ≤1.5 or ≥1.5, FDR step-up ≤ 0.05.
Figure 2.
Figure 2.. Pathway analysis of vitamin D receptor (VDR) signalling-related genes in CK-stimulated uNK versus CK-stimulated pNK.
Visualisation of genes with enhanced (red) or suppressed (blue) expression in CK-stimulated uNK versus CK-stimulated pNK. Individual genes are shown in boxes and box colour split into two parts, (1) the log2 fold-change in the left part of the box (blue down-regulated, white not changed, red up-regulated) and (2) p-value for statistical significance is shown in the right part of the box (green when significant). Pathway elements not assessed in the dataset are shown in grey.
Figure 3.
Figure 3.. Expression of VDR in paired peripheral blood and uterine natural killer cells
A. Representative flow cytometry plots for expression of NKp46 and CD56 in isolated unstimulated (US) and cytokine (CK)-stimulated peripheral blood natural killer cells (pNK) and uterine natural killer cells (uNK) relative to isotype control (Iso). B. Representative flow cytometry plots for expression of VDR and CD69 in US and CK-stimulated CD3-CD56+ uNK and pNK cells relative to Iso control. C. Summary of VDR and CD69 surface protein expression in US- and CK-uNK and -pNK cells in the presence or absence of 1,25(OH)2D3 (1,25D). D. Median fluorescence intensity (MFI) for VDR expression in pNK and uNK cells. E. mRNA expression for VDR in isolated US and CK uNK and pNK cells in the presence and absence of 1,25(OH)2D3. Relative expression compared to US uNK cells; median value with bars denoting inter-quartile range. Effect of CK stimulation and 1,25(OH)2D3 was assessed by two-way ANOVA. Stars indicate level of significant difference between groups for which multiple comparisons analysis indicated significance *<0.05, **<0.01.
Figure 4.
Figure 4.. Pathway analysis of transcriptomic responses to 1,25(OH)2D3-treated in THP-1 cells, dendritic cells, monocytes and B cells compared to effects in pNK and uNK.
Heat map representing Z-scores for pathways significantly altered by 1,25(OH)2D3 comparing pathway analysis on datasets from THP-1 cells, dendritic cells (DC), monocytes and B cells with effects of 1,25(OH)2D3 on CK-stimulated pNK and uNK. Z-scores >1.96 indicate that more genes are significantly altered in this pathway compared to the complete dataset. Genes differentially expressed between CK-stimulated uNK and pNK in the absence of 1,25(OH)2D3 (pNK vs uNK) showed minimal overlap with the effect of 1,25(OH)2D3 on immune cells. The effects of 1,25(OH)2D3 on CK-stimulated pNK or uNK showed no commonality with the other immune cells.

Similar articles

Cited by

References

    1. Abumaree MH, Chamley LW, Badri M & El-Muzaini MF 2012. Trophoblast debris modulates the expression of immune proteins in macrophages: a key to maternal tolerance of the fetal allograft? J Reprod Immunol 94 131–141. - PubMed
    1. Adams JS & Hewison M 2008. Unexpected actions of vitamin D: new perspectives on the regulation of innate and adaptive immunity. Nat Clin Pract Endocrinol Metab 4 80–90. - PMC - PubMed
    1. Bendix M, Dige A, Deleuran B, Dahlerup JF, Peter Jorgensen S, Bartels LE, Husted LB, Harslof T, Langdahl B & Agnholt J 2015. Flow cytometry detection of vitamin D receptor changes during vitamin D treatment in Crohn’s disease. Clin Exp Immunol. 181 19–28 - PMC - PubMed
    1. Bohler A, Wu G, Kutmon M, Pradhana LA, Coort SL, Hanspers K, Haw R, Pico AR & Evelo CT 2016. Reactome from a WikiPathways Perspective. PLoS Comput Biol 12 e1004941. - PMC - PubMed
    1. Bulmer JN, Williams PJ & Lash GE 2010. Immune cells in the placental bed. Int J Dev Biol 54 281–294. - PubMed

Publication types