

COMBImage2: a parallel computational framework for higher-order drug combination analysis that includes automated plate design, matched filter based object counting and temporal data mining
- PMID: 31164078
- PMCID: PMC6549340
- DOI: 10.1186/s12859-019-2908-0
COMBImage2: a parallel computational framework for higher-order drug combination analysis that includes automated plate design, matched filter based object counting and temporal data mining
Abstract
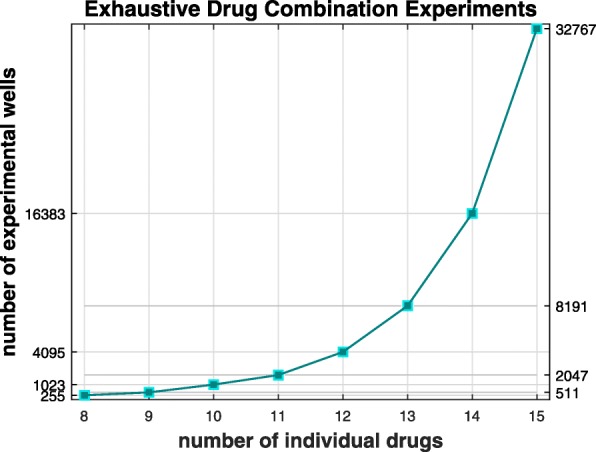
Background: Pharmacological treatment of complex diseases using more than two drugs is commonplace in the clinic due to better efficacy, decreased toxicity and reduced risk for developing resistance. However, many of these higher-order treatments have not undergone any detailed preceding in vitro evaluation that could support their therapeutic potential and reveal disease related insights. Despite the increased medical need for discovery and development of higher-order drug combinations, very few reports from systematic large-scale studies along this direction exist. A major reason is lack of computational tools that enable automated design and analysis of exhaustive drug combination experiments, where all possible subsets among a panel of pre-selected drugs have to be evaluated.
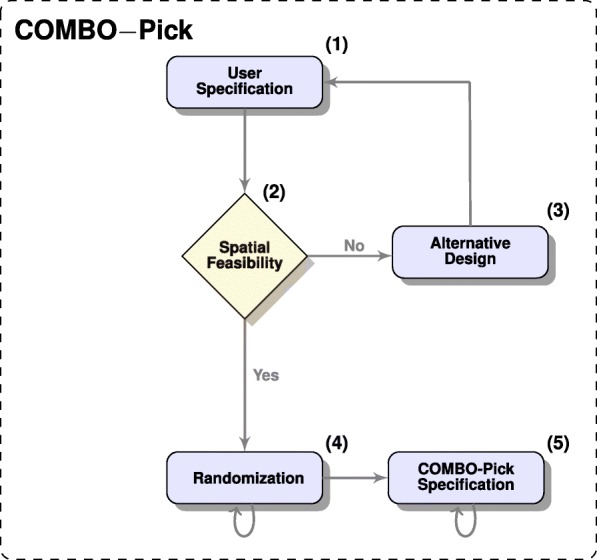
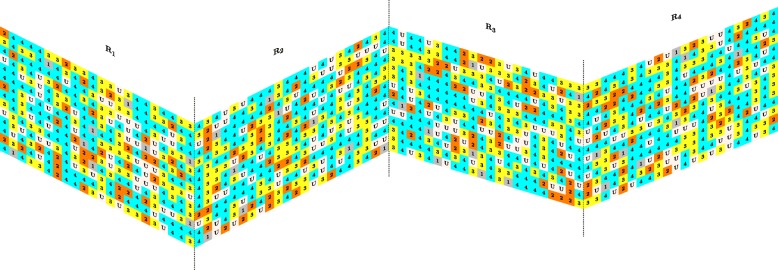
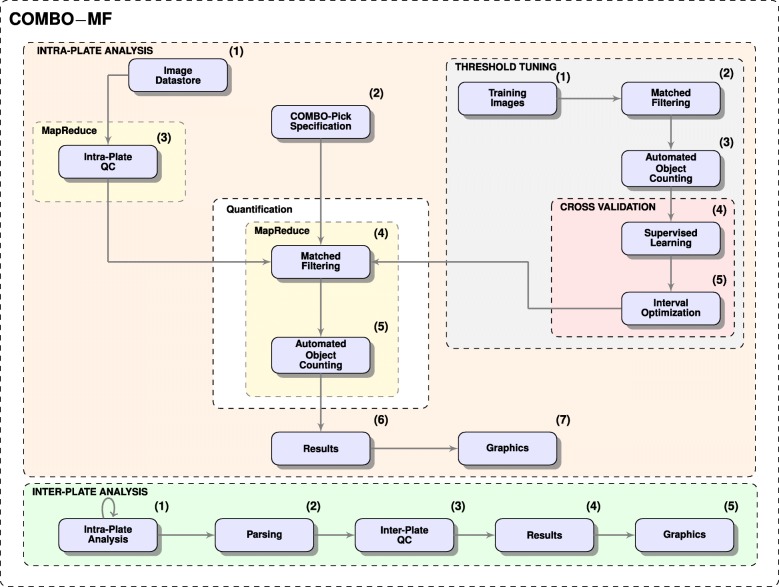
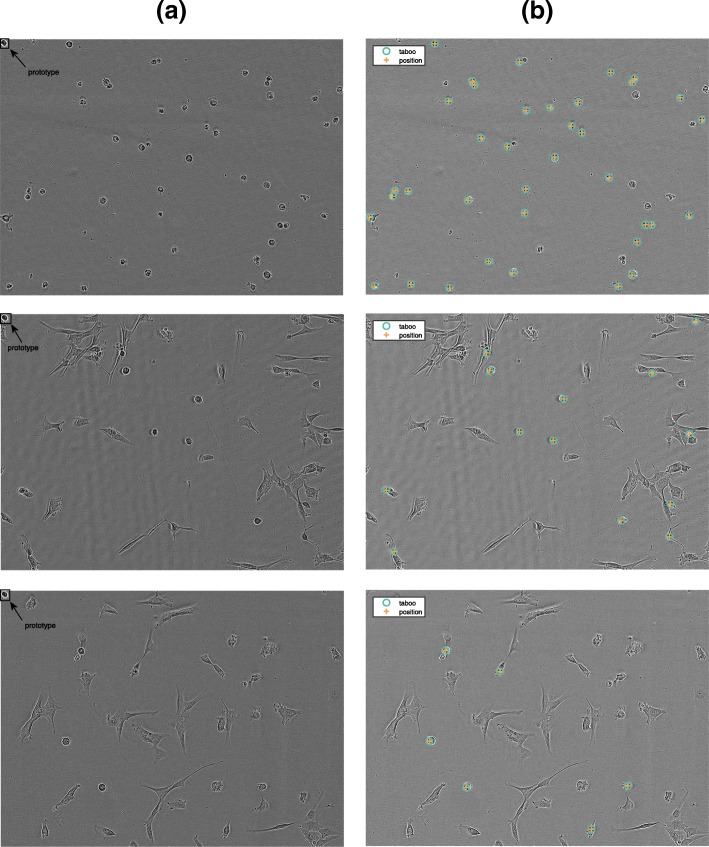
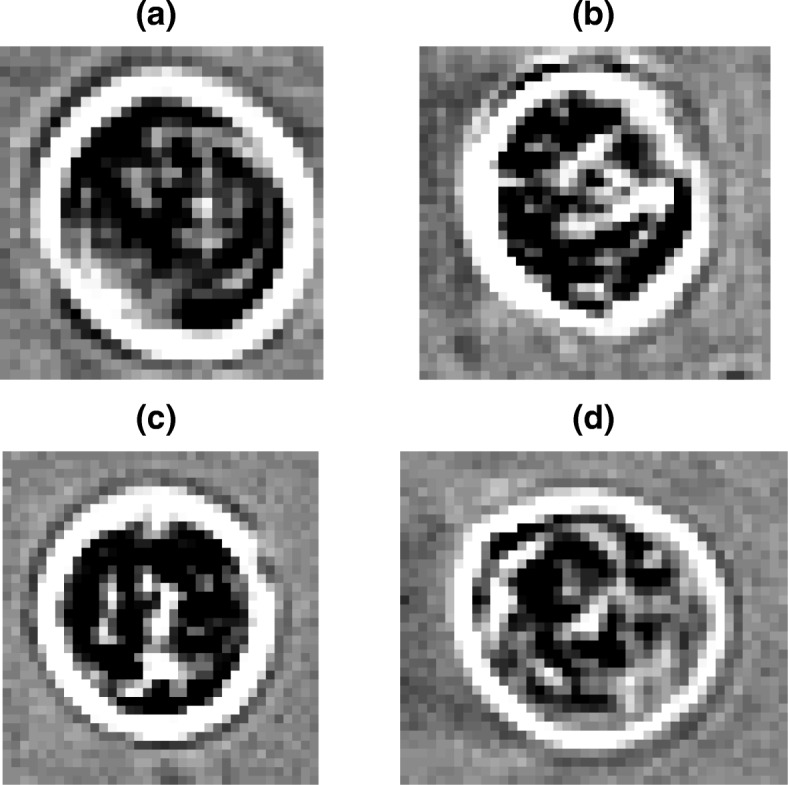
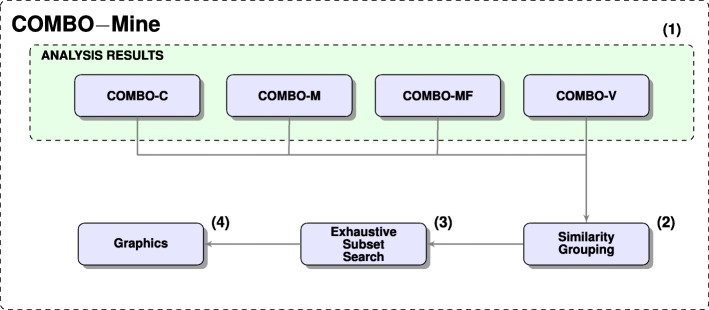
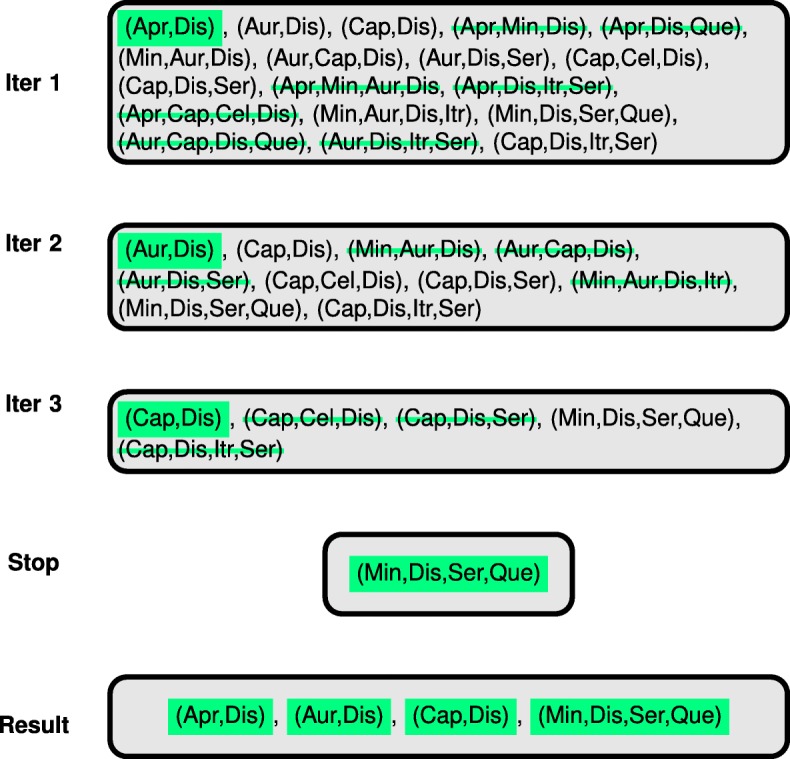
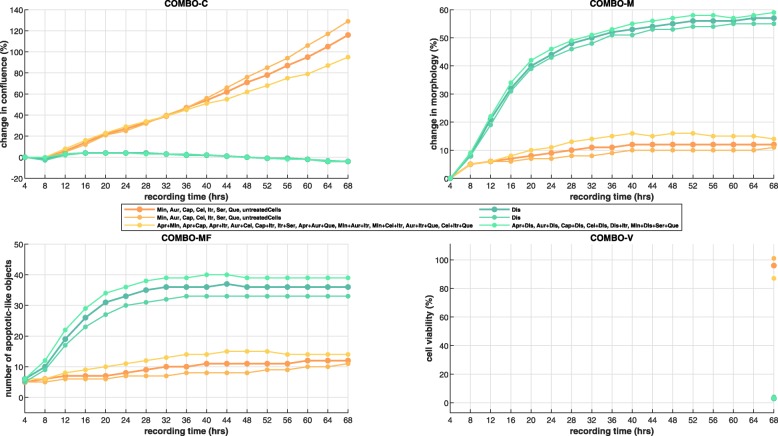
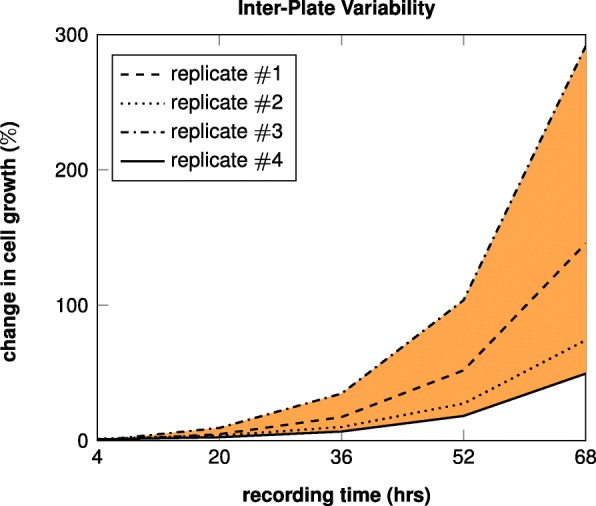
Results: Motivated by this, we developed COMBImage2, a parallel computational framework for higher-order drug combination analysis. COMBImage2 goes far beyond its predecessor COMBImage in many different ways. In particular, it offers automated 384-well plate design, as well as quality control that involves resampling statistics and inter-plate analyses. Moreover, it is equipped with a generic matched filter based object counting method that is currently designed for apoptotic-like cells. Furthermore, apart from higher-order synergy analyses, COMBImage2 introduces a novel data mining approach for identifying interesting temporal response patterns and disentangling higher- from lower- and single-drug effects. COMBImage2 was employed in the context of a small pilot study focused on the CUSP9v4 protocol, which is currently used in the clinic for treatment of recurrent glioblastoma. For the first time, all 246 possible combinations of order 4 or lower of the 9 single drugs consisting the CUSP9v4 cocktail, were evaluated on an in vitro clonal culture of glioma initiating cells.
Conclusions: COMBImage2 is able to automatically design and robustly analyze exhaustive and in general higher-order drug combination experiments. Such a versatile video microscopy oriented framework is likely to enable, guide and accelerate systematic large-scale drug combination studies not only for cancer but also other diseases.
Keywords: Automated plate design; CUSP9v4; Data mining; Glioblastoma; Higher-order drug combination analysis; Label-free time-lapse video microscopy; MapReduce; Matched filter; Resampling.
Conflict of interest statement
The authors declare that they have no competing interests.
Figures
Similar articles
-
COMBSecretomics: A pragmatic methodological framework for higher-order drug combination analysis using secretomics.PLoS One. 2020 May 14;15(5):e0232989. doi: 10.1371/journal.pone.0232989. eCollection 2020. PLoS One. 2020. PMID: 32407402 Free PMC article.
-
COMBImage: a modular parallel processing framework for pairwise drug combination analysis that quantifies temporal changes in label-free video microscopy movies.BMC Bioinformatics. 2018 Nov 26;19(1):453. doi: 10.1186/s12859-018-2458-x. BMC Bioinformatics. 2018. PMID: 30477419 Free PMC article.
-
[Development of antituberculous drugs: current status and future prospects].Kekkaku. 2006 Dec;81(12):753-74. Kekkaku. 2006. PMID: 17240921 Review. Japanese.
-
Discovering metric temporal constraint networks on temporal databases.Artif Intell Med. 2013 Jul;58(3):139-54. doi: 10.1016/j.artmed.2013.03.006. Epub 2013 May 6. Artif Intell Med. 2013. PMID: 23660232
-
Study of the impact of HIV genotypic drug resistance testing on therapy efficacy.Verh K Acad Geneeskd Belg. 2001;63(5):447-73. Verh K Acad Geneeskd Belg. 2001. PMID: 11813503 Review.
Cited by
-
COMBSecretomics: A pragmatic methodological framework for higher-order drug combination analysis using secretomics.PLoS One. 2020 May 14;15(5):e0232989. doi: 10.1371/journal.pone.0232989. eCollection 2020. PLoS One. 2020. PMID: 32407402 Free PMC article.
-
Charting the Fragmented Landscape of Drug Synergy.Trends Pharmacol Sci. 2020 Apr;41(4):266-280. doi: 10.1016/j.tips.2020.01.011. Epub 2020 Feb 26. Trends Pharmacol Sci. 2020. PMID: 32113653 Free PMC article. Review.
References
-
- Tekin E, Savage VM, Yeh PJ. Measuring higher-order drug interactions: A review of recent approaches. Curr Opin Syst Biol. 2017;4:16–23. doi: 10.1016/j.coisb.2017.05.015. - DOI
-
- Kast RE, Boockvar JA, Bruning A, Cappello F, Chang WW, Cvek B, Dou QP, Duenas-Gonzalez A, Efferth T, Focosi D, Ghaffari SH, Karpel-Massler G, Ketola K, Khoshnevisan A, Keizman D, Magne N, Marosi C, McDonald K, Munoz M, Paranjpe A, Pourgholami MH, Sardi I, Sella A, Srivenugopal KS, Tuccori M, Wang W, Wirtz CR, Halatsch ME. A conceptually new treatment approach for relapsed glioblastoma: coordinated undermining of survival paths with nine repurposed drugs (CUSP9) by the International Initiative for Accelerated Improvement of Glioblastoma Care. Oncotarget. 2013;4(4):502–30. doi: 10.18632/oncotarget.969. - DOI - PMC - PubMed
-
- Kast RE, Karpel-Massler G, Halatsch ME. CUSP9 treatment protocol for recurrent glioblastoma: aprepitant, artesunate, auranofin, captopril, celecoxib, disulfiram, itraconazole, ritonavir, sertraline augmenting continuous low dose temozolomide. Oncotarget. 2014;5(18):8052–82. doi: 10.18632/oncotarget.2408. - DOI - PMC - PubMed
-
- Peyrl A, Chocholous M, Azizi A, Kieran M, Nysom K, Sterba J, Sabel M, Czech T, Dieckmann K, Haberler C, Schmook M, Leiss U, Slavc I. MB-70 MEMMAT - A phase II study of metronomic and targeted anti-angiogenesis therapy for children with recurrent/progressive Medulloblastoma. Neuro-Oncology. 2016;18(Suppl 3):113. doi: 10.1093/neuonc/now076.66. - DOI
MeSH terms
Substances
Grants and funding
LinkOut - more resources
Full Text Sources
