. 2019 Jun 4;12(1):284.
doi: 10.1186/s13071-019-3529-1.

Toxoplasma gondii ROP18 inhibits human glioblastoma cell apoptosis through a mitochondrial pathway by targeting host cell P2X1

Affiliations

Toxoplasma gondii ROP18 inhibits human glioblastoma cell apoptosis through a mitochondrial pathway by targeting host cell P2X1

Li-Juan Zhou et al. Parasit Vectors. .

Abstract

Background: Apoptosis plays a critical role in the embryonic development, homeostasis of immune system and host defense against intracellular microbial pathogens. Infection by the obligate intracellular pathogen Toxoplasma gondii can both inhibit and induce host cell apoptosis; however, the parasitic factors involved remain unclear. The T. gondii virulence factor ROP18 (TgROP18) has been reported to regulate host cell apoptosis; nevertheless, results for this regulation have been rarely reported or have provided contradictory findings. Human purinergic receptor 1 (P2X1) is an ATP-gated ion channel that responds to ATP stimulation and functions in cell apoptosis mediation. The precise roles of TgROP18 in T. gondii pathogenesis, and the relationship between TgROP18 and host P2X1 in host cell apoptosis are yet to be revealed.

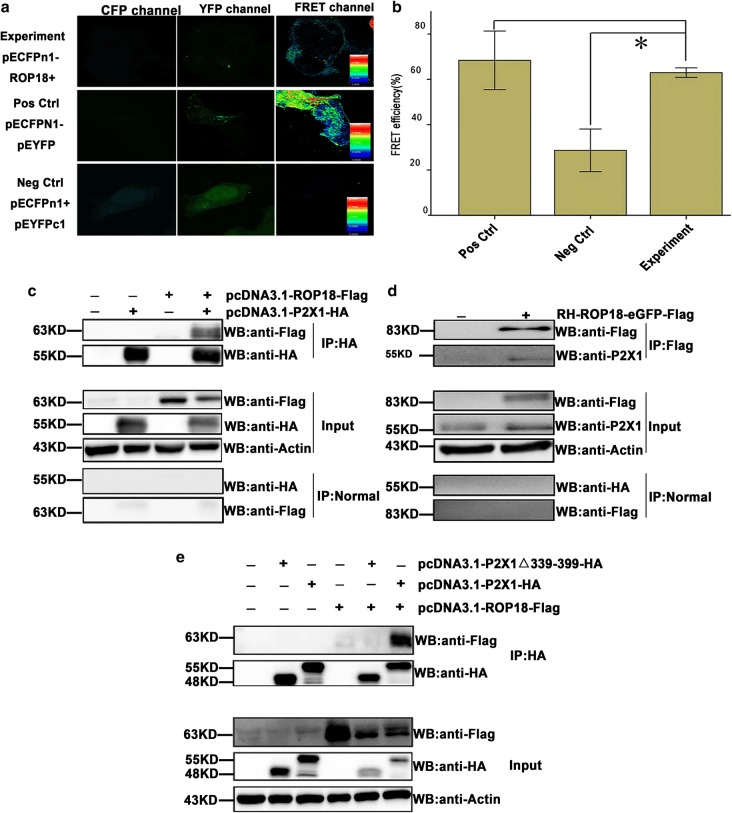
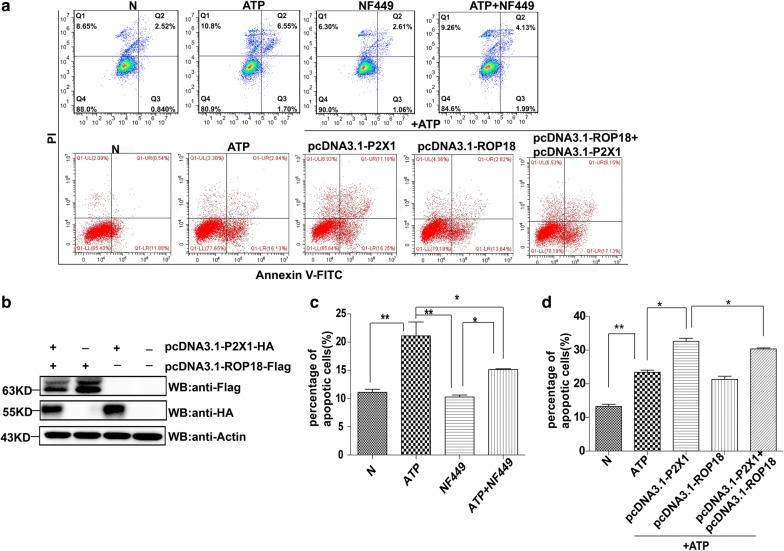
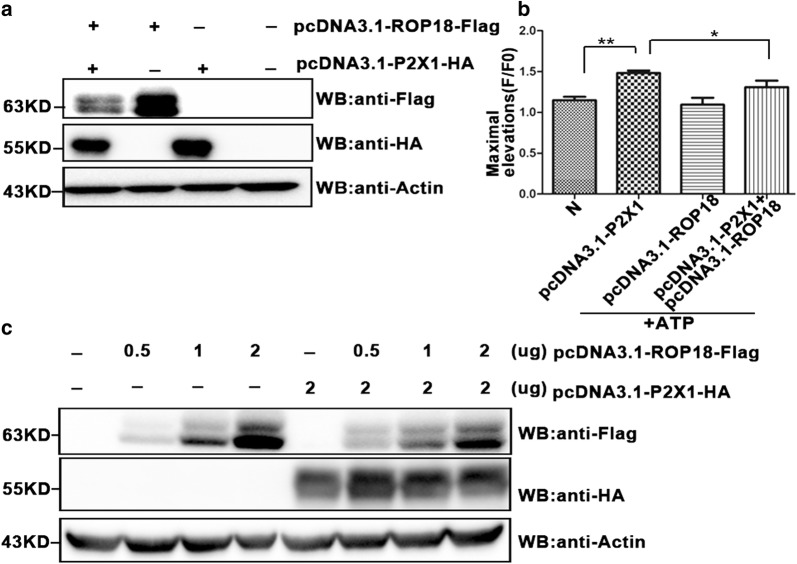
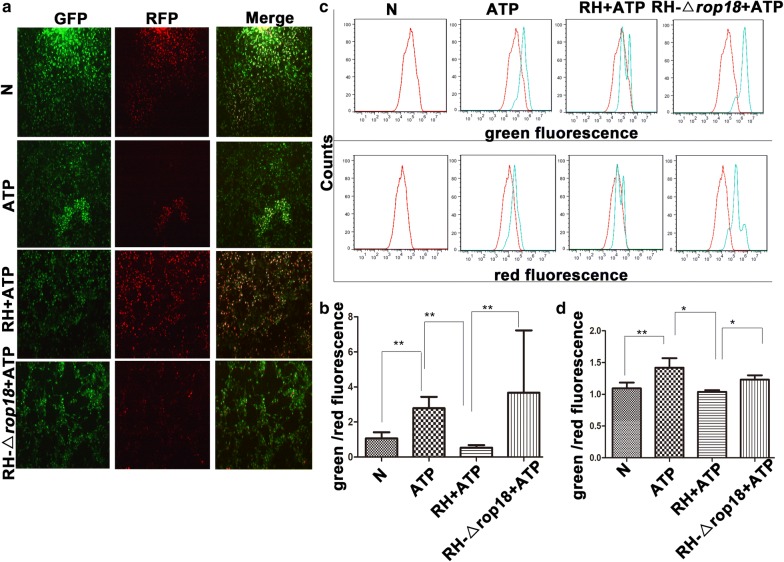
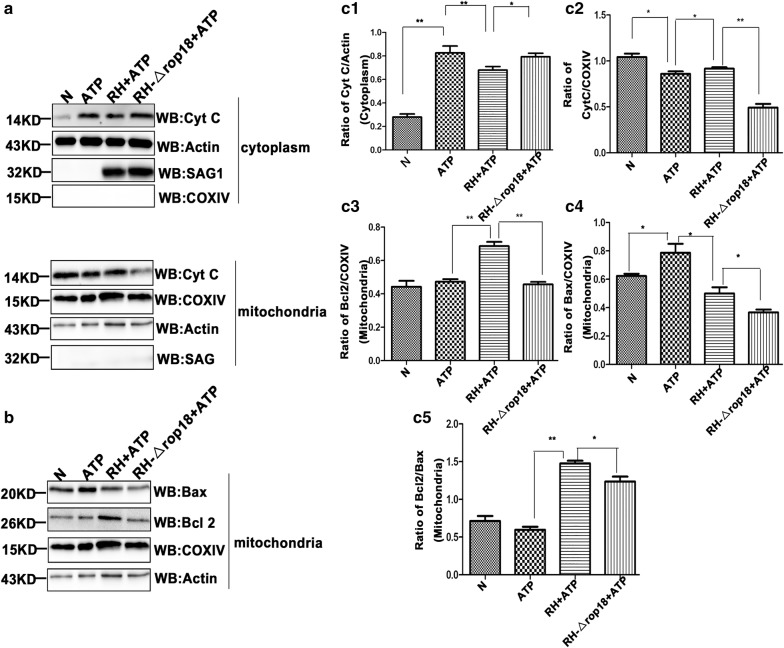
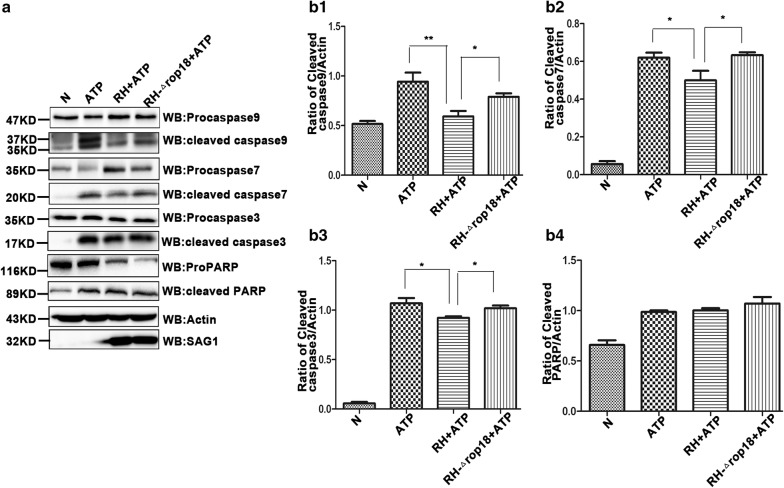
Methods: Apoptosis rates were determined by flow cytometry (FCM) and TUNEL assay. The interaction between TgROP18 and the host P2X1 was measured by fluorescence resonance energy transfer (FRET) and co-immunoprecipitation (co-IP) assay. Calcium influx and mitochondrial membrane depolarization were determined by FCM after JC-1 staining. The translocation of cytochrome C (Cyt C), Bax and Bcl2 proteins, expression of the apoptotic proteins PARP and caspase activation were detected by western blotting.

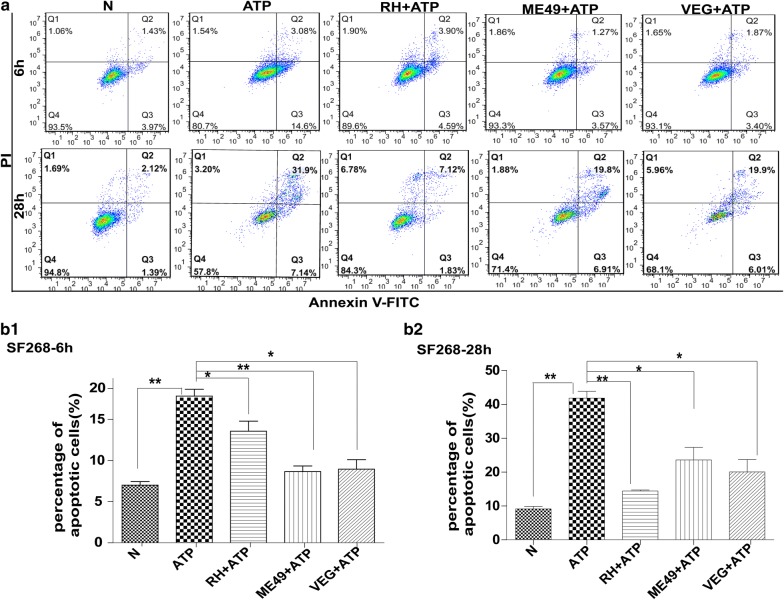
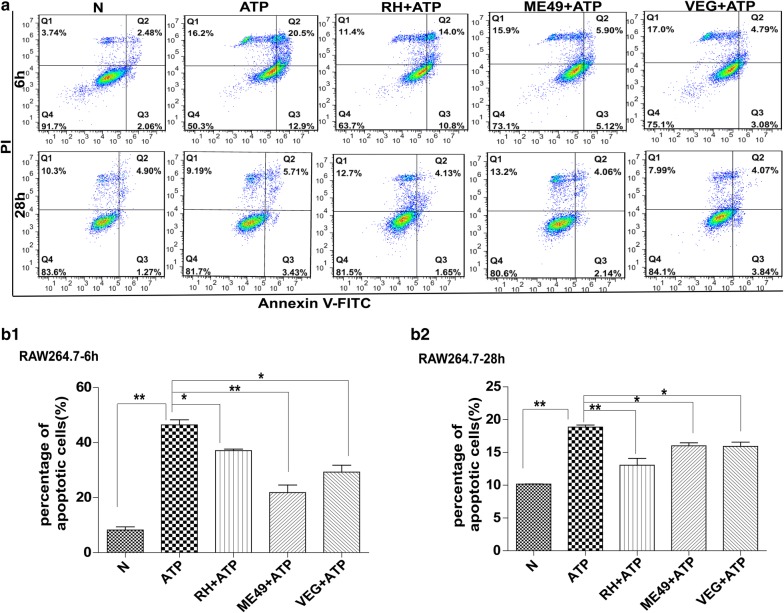
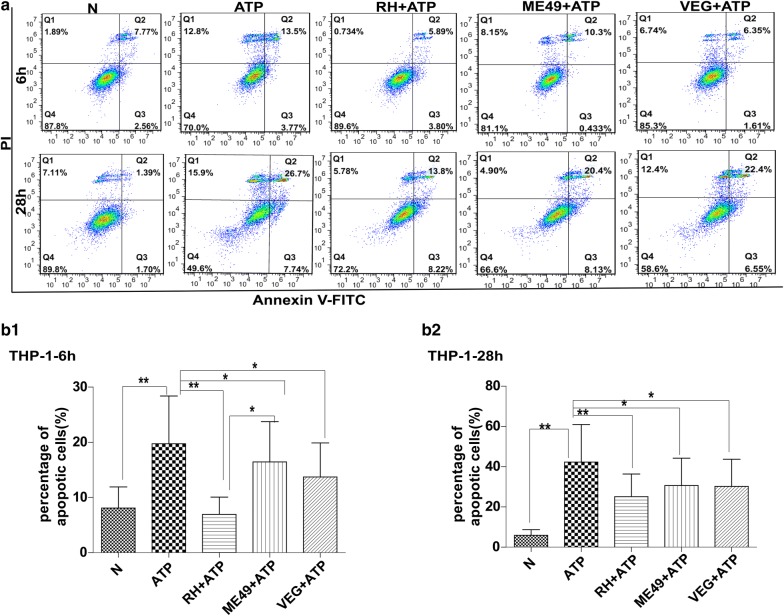
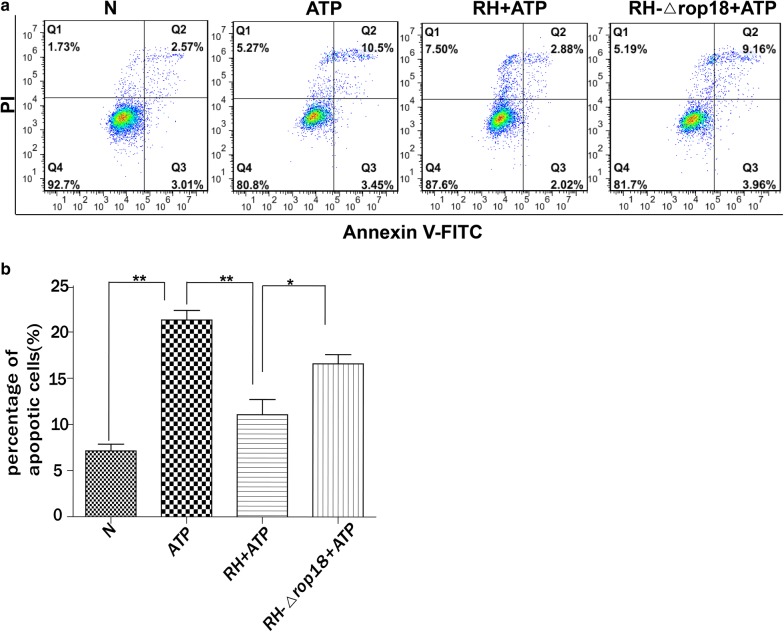
Results: The apoptosis rates of glial or immune cells (human SF268, mouse RAW264.7 and human THP-1 cells) infected by any T. gondii strain (RH-type I, ME49-type II and VEG-type III) were significantly inhibited compared with their uninfected controls. TgROP18 inhibited ATP-induced apoptosis of SF268 with P2X1 expression, but had no effect on RAW264.7 or THP-1 cells without detectable P2X1 expression. It was further identified that TgROP18 interacted with P2X1, and overexpression of ROP18 in COS7 cells significantly inhibited cell apoptosis mediated by P2X1. Moreover, TgROP18 also inhibited P2X1-mediated Ca2+ influx, translocation of cytochrome C from the mitochondria to the cytosol, and ATP-triggered caspase activation.

Conclusions: Toxoplasma gondii infection inhibits ATP-induced host cell apoptosis, regardless of strain virulence and host cell lines. TgROP18 targets the purinergic receptor P2X1 of the SF268 human neural cells and inhibits ATP-induced apoptosis through the mitochondrial pathway, suggesting a sensor role for the host proapoptotic protein P2X1 in this process.

Keywords: ATP; Apoptosis; Mitochondria; P2X1; ROP18; Toxoplasma gondii.


Conflict of interest statement

The authors declare that they have no competing interests.

Figures

Fig. 1
Fig. 1
Effects of T. gondii infection on ATP-induced apoptosis of human SF268 neural cells. SF268 cells were infected with the RH, ME49 or VEG strain of T. gondii (MOI = 3) for 2 or 22 h, followed by ATP induction for 4 or 6 h. The cells were harvested at 6 or 28 h post-infection for apoptosis measurement by flow cytometry after annexin V-FITC/PI staining. Representative flow cytometry data are presented in panel a and quantified in panels b1 and b2. The experiments were repeated four times. The values were analyzed using the Kruskal–Wallis H-test and Bonferroni correction (*P < 0.05, **P < 0.01)
Fig. 2
Fig. 2
Effects of T. gondii infection on ATP-induced apoptosis of mouse RAW264.7 macrophage cells. RAW264.7 cells were infected with the RH, ME49 or VEG strain of T. gondii and followed by ATP induction 4 or 6 h. The cells were harvested at 6 or 28 h post-infection for apoptosis measurement by flow cytometry after annexin V-FITC/PI staining. Representative flow cytometry data are presented in panel a and quantified in panels b1 and b2. The experiments were repeated four times. The values were analyzed using the Kruskal–Wallis H-test and Bonferroni correction (*P < 0.05, **P < 0.01)
Fig. 3
Fig. 3
Effects of T. gondii infection on ATP-induced apoptosis of human THP-1 immune cells. THP-1 cells were infected with the RH, ME49 or VEG strain of T. gondii and followed by ATP induction 4 or 6 h. The cells were harvested at 6 or 28 h post-infection for apoptosis measurement by flow cytometry after annexin V-FITC/PI staining. Representative flow cytometry data are presented in panel a and quantified in panels b1 and b2. The experiments were repeated four times. The values were analyzed using the Kruskal–Wallis H-test and Bonferroni correction (*P < 0.05, **P < 0.01)
Fig. 4
Fig. 4
Inhibition of ATP-induced apoptosis of human SF268 neural cells by the T. gondii virulence factor ROP18. SF268 cells were infected with RH or RH-Δrop18 tachyzoites (MOI = 13) and followed by ATP induction at 12 h post-infection. The controls included SF268 cells without any treatment (N) and SF268 cells with ATP induction but without T. gondii infection (ATP). Apoptosis was measured by flow cytometry after annexin V-FITC/PI staining. Representative flow cytometry data are presented in panel a and quantified in panel b. The experiments were repeated four times. The values were analyzed using the Kruskal–Wallis H-test and Bonferroni correction (*P < 0.05, **P < 0.01)
Fig. 5
Fig. 5
Identification of host P2X1 purinergic receptor as a TgROP18 target protein by FRET and co-IP. a Representative confocal FRET images. COS7 cells were cultured in plates the day before transfection. The experimental group was co-transfected with pECFP-N1-ROP18 and pEYFP-C1-P2X1, the negative control with pECFP-N1 and pEYFP-C1, and the positive control was transfected with pEYFP-CFP. The cells were fixed for confocal FRET measurement at 48 h post-infection. The vertical color bars represent FRET intensity, with red for a high FRET signal and blue for a low signal. b Quantitative analysis of FRET efficiency. c Co-IP analysis of COS7 cells transfected with pcDNA3.1-ROP18-3×Flag and/or pcDNA3.1-P2X1-HA. Lysates of the COS7 cells transiently transfected with the indicated plasmids or the control cells were immunoprecipitated with the anti-HA antibody and detected by western blotting with the indicated antibodies. d Co-IP analysis of SF268 cells infected with RH-ROP18-GFP-Flag. Lysates of the infected SF268 cells or the control cells were immunoprecipitated with anti-Flag antibody and detected by western blotting with the indicated antibodies. e Co-IP analysis of COS7 cells transfected with pcDNA3.1-ROP18-3×Flag and/or pcDNA3.1-P2X1-HA, pcDNA3.1-P2X1Δ339-399-HA. Lysates of the transfected COS7 cells or the control cells were immunoprecipitated with the anti-HA antibody and detected by western blotting with the indicated antibodies. The FRET efficiency was evaluated from 4 areas. The values were analyzed using the Kruskal–Wallis H-test and Bonferroni correction (*P < 0.05, **P < 0.01)
Fig. 6
Fig. 6
TgROP18 inhibition of host cell apoptosis promoted by P2X1. Four groups of SF268 cells were treated or not with ATP and/or NF449 as indicated. Five groups of COS7 cells were prepared. The N group is the normal COS7 cells. The other four groups were transfected with pcDNA3.1-ROP18 and/or pcDNA3.1-P2X1 and followed by treatment of ATP and/or NF449 as indicated. a Representative flow cytometry data. The apoptosis rate was measured after annexin V-FITC/PI staining. b Western blotting analysis of the expression of Flag-tagged ROP18 and HA-tagged P2X1 in COS7 cells. c, d Quantification of the flow cytometry data. The flow cytometry experiments were repeated four times. The values were analyzed using the Kruskal–Wallis H-test and Bonferroni correction (*P < 0.05, **P < 0.01)
Fig. 7
Fig. 7
TgROP18 inhibition of P2X1-mediated calcium influx. a Expression of Flag-tagged ROP18 and HA-tagged P2X1. COS7 cells were transfected with pcDNA3.1-P2X1-HA and/or pcDNA3.1-ROP18-3×Flag. Production of the ROP18 and P2X1 proteins was determined by western blotting. b Calcium influx measurement. The transfected cells in A were stimulated with ATP, and Ca2+ influx in each group was analyzed using flow cytometry. The maximum elevation (F/F0) of the intracellular Ca2+ were analyzed using the Kruskal–Wallis H-test and Bonferroni correction (*P < 0.05). c P2X1 protein integrity. COS7 cells were transfected with a stable amount (2.0 µg) of pcDNA3.1-P2X1-HA and sequentially co-transfected with 0, 0.5, 1.0 and 2.0 µg of pcDNA3.1-ROP18-3×Flag. The integrity of the proteins was analyzed by western blotting
Fig. 8
Fig. 8
TgROP18 inhibition of ATP-induced mitochondrial depolarization in SF268 cells. SF268 cells were infected with RH or RH-Δrop18 tachyzoites at MOI of 13 and followed by ATP induction of apoptosis. a Visualization of mitochondrial membrane depolarization by JC-1 staining and fluorescence microscopy (10×). c Flow cytometric analysis of mitochondrial membrane depolarization. b, d Quantification of mitochondrial membrane depolarization. The percentages of green to red fluorescence were determined using a fluorescence microscope and FCM for each group of cells. The experiments were repeated four times. The values were analyzed using the Kruskal–Wallis H-test and Bonferroni correction (**P < 0.01, *P < 0.05)
Fig. 9
Fig. 9
TgROP18 inhibition of Cyt C release from mitochondria to the cytosol in ATP-treated SF268 cells. SF268 cells were harvested and lysed, and the mitochondria and cytosol were fractionated. a, b Western blot analysis of protein distributions in the mitochondria and cytosol. The data represent one of the four repeated experiments. c Densitometric analysis of the western blotting images. In four repeated experiments, the ratios of Cyt C/actin, Cyt C/COXIV, Bcl2/COXIV, Bax/COXIV and Bcl2/Bax were calculated independently. Statistical analysis was performed using the Kruskal–Wallis H-test and Bonferroni correction (**P < 0.01, *P < 0.05) (c1, cytosolic fraction; c2c5 mitochondrial fraction)
Fig. 10
Fig. 10
TgROP18 inhibition of procaspase-3, procaspase-7 and procaspase-9 cleavage to form active caspases in ATP-treated SF268 cells. a Western blot analysis of procaspase cleavage. SF268 cells were prepared as described in Fig. 6. Cell lysates were used for western blot analysis. The antibodies used could recognize both the full-length and cleaved forms of their protein antigens. The molecular weights of the full-length and cleaved forms of the protein antigens are as follows. caspase-9: 47, 37, 35 kD; caspase-7: 35, 20 kD; caspase-3: 35, 17 kD; PARP: 116, 89 kD. Actin was used as a control, and SAG1 was used to evaluate the number of T. gondii tachyzoites, ensuring consistent numbers of host cells and tachyzoites in comparison groups. b Densitometric analysis of the western blotting images. Quantification was performed using ImageJ software, and the experiments were repeated four times for statistical analysis. The comparison the ratios of cleaved caspase-9/actin (b1), cleaved caspase-7/actin (b2), cleaved caspase-3/actin (b3), and cleaved PARP/actin (b4) between group was performed using the Kruskal–Wallis H-test and Bonferroni correction (**P < 0.01, *P < 0.05)

Similar articles

Cited by

References

    1. Dubey JP. History of the discovery of the life cycle of Toxoplasma gondii. Int J Parasitol. 2009;39:877–882. doi: 10.1016/j.ijpara.2009.01.005. - DOI - PubMed
    1. Montoya JG, Liesenfeld O. Toxoplasmosis. Lancet. 2004;363:1965–1976. doi: 10.1016/S0140-6736(04)16412-X. - DOI - PubMed
    1. Ajzenberg D, Banuls AL, Su C, Dumetre A, Demar M, Carme B, et al. Genetic diversity, clonality and sexuality in Toxoplasma gondii. Int J Parasitol. 2004;34:1185–1196. doi: 10.1016/j.ijpara.2004.06.007. - DOI - PubMed
    1. Howe DK, Summers BC, Sibley LD. Acute virulence in mice is associated with markers on chromosome VIII in Toxoplasma gondii. Infect Immun. 1996;64:5193–5198. - PMC - PubMed
    1. Luder CG, Gross U, Lopes MF. Intracellular protozoan parasites and apoptosis: diverse strategies to modulate parasite-host interactions. Trends Parasitol. 2001;17:480–486. doi: 10.1016/S1471-4922(01)02016-5. - DOI - PubMed

Substances