. 2019 Jun 4;21(1):136.
doi: 10.1186/s13075-019-1904-0.

Metformin improves salivary gland inflammation and hypofunction in murine Sjögren's syndrome

Affiliations

Metformin improves salivary gland inflammation and hypofunction in murine Sjögren's syndrome

Ji-Won Kim et al. Arthritis Res Ther. .

Abstract

Background: Activated T and B cells participate in the development and progression of Sjögren's syndrome (SS). Metformin, a first-line anti-diabetic drug, exerts anti-inflammatory and immunomodulatory effects by activating AMPK. We investigated the therapeutic effect of metformin in non-obese diabetic (NOD)/ShiLtJ mice, an animal model of SS.

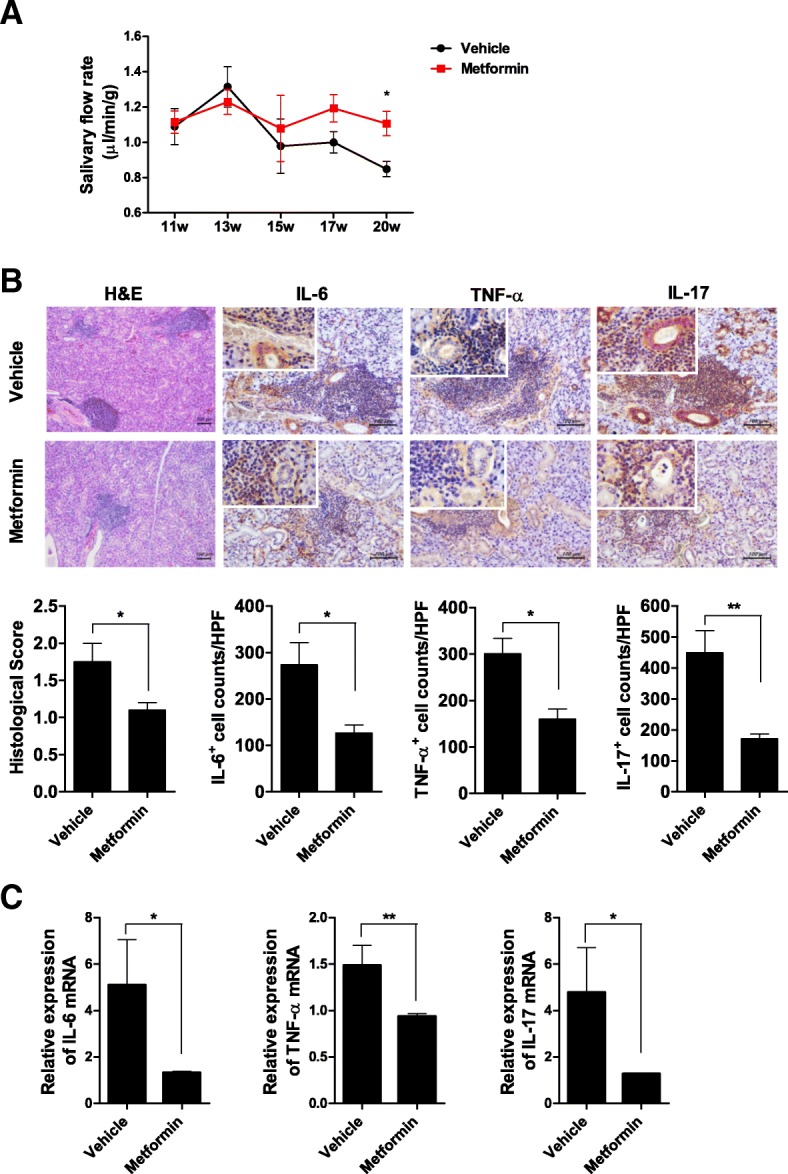
Methods: Metformin or vehicle was administered orally to the mice for 9 weeks. The salivary flow rate was measured at 11, 13, 15, 17, and 20 weeks. Histological analysis of the salivary glands from vehicle- and metformin-treated mice was conducted. CD4+ T and B cell differentiation in the peripheral blood and/or spleen was determined by flow cytometry. Serum total IgG, IgG1, and IgG2a levels were determined by enzyme-linked immunosorbent assay.

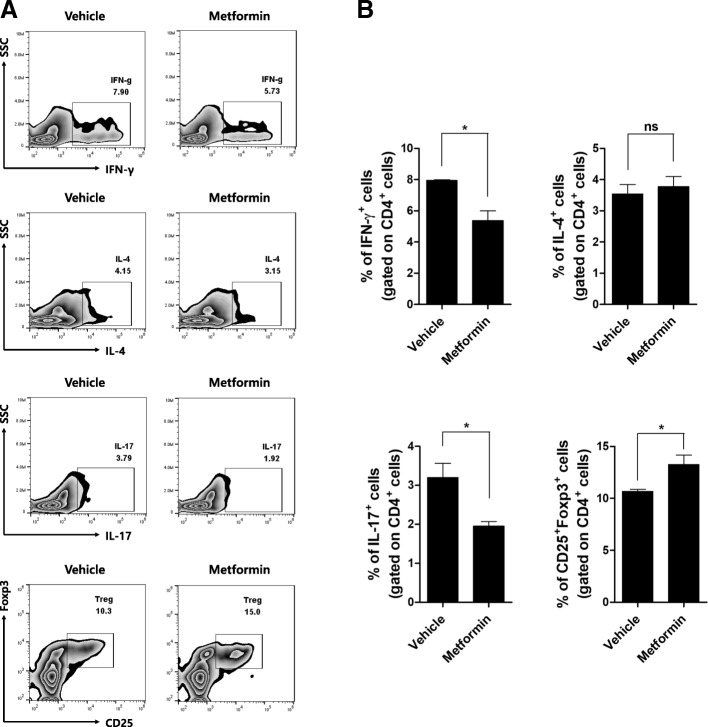
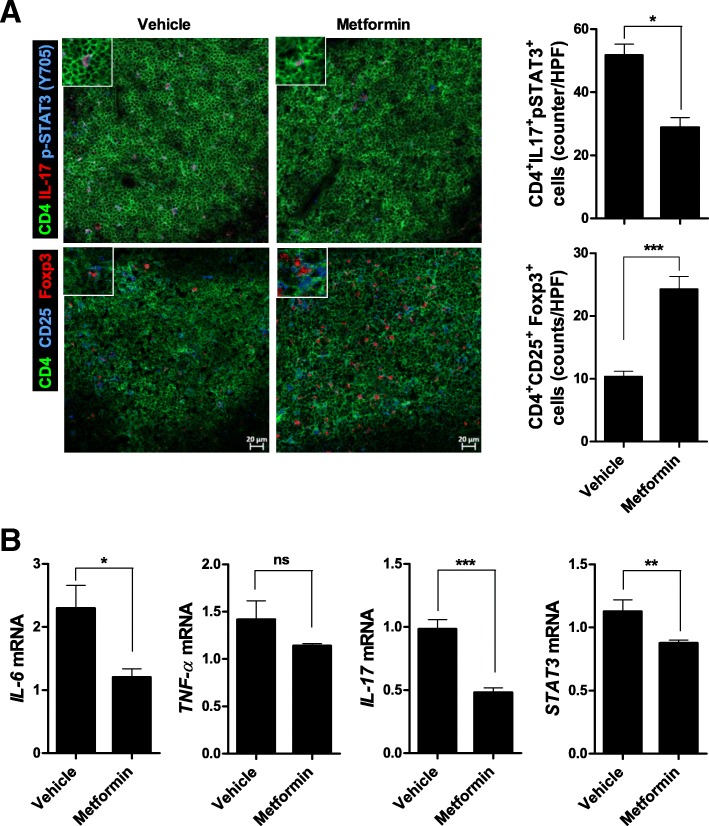
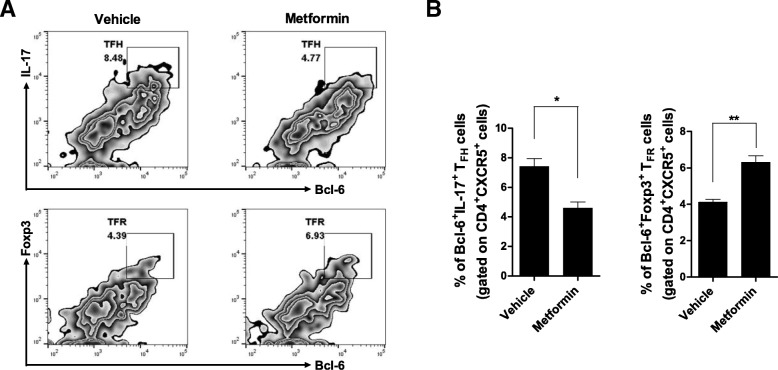
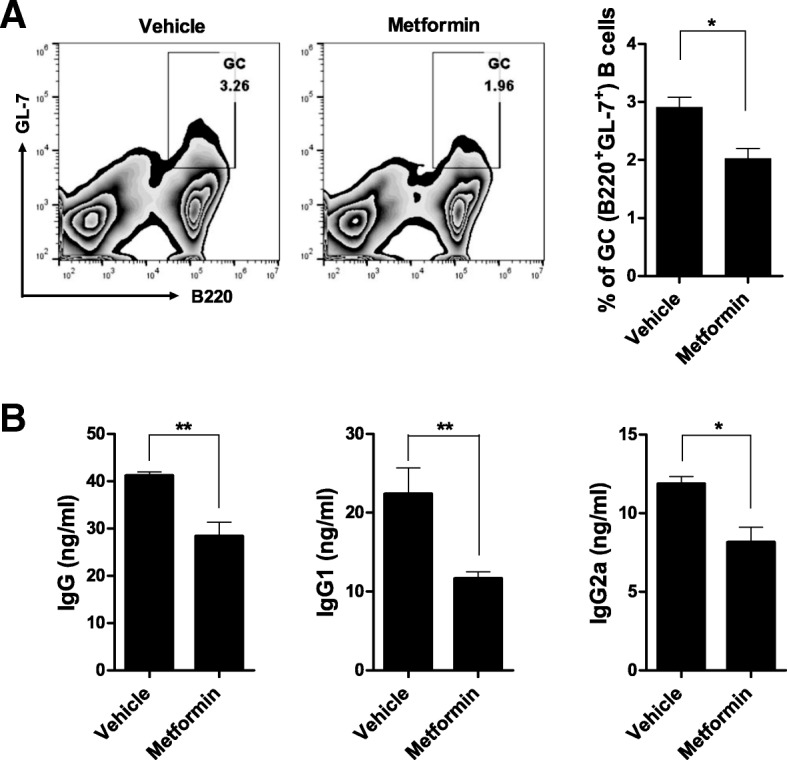
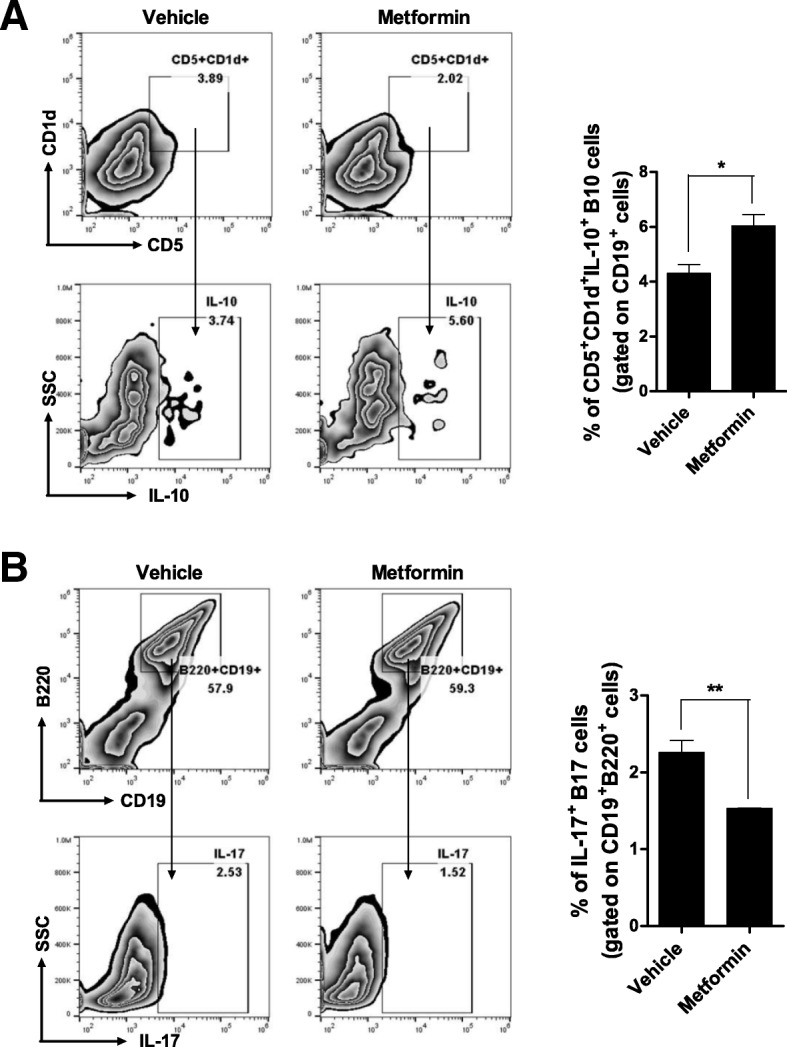
Results: Metformin reduced salivary gland inflammation and restored the salivary flow rate. Moreover, metformin reduced the interleukin (IL)-6, tumor necrosis factor-α, IL-17 mRNA, and protein levels in the salivary glands. Metformin reduced the Th17 and Th1 cell populations and increased the regulatory T cell population in the peripheral blood and spleen and modulated the balance between Tfh and follicular regulatory T cells. In addition, metformin reduced B cell differentiation into germinal center B cells, decreased the serum immunoglobulin G level, and maintained the balance between IL-10- and IL-17-producing B cells.

Conclusion: Metformin suppresses effector T cells, induces regulatory T cells, and regulates B cell differentiation in an animal model of SS. In addition, metformin ameliorates salivary gland inflammation and hypofunction, suggesting that it has potential for the treatment of SS.

Keywords: AMP-activated protein kinase; B-lymphocyte; Metformin; STAT3; Sjögren’s syndrome; TOR serine-threonine kinase; Th17 cells.


Conflict of interest statement

The authors declare that they have no competing interests.

Figures

Fig. 1
Fig. 1
Metformin improves the salivary flow rate and salivary gland inflammation. a Eleven-week-old mice were orally administered vehicle or 50 mg/kg metformin daily for 9 weeks. The salivary flow rate was measured for 7 min at 11, 13, 15, 17, and 20 weeks (n = 5 per group at each time point). Symbols indicate means, and bars indicate SEMs. Data are representative of the two independent experiments. b Histological analysis of the salivary glands from vehicle- and metformin-treated mice (at 20 weeks of age, n = 5 per group) was conducted by hematoxylin and eosin staining (original magnification, × 100) and immunohistochemical staining for IL-6, TNF-α, and IL-17 (original magnification, × 200; insets, × 400). Histological score and numbers of IL-6-, TNF-α-, and IL-17-expressing (positive) cells are shown; scale bar, 100 μm. c IL-6, TNF-α, and IL-17 mRNA levels in the salivary glands, as determined by real-time PCR. Data are means ± SEMs. Data are representative of three independent experiments (*p < 0.05, **p < 0.01)
Fig. 2
Fig. 2
Metformin controls CD4+ T cell differentiation into effector or regulatory T cells in the peripheral blood. a Eleven-week-old mice were orally administered vehicle or 50 mg/kg metformin daily for 9 weeks (n = 5 per group). Next, PBMCs were stained with antibodies against CD4, IFN-γ, IL-4, IL-17, CD25, or Foxp3 and subjected to flow cytometry. Dot plots gated on CD4+ T cell population showed CD4+IFN-γ+ (Th1), CD4+IL-4+ (Th2), CD4+IL-17+ (Th17), and CD4+CD25+Foxp3+ (Treg) cells. Numbers in the plots indicate percentages of gated cells. The data were pre-gated on live single cells. b Data are means ± SEMs. Data are representative of three independent experiments (*p < 0.05)
Fig. 3
Fig. 3
Metformin suppresses splenic Th17 cell populations and enhances Treg populations. a Eleven-week-old mice were orally administered vehicle or 50 mg/kg metformin daily for 9 weeks (n = 5 per group). The spleens were removed and reacted with antibodies against CD4, IL-17, p-STAT3 (Y705), CD25 or Foxp3. CD4+IL-17+p-STAT3 (Y705)+ (Th17) cells and CD4+CD25+Foxp3+ (Treg) cells were analyzed by confocal laser microscopy (original magnification, × 200; insets, × 400). b Splenic IL-6, TNF-α, IL-17, and STAT3 mRNA levels in vehicle- and metformin-administered mice, as determined by real-time PCR. Data are means ± SEMs. Data are representative of three independent experiments (*p < 0.05, **p < 0.01, ***p < 0.001)
Fig. 4
Fig. 4
Metformin regulates the balance between Tfh cells and Tfr cells in vitro. a Splenocytes from NOD/ShiLtJ mice were cultured for 3 days with anti-CD3 and anti-CD28 antibodies in the presence or absence of 1 mM metformin (n = 3 per group). The cells were next reacted with antibodies against CD4, CXCR5, Bcl-6, IL-17, or Foxp3. The frequencies of Tfh cells (Bcl6+IL-17+ cells gated on CD4+CXCR5+ T cell population) and Tfr cells (Bcl6+Foxp3+ cells gated on CD4+CXCR5+ T cell population) are shown. Numbers in the plots indicate percentages of gated cells. The data were pre-gated on live single cells. b Data are means ± SEMs. Data are representative of three independent experiments (*p < 0.05, **p < 0.01)
Fig. 5
Fig. 5
Metformin suppresses Ig isotype switching and B cell differentiation into GC B cells. a Eleven-week-old mice were orally administered vehicle or 50 mg/kg metformin daily for 9 weeks (n = 5 per group). PBMCs were isolated, reacted with antibodies to B220 and GL-7, and subjected to flow cytometry to identify B220+GL7+ GC B cells. The data were pre-gated on live single cells. b Serum total IgG, IgG1, and IgG2a levels in NOD/ShiLtJ mice administered with metformin (n = 5) or vehicle (n = 5), as determined by ELISA (mouse serum was diluted 100,000-fold). Data are means ± SEMs. Data are representative of three independent experiments (*p < 0.05, **p < 0.01)
Fig. 6
Fig. 6
Metformin regulates the balance between IL-10- and IL-17-producing B cells in vitro. a, b Splenocytes from NOD/ShiLtJ mice were cultured for 3 days with LPS in the presence or absence of 1 mM metformin (n = 3 per group) and subsequently reacted with antibodies against B220, CD19, CD5, CD1d, IL-10, and IL-17. The frequencies of B10 cells (CD5+ CD1d+IL-10+ cells gated on CD19+ cell population) and B17 cells (IL-17+ cells gated on CD19+B220+ cell population) were analyzed. The data were pre-gated on live single cells. Data are means ± SEMs. Data are representative of three independent experiments (*p < 0.05, **p < 0.01)

References

    1. Mariette X, Criswell LA. Primary Sjogren’s syndrome. N Engl J Med. 2018;378(10):931–939. doi: 10.1056/NEJMcp1702514. - DOI - PubMed
    1. Nocturne G, Mariette X. Advances in understanding the pathogenesis of primary Sjogren’s syndrome. Nat Rev Rheumatol. 2013;9(9):544–556. doi: 10.1038/nrrheum.2013.110. - DOI - PubMed
    1. Pontarini E, Lucchesi D, Bombardieri M. Current views on the pathogenesis of Sjogren’s syndrome. Curr Opin Rheumatol. 2018;30(2):215–221. doi: 10.1097/BOR.0000000000000473. - DOI - PubMed
    1. Zhou G, Myers R, Li Y, Chen Y, Shen X, Fenyk-Melody J, et al. Role of AMP-activated protein kinase in mechanism of metformin action. J Clin Invest. 2001;108(8):1167–1174. doi: 10.1172/JCI13505. - DOI - PMC - PubMed
    1. Madiraju AK, Erion DM, Rahimi Y, Zhang XM, Braddock DT, Albright RA, et al. Metformin suppresses gluconeogenesis by inhibiting mitochondrial glycerophosphate dehydrogenase. Nature. 2014;510(7506):542–546. doi: 10.1038/nature13270. - DOI - PMC - PubMed

Publication types

MeSH terms