. 2019 Jun 4;10(3):e01031-19.
doi: 10.1128/mBio.01031-19.

Indole Signaling at the Host-Microbiota-Pathogen Interface

Affiliations

Indole Signaling at the Host-Microbiota-Pathogen Interface

Aman Kumar et al. mBio. .

Erratum in

Abstract

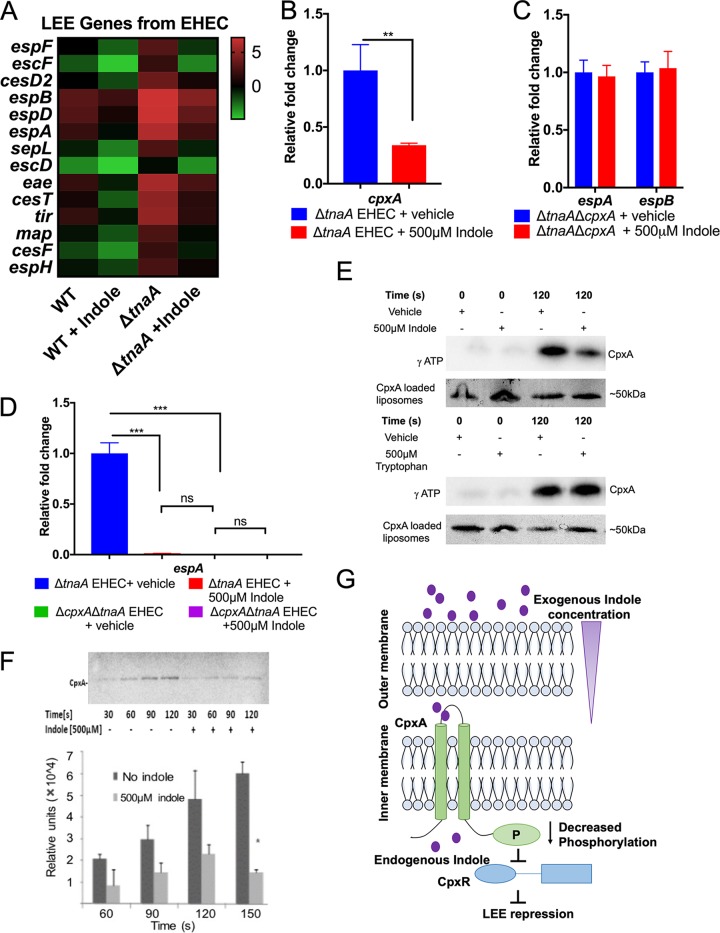
Microbial establishment within the gastrointestinal (GI) tract requires surveillance of the gut biogeography. The gut microbiota coordinates behaviors by sensing host- or microbiota-derived signals. Here we show for the first time that microbiota-derived indole is highly prevalent in the lumen compared to the intestinal tissue. This difference in indole concentration plays a key role in modulating virulence gene expression of the enteric pathogens enterohemorrhagic Escherichia coli (EHEC) and Citrobacter rodentium Indole decreases expression of genes within the locus of enterocyte effacement (LEE) pathogenicity island, which is essential for these pathogens to form attaching and effacing (AE) lesions on enterocytes. We synthetically altered the concentration of indole in the GI tracts of mice by employing mice treated with antibiotics to deplete the microbiota and reconstituted with indole-producing commensal Bacteroides thetaiotaomicron (B. theta) or a B. theta ΔtnaA mutant (does not produce indole) or by engineering an indole-producing C. rodentium strain. This allowed us to assess the role of self-produced versus microbiota-produced indole, and the results show that decreased indole concentrations promote bacterial pathogenesis, while increased levels of indole decrease bacterial virulence gene expression. Moreover, we identified the bacterial membrane-bound histidine sensor kinase (HK) CpxA as an indole sensor. Enteric pathogens sense a gradient of indole concentrations in the gut to probe different niches and successfully establish an infection.IMPORTANCE Pathogens sense and respond to several small molecules within the GI tract to modulate expression of their virulence repertoire. Indole is a signaling molecule produced by the gut microbiota. Here we show that indole concentrations are higher in the lumen, where the microbiota is present, than in the intestinal tissue. The enteric pathogens EHEC and C. rodentium sense indole to downregulate expression of their virulence genes, as a read-out of the luminal compartment. We also identified the bacterial membrane-bound HK CpxA as an indole sensor. This regulation ensures that EHEC and C. rodentium express their virulence genes only at the epithelial lining, which is the niche they colonize.

Keywords: Citrobacter rodentium; CpxA; enterohemorrhagic E. coli (EHEC); indole; locus of enterocyte effacement (LEE); microbiota.


Figures

FIG 1
FIG 1
An indole concentration gradient is important to regulate virulence gene expression. (A, top) Schematic of the LEE pathogenicity island (LEE1 to LEE5 operons) and the representative virulence genes used in qRT-PCR experiments. (Bottom) Cartoon depicts the type III secretion system (encoded by the LEE) used by EHEC to inject bacterial effectors into the host cell. (B) Schematic representation for the indole concentration gradient in the human gut. Indole is produced by the microbiota in the lumen, where its concentration is higher. It is absorbed by epithelial cells, with its concentration decreasing at the epithelial lining. (C and D) Mass spectrometry measurement of indole and tryptophan (Trp) concentrations from colon tissues (CT) and colon content (CC) of C3H/HeJ mice before infection (C) and day 4 postinfection (D). Two-tailed unpaired t test was used to perform statistical analysis (n = 3 or 4 mice per group). Error bars represent standard errors of means (SEM). Values that are significantly different (P < 0.05) are indicated by a bar and asterisk. Values that are not significantly different (ns) are indicated. (E) Scheme of the EHEC tna operon depicting indole production resulting from tryptophan metabolism. (F) qRT-PCR for the expression of select virulence genes under increasing indole concentrations ranging from 1 to 250 μM. P values were determined by using one-way ANOVA followed by Bonferroni’s multiple-comparison test. Error bars represent standard deviations (SD). *, P < 0.05; **, P < 0.01. Experiments were performed in anaerobic conditions using low-glucose DMEM, and samples were harvested in late log phase. Data are representative of at least three independent experiments with three biological replicates and three technical replicates. Fold change were calculated relative to rpoA as an internal control. See also Fig. S1 in the supplemental material. (G) qRT-PCR for the expression of select virulence genes grown with 500 μM indole. Statistics were performed using unpaired t test followed by multiple comparison by Bonferroni-Dunn method. ***, P < 0.001. Experiments were performed under anaerobic conditions using low-glucose DMEM, and samples were harvested in late log phase. Data are representative of at least three independent experiments with three biological replicates and three technical replicates. Fold change were calculated relative to rpoA as an internal control. See also Fig. S1. (H) qRT-PCR analysis for the expression of virulence genes with various tryptophan concentrations. Statistics were calculated using ANOVA followed by Bonferroni’s multiple-comparison test. (F, G, and H) Experiments were performed in anaerobic conditions using low-glucose DMEM, and samples were harvested in late log phase. Data are representative of at least three independent experiments with three biological replicates and three technical replicates. Fold change were calculated relative to rpoA as an internal control. See also Fig. S1.
FIG 2
FIG 2
Indole decreases the expression of virulence genes. (A) qRT-PCR analysis to compare the expression of select virulence genes from WT EHEC, ΔtnaA EHEC, ptna (tna gene on a plasmid). Experiments were performed under anaerobic conditions using low-glucose DMEM, and samples were harvested in late log phase. Data are representative of at least three independent experiments with three biological replicates and three technical replicates. Fold change was calculated relative to rpoA as an internal control. Statistical analysis was performed using one-way ANOVA, followed by Bonferroni’s multiple-comparison test. ***, P < 0.001. (B) Western blot analysis of secreted protein EspB. EHEC (WT, ΔtnaA, or ptna) were grown in low-glucose DMEM under anaerobic conditions. Cells were harvested in late logarithmic phase at the same OD600 (same number of bacterial cells), and supernatants were concentrated for secreted proteins. BSA is used as a loading control to ensure no variability in the concentration step. αEspB, anti-EspB antibody. (C) Fluorescein actin staining analysis. HeLa cells were infected with WT EHEC, ΔtnaA EHEC, or ptna EHEC. At 5 h postinfection, cells were washed and stained with FITC-phalloidin to visualize actin (green) and propidium iodide to stain for bacteria and nuclei (red). Pedestals were visualized as green puncta (white arrows). Pedestals were enumerated for each field, with each field containing approximately 20 cells. The number of pedestals per infected cell was quantified (n = 3). Error bars represent standard deviations. **, P < 0.01 by one-way ANOVA. (D) qPCR for assessing the effect of addition of 500 μM indole on virulence gene expression of WT EHEC grown anaerobically. Statistical analysis was performed using unpaired t test, followed by multiple comparison by Bonferroni-Dunn method. *, P < 0.05; **, P < 0.01; ***, P < 0.001. (E) qRT-PCR expression analysis of select virulence genes from WT EHEC, ΔtnaA EHEC, and ΔtnaA EHEC with 500 μM exogenously added indole. Bacterial cells were grown under anaerobic conditions. Statistical significance was calculated using one-way ANOVA, followed by Bonferroni’s multiple-comparison test. *, P < 0.05; **, P < 0.01; ***, P < 0.001; ****, P < 0.0001. (F) Western blot comparison of the secreted protein EspB from WT and ΔtnaA EHEC grown anaerobically in the presence or absence of 500 μM indole. BSA was used as a loading control. All qRT-PCR data are representative of at least three independent experiments with three biological replicates and three technical replicates. Fold change was calculated relative to an internal control rpoA. Error bars represent standard deviations. See also Fig. S1 and S2.
FIG 3
FIG 3
Intracellular and extracellular indole levels in EHEC. (A and B) Mass spectrometry measurement of indole and tryptophan obtained from the cellular fractions. WT EHEC, ΔtnaA EHEC, and ΔtnaA EHEC with 500 μM indole were grown anaerobically in low-glucose DMEM. After 5 h, cells were centrifuged to separate the cellular and supernatant fractions. (A) Addition of 500 μM indole to ΔtnaA EHEC rescued the WT levels of indole in the cellular fraction. (B) Tryptophan concentrations were measured as a control. The heat map to the right indicates the results of RNA sequencing analysis, revealing a decrease in the expression of tryptophan biosynthesis genes (trp operon) in the presence of indole. Statistics were performed using one-way ANOVA. (C) Mass spectrometry measurement of indole obtained from the supernatant fraction. Statistics were performed using unpaired t test. (D) Tryptophan concentration obtained from the supernatant fraction. Note that the concentration of tryptophan in DMEM is 78.431 μM. One-way ANOVA was performed to calculate statistical significance. Values that are significantly different are indicated by asterisks as follows: **, P < 0.01; ***, P < 0.001. n = 3 per group. Error bars indicate standard deviations (SD). See also Fig. S1.
FIG 4
FIG 4
Indole regulates the virulence gene expression of EHEC through the histidine sensor kinase CpxA. (A) Heat map showing expression of LEE genes. WT EHEC and ΔtnaA EHEC in the presence or absence of 500 μM indole were grown until late logarithmic phase anaerobically. RNA sequencing was performed on the extracted RNA, and data analysis were conducted using ArrayStar. (B) qRT-PCR analysis on cpxA confirming that the presence of indole decreases its expression. △tnaA EHEC was grown anaerobically in the presence or absence of 500 μM indole. Statistical significance was calculated using unpaired t test. **, P < 0.05. (C) qRT-PCR showing that indole has no further effect on LEE4 (espA and espB) transcription in the absence of the CpxA sensor under anaerobic growth conditions. (D) qRT-PCR analysis comparing the expression of espA in the absence of cpxA with or without indole during anaerobic growth. Statistical analysis was performed using one-way ANOVA. In panels B to D, ΔtnaA EHEC was used as a background strain to avoid interference of endogenous indole. Fold change was calculated relative to rpoA as an internal control. All data are representative of two independent experiments with three biological and three technical replicates. Error bars represent standard deviations (SD). Values that are significantly different are indicated by asterisks as follows: **, P < 0.01; ***, P < 0.001. Values that are not significantly different (ns) are indicated. (E) Autophosphorylation of CpxA (loaded in liposomes) in the presence or absence of 500 μM (each) indole and tryptophan. Samples were run on 12% stain-free SDS-PAGE gel. CpxA loaded liposomes were visualized using Chemi Doc. Autoradiographs were obtained by using a phosphorimager. Data are representative of three independent experiments. (F) Time course for the autophosphorylation of CpxA (loaded in liposomes) in the presence or absence of indole. Autophosphorylation signal was quantified using Image Quant. Results were compared by unpaired t test, followed by multiple comparison by Bonferroni-Dunn method (n = 3). Error bars indicate SD. *, P < 0.05. (G) Schematic representation for indole signaling. High indole concentrations allow indole to cross the outer membrane of the enteric pathogens EHEC and C. rodentium. The histidine kinase CpxA in the inner membrane senses the presence of indole and decrease its phosphorylation leading to its decreased downstream activity and subsequent LEE repression. See also Fig. S4 and S5.
FIG 5
FIG 5
Indole limits C. rodentium colonization and pathogenesis in mice. (A) Colonization of C3H/HeJ mice with either WT C. rodentium or C. rodentium with the tna operon in microbiota-depleted mice. P value was determined by using Mann-Whitney U test. Each symbol represents the value for an individual mouse. Error bars indicate standard errors of means (SEM). (B) Survival analysis of mice infected with either WT C. rodentium or C. rodentium with the tna operon. A total of n = 15 mice per group were used for the study. Statistical significance was calculated using log rank (Mantel-Cox) test. ****, P < 0.0001. (C and D) Expression of bacterial virulence genes during murine infection. Stools from mice infected with either WT C. rodentium or C. rodentium with tna operon were collected, and RNA was extracted. qRT-PCR analysis was performed on select virulence genes espA and tir (C) and the indole sensor cpxA and its cognate response regulator cpxR (D). Fold change was determined relative to an internal control, rpoA. Each symbol represents the value for an individual mouse. Statistical significance was calculated using Mann Whitney U test. Error bars represent standard errors of means (SEM). Values that are significantly different are indicated by asterisks as follows: *, P < 0.05; **, P < 0.01; ***, P < 0.001. (E and F) Measurement of indole (E) or tryptophan (F) concentrations from fecal samples of mice infected with either WT C. rodentium or C. rodentium with the tna operon using mass spectrometry. N = 4 per group was used. Statistical analysis was performed using one-way ANOVA, followed by Bonferroni’s multiple-comparison test. Error bars indicate standard errors of means (SEM). **, P < 0.01; ns, not significant. See also Fig. S4, S5, and S6.
FIG 6
FIG 6
Synthetically altering the microbiota to remodel gut indole concentration dictates C. rodentium infectivity. (A) Schematic representation of the microbiota remodeling and C. rodentium murine infection experiments. D, day; Bt, Bacteroides thetaiotaomicron. (B to D) C3H/HeJ mice precolonized with either WT B. thetaiotaomicron (B. theta) or ΔtnaA B. theta were infected with WT C. rodentium. (B) Mice were monitored for the C. rodentium colonization. Statistical significance was calculated using two-sided Mann-Whitney U test. Each symbol indicates the value for an individual mouse. (C) Survival of mice. P value was determined by using log rank (Mantel-Cox) test. A total of n = 15 mice per group was used. (D) Expression of select virulence genes. Statistical significance was calculated using unpaired t test, followed by multiple comparison using Bonferroni-Dunn method. Error bars represent standard errors of means (SEM). *, P < 0.05. See also Fig. S7.
FIG 7
FIG 7
EHEC changes its virulence expression in different oxygenation conditions. (A to C) WT and △tnaA EHEC were grown under anaerobic (A), microaerophilic (B), or aerophilic (C) conditions. The cells were harvested in late log phase. The supernatants were collected, and the secreted protein fractions were probed using EspB antibody. BSA was used as a loading control. See also Fig. S1.

References

    1. Baumler AJ, Sperandio V. 2016. Interactions between the microbiota and pathogenic bacteria in the gut. Nature 535:85–93. doi:10.1038/nature18849. - DOI - PMC - PubMed
    1. Cameron EA, Sperandio V. 2015. Frenemies: signaling and nutritional integration in pathogen-microbiota-host interactions. Cell Host Microbe 18:275–284. doi:10.1016/j.chom.2015.08.007. - DOI - PMC - PubMed
    1. Wang D, Ding X, Rather PN. 2001. Indole can act as an extracellular signal in Escherichia coli. J Bacteriol 183:4210–4216. doi:10.1128/JB.183.14.4210-4216.2001. - DOI - PMC - PubMed
    1. Bansal T, Alaniz RC, Wood TK, Jayaraman A. 2010. The bacterial signal indole increases epithelial-cell tight-junction resistance and attenuates indicators of inflammation. Proc Natl Acad Sci U S A 107:228–233. doi:10.1073/pnas.0906112107. - DOI - PMC - PubMed
    1. Xu J, Bjursell MK, Himrod J, Deng S, Carmichael LK, Chiang HC, Hooper LV, Gordon JI. 2003. A genomic view of the human-Bacteroides thetaiotaomicron symbiosis. Science 299:2074–2076. doi:10.1126/science.1080029. - DOI - PubMed

Publication types

MeSH terms