. 2019 May 21:13:220.
doi: 10.3389/fncel.2019.00220. eCollection 2019.

Synapsin I Controls Synaptic Maturation of Long-Range Projections in the Lateral Amygdala in a Targeted Selective Fashion

Affiliations

Synapsin I Controls Synaptic Maturation of Long-Range Projections in the Lateral Amygdala in a Targeted Selective Fashion

Eleonora Lugarà et al. Front Cell Neurosci. .

Abstract

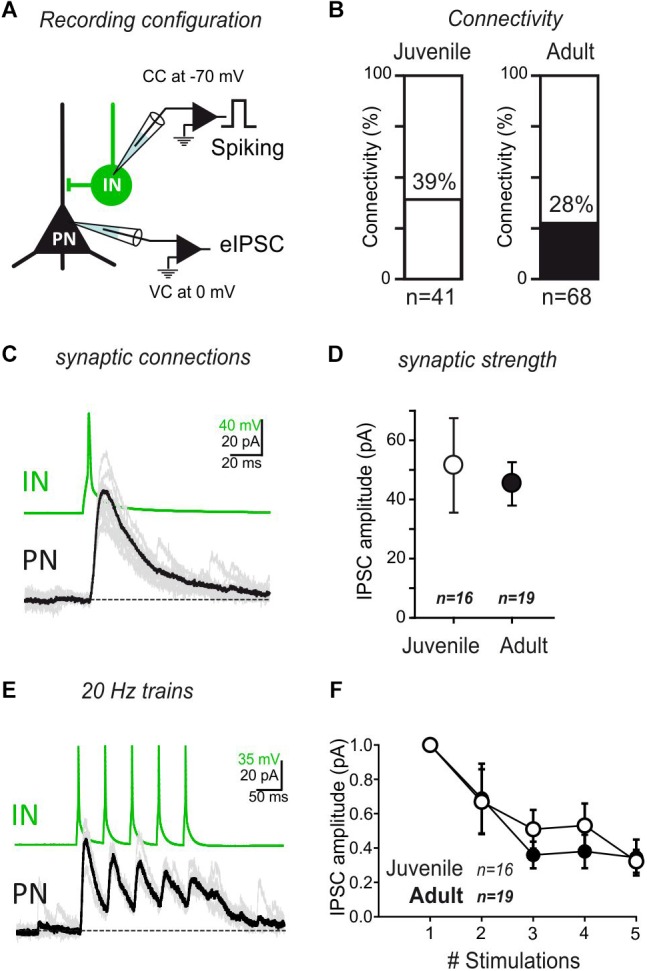
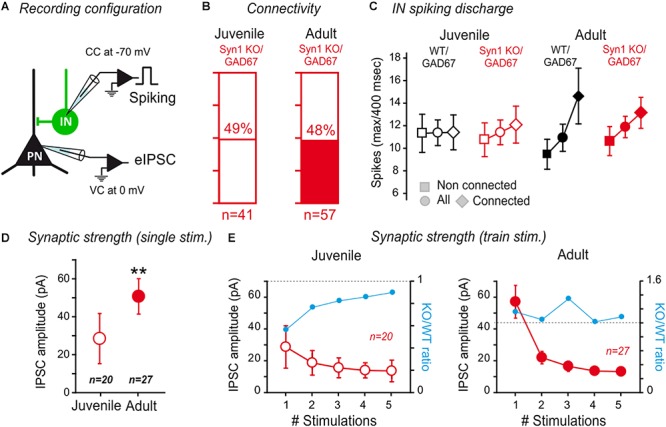
The amygdala, and more precisely its lateral nucleus, is thought to attribute emotional valence to external stimuli by generating long-term plasticity changes at long-range projections to principal cells. Aversive experience has also been shown to modify pre- and post-synaptic markers in the amygdala, suggesting their possible role in the structural organization of adult amygdala networks. Here, we focused on how the maturation of cortical and thalamic long-range projections occurs on principal neurons and interneurons in the lateral amygdala (LA). We performed dual electrophysiological recordings of identified cells in juvenile and adult GAD67-GFP mice after independent stimulation of cortical and thalamic afferent systems. The results demonstrate that synaptic strengthening occurs during development at synapses projecting to LA principal neurons, but not interneurons. As synaptic strengthening underlies fear conditioning which depends, in turn, on presence and increasing expression of synapsin I, we tested if synapsin I contributes to synaptic strengthening during development. Interestingly, the physiological synaptic strengthening of cortical and thalamic synapses projecting to LA principal neurons was virtually abolished in synapsin I knockout mice, but not differences were observed in the excitatory projections to interneurons. Immunohistochemistry analysis showed that the presence of synapsin I is restricted to excitatory contacts projecting to principal neurons in LA of adult mice. These results indicate that synapsin I is a key regulator of the maturation of synaptic connectivity in this brain region and that is expression is dependent on postsynaptic identity.

Keywords: amygdala; cortical projections; interneurons; synapse maturation; synapsin; thalamic projections.


Figures

Figure 1
Figure 1
Target specific synaptic maturation occurs at long-range projections to the lateral amygdala during animal aging. (A) Left: Dual whole-cell recordings were obtained from LA cells in coronal acute slices. Two stimulation electrodes were positioned in the external and internal capsules to stimulate cortical and thalamic inputs to the LA. Right: anatomical location of LA within the amygdala nuclei. (B) GFP-expressing LA-INs were identified and recorded together with a neighboring LA-PN. (C) Cortical-LA EPSCs were evoked in juvenile (2–3 weeks, n = 36 dual recordings) and adult (3–6 months, n = 75 dual recordings) WT mice and the IN/PN ratio calculated. Typical traces are shown on the left panels and IN/PN ratios are shown on the right. The orange lines denote the cumulative IN/PN values for the juvenile dataset, and the black line the results obtained in adult mice. (D) Plot of Juvenile vs. Adult IN/PN ratio for cortical afferents. ∗∗∗p < 0.001, Mann–Whitney U-test. (E): Same presentation as in (C) for thalamic-LA stimulations. (F) Plot of Juvenile vs. Adult IN/PN ratio for thalamic afferents. ∗∗∗p < 0.001, Mann–Whitney U-test.
Figure 2
Figure 2
Minimal stimulation paradigms demonstrate a strengthening of long-range projections specifically to LA-PNs in adult mice. (A) Example of a minimal stimulation recording. Typical traces (left) and extracted EPSC amplitudes for 80 consecutive paired stimulations (#1 and #2) from the same recording (right). Note that the frequency of success increases at the second stimulation (stim#2) without changing the success amplitude. (B) Mean response potency (±SEM) and EPSC amplitude (±SEM) were extracted from INs and PNs in dual recordings of juvenile and adult preparations following stimulation of cortical axons. IN vs. PN: p < 0.05; ∗∗p < 0.01; ns- p > 0.05; Mann–Whitney U-test. Green and black open dots: juvenile IN and PN, respectively; green and black close dots: adult IN and PN, respectively. An “excitatory drive” index was then calculated for each recording by multiplying the probability of success and the EPSC amplitude observed in simultaneously recorded IN and PN. (C) Pie charts representing the excitatory drive for cortical projections to PNs and INs. The percentage of the PN-excitatory drive over the IN-excitatory drive, and the IN-excitatory drive over the PN-excitatory drive calculated in paired recordings is shown. 50% represent the perfect balance between the excitatory projections to PNs and INs. (D) Same representation as in (B) for thalamic axon stimulations. INs vs. PNs ns- p > 0.05; Mann–Whitney U-test (E) same representation as in (C) for stimulation of thalamic axons.
Figure 3
Figure 3
IN/PN connectivity is stable during development. (A) Connectivity between INs and PNs was tested by evoking action potentials in the INs, while recording the PNs at a membrane potential allowing visualizing GABAA currents as outward currents. B The rate of connectivity was similar between juvenile and adult preparations. Juvenile: 39% n = 41; Adult: 28% n = 68. p = 0.13, Fisher exact test. (C) Single spike recording of a monosynaptic connection. (D) Average IPSC amplitude (±SEM) of IN/PN connections in juvenile and adult preparations for single spike stimulation. ns- p > 0.05; Mann–Whitney U-test. (E) Train stimulations of IN/PN connections (5×; 20 Hz intra burst). (F) Average IPSC amplitude (±SEM) of IN/PN connections in juvenile and adult preparations for 20 Hz train stimulation. ns- p > 0.05; 2-way ANOVA across age.
Figure 4
Figure 4
Synapsin I deletion does not change the LA organization in juvenile mice, but impairs synaptic maturation in adults. (A) Dual whole-cell recordings were obtained from LA cells in coronal acute slices from SynI KO mice. Cortical-LA EPSCs were evoked in juvenile (2–3 weeks, n = 24 dual recordings) and adult (3–6 months, n = 59 dual recordings) mice, and the IN/PN balance calculated. Typical traces (left) and IN/PN balances (right) are shown. Orange line: cumulative IN/PN values for the juvenile WT dataset; red line: results of the present data set; black line: results obtained in adult WT mice. WT groups are the same represented in Figure 1. (B) Averaged IN/PN ratio (±SEM) for cortical connections were calculated from juvenile and adult SynI KO mice. ns- p > 0.05; Mann–Whitney U-test. (C) Same presentation as in (A) for thalamic-LA stimulations. (D) Averaged IN/PN ratio (±SEM) for thalamic connections were calculated from juvenile and adult SynI KO mice. ns- p = 68; Mann–Whitney U-test.
Figure 5
Figure 5
Synapsin I deletion blocks synaptic maturation at excitatory inputs onto LA-PNs in adult mice. Same as in Figure 2. (A) Mean response potency (±SEM) and EPSC amplitude (±SEM) were extracted from INs and PNs in dual recordings in juvenile and adult SynI KO preparations following stimulation of cortical axons. IN vs. PN: p < 0.05; ∗∗p < 0.01; ∗∗∗p < 0.001; ns- p > 0.05, Mann–Whitney U-test. An “excitatory drive” index was then calculated for each recording by multiplying the probability of success and the EPSC amplitude observed in simultaneously recorded INs and PNs. Red open dots: juvenile synIKO; red close dots: adult synIKO; light gray open dots: juvenile and adult WT (Figure 2). (B) Pie charts representing the excitatory drive in SynI KO for cortical projections to PNs and INs. The percentage of the PN-excitatory drive over the IN-excitatory drive, and the IN-excitatory drive over the PN-excitatory drive calculated in paired recordings is shown. 50% represent the perfect balance between the excitatory projections to PN and IN. (C) Same as in (A) for stimulation of thalamic axons. IN vs. PN: ∗∗p < 0.01; ∗∗∗p < 0.001; ns- p > 0.05; Mann–Whitney U-test. (D) Same as in (B) for stimulation of thalamic axons.
Figure 6
Figure 6
Synapsin I deletion does not affect IN to PN connectivity in the LA. (A) Connectivity between INs and PNs in SynI KO was tested by evoking action potentials in the INs, while recording the PNs at a membrane potential allowing to visualize GABAA currents as outward currents. (B) The rate of connectivity was similar between juvenile and adult SynI KO preparations. Juvenile: 49% n = 41; Adult: 48% n = 57; p > 0.05, Fisher exact test. (C) Analysis of the maximum spike number (±SEM) (for a 400 m sec-long depolarization step) displayed in the INs of connected, non-connected or all tested pairs. See text for more details. (D,E) Properties of connected pairs. (D) Average IPSC amplitude (±SEM) of IN/PN connections in juvenile and adult SynI KO preparations for single spike stimulation. ∗∗p < 0.01; Mann–Whitney U-test. (E) Average IPSC amplitude (±SEM) of IN/PN connections in juvenile and adult SynI KO preparations for 20 Hz train stimulation. ns- p > 0.05; 2-way ANOVA juvenile vs. adult.
Figure 7
Figure 7
Synapsin I is mostly expressed in putative excitatory synaptic sites projecting to PNs. (A) Immunohistochemistry pictures for GAD67 (white), Synapsin I (red), vGAT (top, green), vGLUT (bottom, green), and merged channels in BLA. (B) Quantification of Synapsin I colocalization with vGLUT (putative excitatory synaptic sites on PNs), vGLUt and GAD67 (putative excitatory synaptic sites on INs) and vGAT (putative inhibitory synaptic sites). Left Total number of putative synaptic sites counted in 9 slices from 3 animals. ∗∗∗p < 0.001; ns- p > 0.05; one-way ANOVA followed by Bonferroni multiple comparison test. Right Percentage of putative synaptic sites co-localize with Synapsin I in the three groups counted in 9 slices from 3 animals. ∗∗∗p < 0.001; ns- p > 0.05; one-way ANOVA followed by Bonferroni multiple comparison test. Scale bar, 10 μm.

References

    1. Berdel B., Morys J., Maciejewska B. (1997). Neuronal changes in the basolateral complex during development of the amygdala of the rat. Int. J. Dev. Neurosci. 15 755–765. 10.1016/s0736-5748(97)00022-1 - DOI - PubMed
    1. Blair H. T., Schafe G. E., Bauer E. P., Rodrigues S. M., Ledoux J. E. (2001). Synaptic plasticity in the lateral amygdala: a cellular hypothesis of fear conditioning. Learn. Mem. 8 229–242. 10.1101/lm.30901 - DOI - PubMed
    1. Bogen I. L., Jensen V., Hvalby O., Walaas S. I. (2009). Synapsin-dependent development of glutamatergic synaptic vesicles and presynaptic plasticity in postnatal mouse brain. Neuroscience 158 231–241. 10.1016/j.neuroscience.2008.05.055 - DOI - PubMed
    1. Bosch D., Ehrlich I. (2015). Postnatal maturation of GABAergic modulation of sensory inputs onto lateral amygdala principal neurons. J. Physiol. 593 4387–4409. 10.1113/JP270645 - DOI - PMC - PubMed
    1. Bouwmeester H., Smits K., Van Ree J. M. (2002). Neonatal development of projections to the basolateral amygdala from prefrontal and thalamic structures in rat. J. Comp. Neurol. 450 241–255. 10.1002/cne.10321 - DOI - PubMed