. 2019 May 21:10:460.
doi: 10.3389/fgene.2019.00460. eCollection 2019.

Learning Causal Biological Networks With the Principle of Mendelian Randomization

Affiliations

Learning Causal Biological Networks With the Principle of Mendelian Randomization

Md Bahadur Badsha et al. Front Genet. .

Abstract

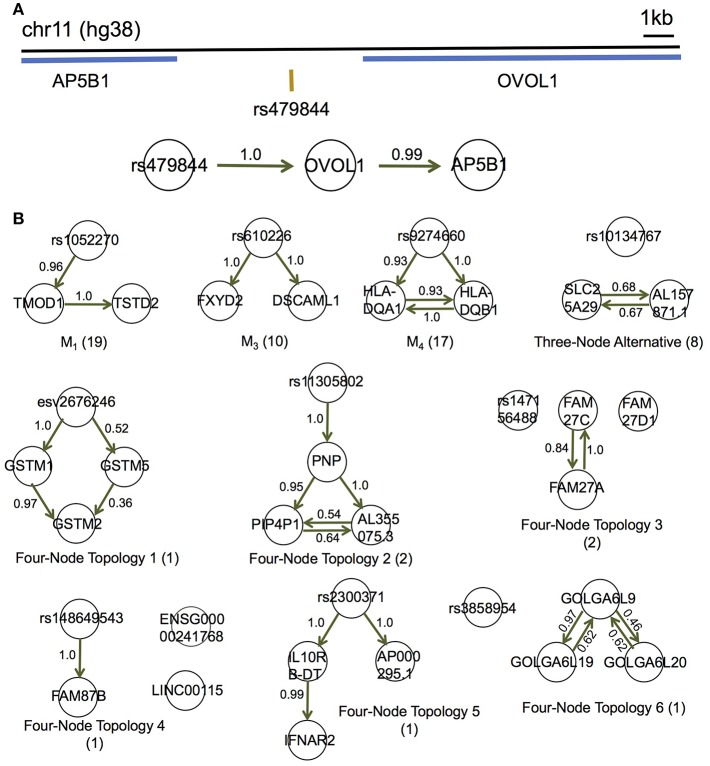
Although large amounts of genomic data are available, it remains a challenge to reliably infer causal (i. e., regulatory) relationships among molecular phenotypes (such as gene expression), especially when multiple phenotypes are involved. We extend the interpretation of the Principle of Mendelian randomization (PMR) and present MRPC, a novel machine learning algorithm that incorporates the PMR in the PC algorithm, a classical algorithm for learning causal graphs in computer science. MRPC learns a causal biological network efficiently and robustly from integrating individual-level genotype and molecular phenotype data, in which directed edges indicate causal directions. We demonstrate through simulation that MRPC outperforms several popular general-purpose network inference methods and PMR-based methods. We apply MRPC to distinguish direct and indirect targets among multiple genes associated with expression quantitative trait loci. Our method is implemented in the R package MRPC, available on CRAN (https://cran.r-project.org/web/packages/MRPC/index.html).

Keywords: Mendelian randomization; bioinformatics; biological networks; causal inference; graphical models.


Figures

Figure 1
Figure 1
Five basic causal relationships under the principle of Mendelian randomization. Each topology involves three nodes: a genetic variant (V1), and two molecular phenotypes (T1 and T2). Directed edges indicate direction of causality, and undirected edges indicate that the direction is undetermined (or equivalently, both directions are equally likely). For each topology (or model), a scatterplot between the two phenotypes is generated using simulated data, the topology is shown, and the marginal and conditional dependence relationships are given. M0 is the null model where T1 and T2 are marginally independent, and therefore the scatterplot does not show correlation. All the other models show scatterplots with similar levels of correlation. M1 is the canonical causal model.
Figure 2
Figure 2
The MRPC algorithm. The MRPC algorithm consists of two steps. In Step I, it starts with a fully connected graph shown in (1), and learns a graph skeleton shown in (2), whose edges are present in the final graph but are undirected. In Step II, it orients the edges in the skeleton in the following order: edges involving at least one genetic variant (3), edges in a v-structure (if v-structures exist) (4), and remaining edges, for which MRPC iteratively forms a triplet and checks which of the five basic models under the PMR is consistent with the triplet (5). If none of the basic models matches the triplet, the edge is left unoriented (shown as bidirected). (A) An example illustrating the algorithm. (B) The pseudocode of the algorithm. See details in Figure S1 and an example for Step II in Figure S2.
Figure 3
Figure 3
Simulation setup to compare MRPC with other methods. (A) Topologies used to generate synthetic data (section Generating Simulated Data). (B) Table summarizing graphs to which each method under comparison is applicable. *Note that QPSO does not learn the causal graph from scratch. Instead, it takes a graph skeleton as the input and seeks the optimal orientation of the edges in this undirected network. Edges involving genetic variants need to be already oriented in the skeleton. Therefore, QPSO does not identify M0 or M3.
Figure 4
Figure 4
Recall and precision of different methods on simulated data. (A–G) Mean recall and precision averaged over 1,000 data sets simulated with four sample sizes and three signal strengths. see section Generating Simulated Data for simulation details. See Tables S2, S3 for the mean and standard deviation of recall and precision from each method in each of the scenarios. (H) Median recall and precision over all parameter settings. We experimented with two settings of the pc function: the default (“PC”) and the conservative (“PCcons”). Since the default setting outperforms the conservative one, we generally use only the default setting in other analyses. Note that only 20 datasets were used for QPSO in each parameter setting due to long runtime.
Figure 5
Figure 5
MRPC distinguishes direct and indirect target genes of eQTLs in the GEUVADIS data for the European cohort. (A) rs479844 is a GWAS significant SNP for atopic march in the GWAS Catalog, and an eQTL identified in GEUVADIS for two genes. (B) MRPC learns 10 distinct topologies among associated genes for eQTLs. Numbers on edges are proportions of the corresponding directed edge being present in a bootstrap sample of 200. The number in parentheses under each topology is the number of eQTL-gene sets with the corresponding inferred topology.
Figure 6
Figure 6
Correlation heatmaps of five eQTL-gene sets using the GEUVADIS data and independently using the GTEx data. Both data sets have been PEER normalized. The top two sets were not replicated in GTEx: (A) SNP rs147156488, and (B) SNP rs3858954. The bottom three sets were replicated in GTEx: (C) SNP rs11305802 (replicated with upsampling), (D) SNP rs2487161 (replicated without upsampling), and (E) SNP rs7585737 (replicated with upsampling).
Figure 7
Figure 7
Topologies inferred by MRPC on GEUVADIS and GTEx data for three eQTL-gene sets in Figures 6A–C. Three target genes have been identified for each of these eQTLs. When the correlation patterns were qualitatively different in the two consortia for the first two sets (A, B), MRPC could not replicate the topologies but instead produced graphs consistent with the correlation patterns. On the other hand, when the correlation patters were similar (C), MRPC replicated the topology. Upsampling was used in the MRPC inference for the GTEx data to compensate for a smaller sampler size.

References

    1. Ahmed S. S., Roy S., Kalita J. K. (2018). Assessing the effectiveness of causality inference methods for gene regulatory networks. IEEE/ACM Trans. Comput. Biol. Bioinform. 10.1109/TCBB.2018.2853728. [Epub ahead of print]. - DOI - PubMed
    1. Alon U. (2007). Network motifs: theory and experimental approaches. Nat. Rev. Genet. 8, 450–461. 10.1038/nrg2102 - DOI - PubMed
    1. Badsha M. B., Fu A. Q. (2018). Learning causal biological networks with the principle of Mendelian randomization. bioRxiv 10.1101/171348 - DOI - PMC - PubMed
    1. Badsha M. B., Mollah M. N., Jahan N., Kurata H. (2013). Robust complementary hierarchical clustering for gene expression data analysis by beta-divergence. J. Biosci. Bioeng. 116, 397–407. 10.1016/j.jbiosc.2013.03.010 - DOI - PubMed
    1. Cheung V. G., Spielman R. S. (2009). Genetics of human gene expression: mapping DNA variants that influence gene expression. Nat. Rev. Genet. 10, 595–604. 10.1038/nrg2630 - DOI - PMC - PubMed

LinkOut - more resources