. 2019 Jun 1:7:6.
doi: 10.1186/s40170-019-0197-8. eCollection 2019.

Epithelial to mesenchymal transition (EMT) is associated with attenuation of succinate dehydrogenase (SDH) in breast cancer through reduced expression of SDHC

Affiliations

Epithelial to mesenchymal transition (EMT) is associated with attenuation of succinate dehydrogenase (SDH) in breast cancer through reduced expression of SDHC

Gro V Røsland et al. Cancer Metab. .

Abstract

Background: Epithelial to mesenchymal transition (EMT) is a well-characterized process of cell plasticity that may involve metabolic rewiring. In cancer, EMT is associated with malignant progression, tumor heterogeneity, and therapy resistance. In this study, we investigated the role of succinate dehydrogenase (SDH) as a potential key regulator of EMT.

Methods: Associations between SDH subunits and EMT were explored in gene expression data from breast cancer patient cohorts, followed by in-depth studies of SDH suppression as a potential mediator of EMT in cultured cells.

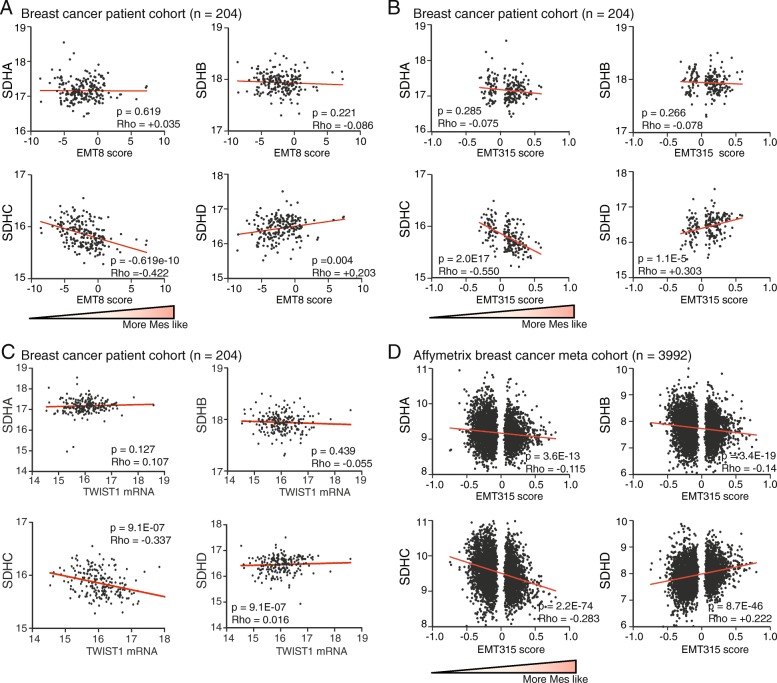
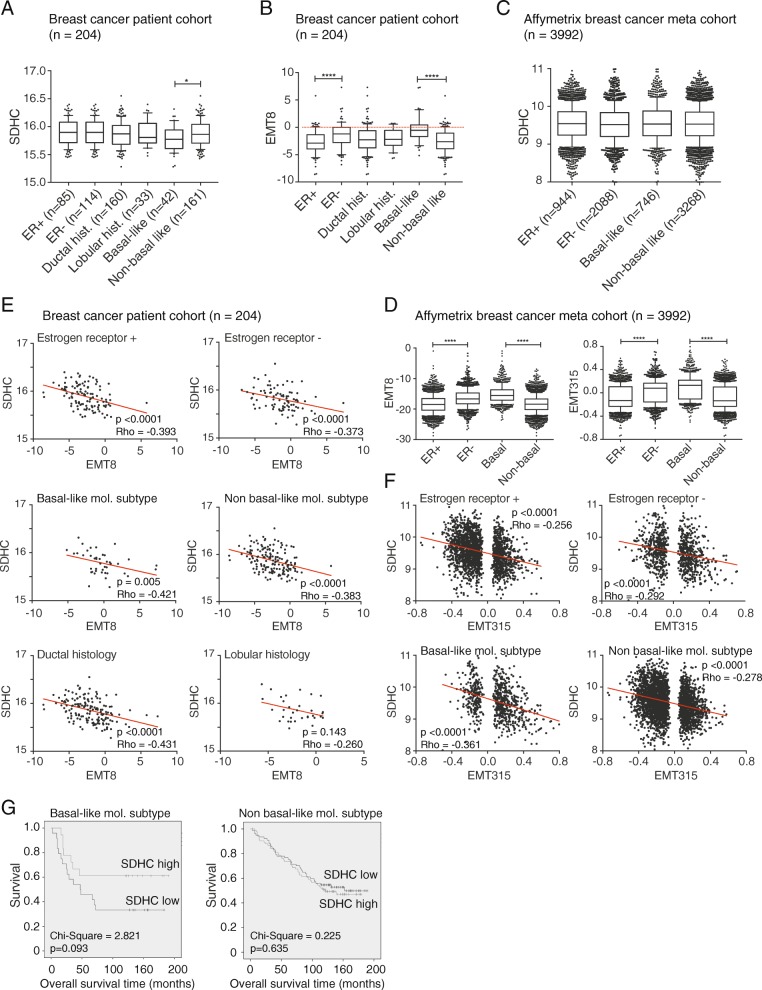
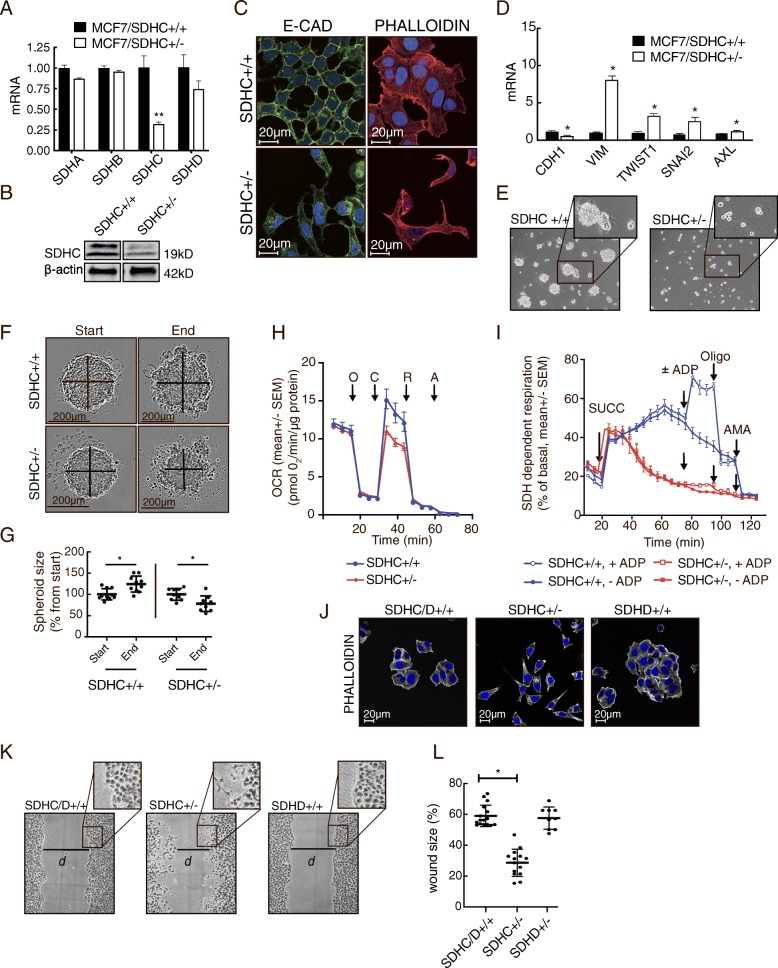
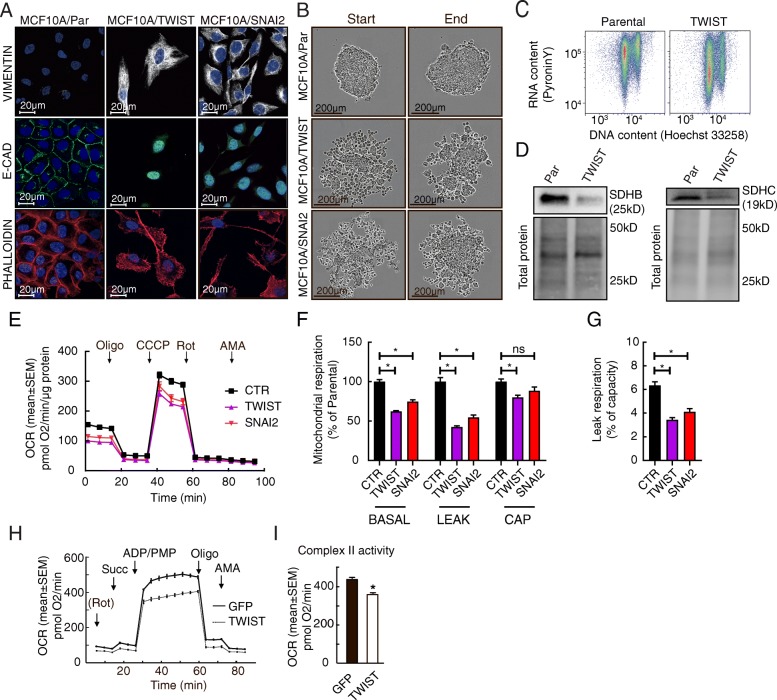
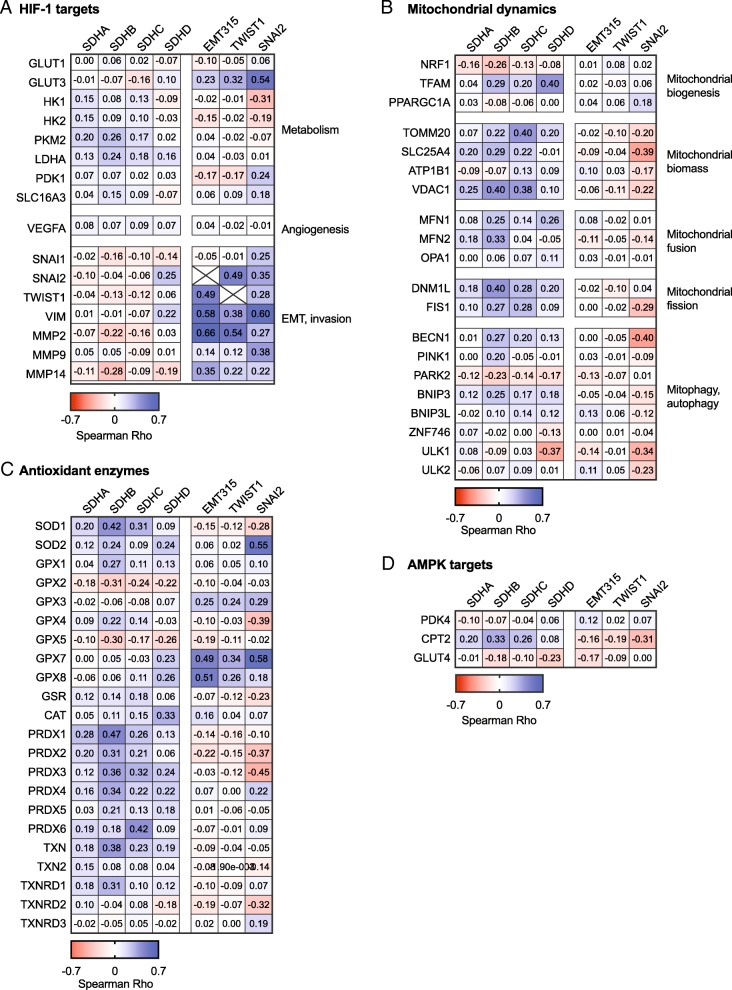
Results: We found an overall inverse association between EMT and the SDH subunit C (SDHC) when analyzing gene expression in breast tumors. This was particularly evident in carcinomas of basal-like molecular subtype compared to non-basal-like tumors, and a low SDHC expression level tended to have a prognostic impact in those patients. Studies in cultured cells revealed that EMT was induced by SDH inhibition through SDHC CRISPR/Cas9 knockdown or by the enzymatic inhibitor malonate. Conversely, overexpression of EMT-promoting transcription factors TWIST and SNAI2 caused decreased levels of SDHB and C and reduced rates of SDH-linked mitochondrial respiration. Cells overexpressing TWIST had reduced mitochondrial mass, and the organelles were thinner and more fragmented compared to controls.

Conclusions: Our findings suggest that downregulation of SDHC promotes EMT and that this is accompanied by structural remodeling of the mitochondrial organelles. This may confer survival benefits upon exposure to hostile microenvironment including oxidative stress and hypoxia during cancer progression.

Keywords: Breast cancer; Cell metabolism; Cell plasticity; Mitochondria; SDH.


Conflict of interest statement

Competing interestsThe authors declare that they have no competing interests.

Figures

Fig. 1
Fig. 1
Association between SDH and EMT in gene expression data from breast cancer patient cohorts. Gene expression (mRNA) correlation analysis (Spearman) between SDH subunits and EMT signature in datasets from breast cancer patients. a Breast cancer patient cohort (n = 204), using the EMT8 signature (8 genes). b Breast cancer patient cohort (n = 204), using the EMT315 signature (315 genes). c Breast cancer patient cohort (n = 204), correlation with TWIST1 expression. d Affymetrix breast cancer patient meta cohort (n = 3992), relative to the EMT315 signature. The gene expression data are displayed with relative arbitrary units
Fig. 2
Fig. 2
SDHC gene expression in subgroups of breast cancer. The two cohorts included in the study was subdivided based on molecular characteristics such as estrogen receptor positive and negative (ER+ and ER−) and basal- and non-basal phenotype. Claudin-low and triple negative subgroups were included in the basal category. In addition, the breast cancer patient cohort (n = 204) was subgrouped based on histology, i.e., into ducal and lobular characteristics. a mRNA expression of SDHC and b EMT8 signature were assessed for the distinct subgroups in the n = 204 cohort. c mRNA expression of SDHC and d EMT8 and EMT315 signatures were determined for the subgroups in the n = 3992 Affymetrix meta cohort. e Spearman correlation analysis for SDHC expression relative to EMT8 signature for subgroups of the breast cancer cohort (n = 204) and f the Affymetrix meta cohort. g Kaplan-Meier survival plots for basal- (n = 42) and non-basal-like (n = 161) breast carcinoma of the breast cancer cohort. The gene expression data are displayed with relative arbitrary units
Fig. 3
Fig. 3
Induction of EMT in MCF7 upon SDHC knockdown. Parental MCF7 cells (MCF7 SDHC+/+) were modified by CRISPR/Cas9 editing to knock down the expression of SDHC (MCF7 SDHC+/−). a SDHA-D mRNA was analyzed by qPCR. b SDHC protein expression was analyzed by western blotting. c Confocal microscopy was performed to evaluate E-cad (immuno-stained, green) expression level and cell morphology (F-actin stained by phalloidin, red). d mRNA expression of the EMT markers E-cad (CDH1), vimentin (VIM), TWIST1, SNAI2, and Axl. e Spheroid formation (anchorage-independent) was evaluated after seeding the cells in wells with low surface adherence. f Spheroid growth and stability was assessed after centrifugation-aided spheroid formation. The spheroid size was measured after 48 h in culture. g The diagram shows statistical data from the experiment described in (f). h Mitochondrial respiratory rates were measured in MCF7 SDHC+/+ and MCF7 SDHC+/− cultures, with glucose, pyruvate, and glutamine provided as the major fuels. Oxygen consumption rate (OCR) was monitored upon sequential additions of oligomycin (O, 3 μM), CCCP (C, 0.75 μM), rotenone (R, 1 μM), and antimycin A (A, 1 μM) as indicated, to assess specific properties of mitochondrial respiration. i For measurement of SDH-dependent mitochondrial respiration, the cells were permeabilized (with PMP) and rotenone was added prior to analysis in restricted assay medium (MAS). Succinate (SUCC, 10 mM), ADP (4 mM), oligomycin (OLIGO, 3 μM), and antimycin A (AMA, 1 μM) were added sequentially as indicated. j Fluorescence microscopy was performed to compare cell morphology (F-actin stained by phalloidin, white) in MCF7 SDHD/C+/+, MCF7 SDHC+/−, and MCF7 SDHD+/− cultures. k Scratch-wound assay comparing MCF7 SDHD/C+/+, MCF7 SDHC+/−, and MCF7 SDHD+/− cells. The images were taken 24 h after the scratch was made. l In the experiment described in (k), we measured scratch size as gap distance (d) at a fixed position, after 24 h, and calculated the results relative to the initial scratch size. Each dot represents separate wells. Data are shown as mean ± SD for (a), (d), (g), and (l) and mean ± SEM for (h) and (i). Student’s t test was used for statistical analysis. *p < 0.01; ns, not significant
Fig. 4
Fig. 4
SDH enzyme inhibition causes induction of EMT. We investigated if SDH enzyme inhibition causes induction of EMT by treating MCF10A cells with the SDH inhibitor malonate (25 mM) for 3 days. a Conventional analysis of mitochondrial respiratory function by measuring oxygen consumption rate (OCR) in DMEM medium in malonate treated MCF10A cells. b The diagram shows statistical data from the experiment described in (a). c SDH-linked respiration was assessed with succinate (Succ) as the only provided substrate, following the addition of cell permeabilizing agent (PMP) and ADP. Oligomycin (Oligo) and antimycin A (AMA) was added to control mitochondrial integrity and background activity, respectively. d The diagram shows statistical data from the experiment described in (c). e mRNA and f protein expression of epithelial (E-cadherin (CDH1)) and mesenchymal (N-cadherin, (CDH2); vimentin, (VIM)) markers. g Phase contrast microscopy. Student’s t test was used for statistical analysis. Data are shown as mean ± SEM for (a)–(d) and mean ± SD for (e). *p < 0.01
Fig. 5
Fig. 5
Induction of EMT in MCF10A cells overexpressing TWIST or SNAI2. The EMT-linked transcription factors TWIST and SNAI2 were overexpressed in epithelial MCF10A cells. EMT was manifested by acquisition of mesenchymal traits. a Fluorescence microscopy for detection of vimentin and E-cadherin, and cell morphology (using phalloidin to stain F-actin), in the parental cells (MCF10A/Par), and cells overexpressing TWIST (MCF10A/TWIST) and SNAI2 (MCF10A/SNAI2). b Images (phase-contrast microscopy) showing spheroid formation capacity. c Total cellular RNA versus DNA content (Hoechst 33258) in MCF10A/TWIST, compared to MCF10A/Par (flow cytometry). d Protein expression of subunit SDHB and SDHC in MCF10A/Par and MCF10A/TWIST cells. e Mitochondrial respiration after overexpression of EMT-linked transcription factors. Oxygen consumption rate (OCR) was measured after sequential additions of oligomycin (Oligo), CCCP, rotenone (Rot), and antimycin A (AMA), in DMEM medium. f Extracted data from the experiment in (e), showing rates of basal and leak (with oligomycin) respiration and respiratory capacity (uncoupled, with CCCP), in the MCF10A/TWIST and MCF10A/SNAI2 cells relative to parental cells (CTR). g Leak respiration (with oligomycin) as the percentage of respiratory capacity (uncoupled, with CCCP), from the experiment in (e). h SDH activity measured in restricted medium (MAS) after the supply of rotenone (Rot), succinate (Succ), ADP, and permabilizing agent (PMP). Oligomycin (Oligo) and antimycin A (AMA) were then added to control mitochondrial integrity and background activity. i The diagram shows statistical data from the experiment described in (h). Data are shown as mean ± SD (column plots) or mean ± SEM (OCR traces). Student’s t test was used for statistical analysis. *p < 0.01
Fig. 6
Fig. 6
Mitochondrial mass and morphology. Mitochondrial mass and morphology were compared in MCF10A (parental, epithelial) and MFC10A/TWIST (mesenchymal) cells. ag Confocal microscopy and quantitative image analysis of immune-stained mitochondria (TOM20 + ATPB). a Based on confocal z-stacks, 3D-models of mitochondrial volume and filament structure were generated, as indicated from left to right in the two image panels. b Mean number of mitochondria per cell (Nm). c Mean mitochondrial total volume per cell (Vm,cell). d Mean mitochondrial total tubule length per cell (Lm,cell). e Size (volume) frequency distribution comparing mitochondria in MCF10A (parental) versus MCF10A/TWIST cells. f Volume fraction analysis of mitochondrial subclasses (size). g Surface area (S.A.) to volume (Vm) regression analysis of individual mitochondria in MCF10A (parental) and MCF10A/TWIST cells. The analysis comprised (parental/TWIST) 937/3643 mitochondria with total volume 9020/9554 μm3, in 30/61 cells (n). hn Effects of TWIST overexpression on mtDNA and gene expression of mitochondrial proteins. h Amount of mtDNA in MCF10A/TWIST relative to parental MCF10A. i Protein expression (WB) of TOM20. j Protein expression of PGC1α, including MCF10A/SNAI2 cells. k mRNA expression of CPT1 and CYCS. l Protein expression (WB) of Drp1 (DMN1L) and Opa1. m mRNA expression of DMNL1 (Drp1), OPA1, MFN1, and MFN2. n mRNA expression of PINK1 and PARK2. Student’s t test was used for statistical analysis. Data are shown as mean ± SD. *p < 0.01
Fig. 7
Fig. 7
Gene expression analysis of potential links between SDH suppression and EMT activation. Gene expression (mRNA) analysis correlating (Spearman) SDH subunits, EMT signature, TWIST1, and SNAI2 to panels of genes focusing on specific processes, based on data from the Affymetrix breast cancer patient meta cohort (n = 3992). The heat map panels reflect the directions and strength (Rho value) of the associations. The panels of genes included a HIF-1 targets, b factors involved in mitochondrial dynamic, c antioxidant enzymes, and d AMPK targets

References

    1. Nieto M. Angela, Huang Ruby Yun-Ju, Jackson Rebecca A., Thiery Jean Paul. EMT: 2016. Cell. 2016;166(1):21–45. doi: 10.1016/j.cell.2016.06.028. - DOI - PubMed
    1. Varga J, Greten FR. Cell plasticity in epithelial homeostasis and tumorigenesis. Nat Cell Biol. 2017;19:1133–1141. doi: 10.1038/ncb3611. - DOI - PubMed
    1. Ye X, Weinberg RA. Epithelial–mesenchymal plasticity: a central regulator of cancer progression. Trends Cell Biol. 2015;25:675–686. doi: 10.1016/j.tcb.2015.07.012. - DOI - PMC - PubMed
    1. Sciacovelli M, Frezza C. Metabolic reprogramming and epithelial-to-mesenchymal transition in cancer. FEBS J. 2017;284:3132–3144. doi: 10.1111/febs.14090. - DOI - PMC - PubMed
    1. Thiery JP, Acloque H, Huang RY, Nieto MA. Epithelial-mesenchymal transitions in development and disease. Cell. 2009;139:871–890. doi: 10.1016/j.cell.2009.11.007. - DOI - PubMed