. 2019 Jul;12(4):990-1003.
doi: 10.1038/s41385-019-0176-y. Epub 2019 Jun 5.

The IL-33/ST2 pathway shapes the regulatory T cell phenotype to promote intestinal cancer

Affiliations

The IL-33/ST2 pathway shapes the regulatory T cell phenotype to promote intestinal cancer

Eva Pastille et al. Mucosal Immunol. 2019 Jul.

Abstract

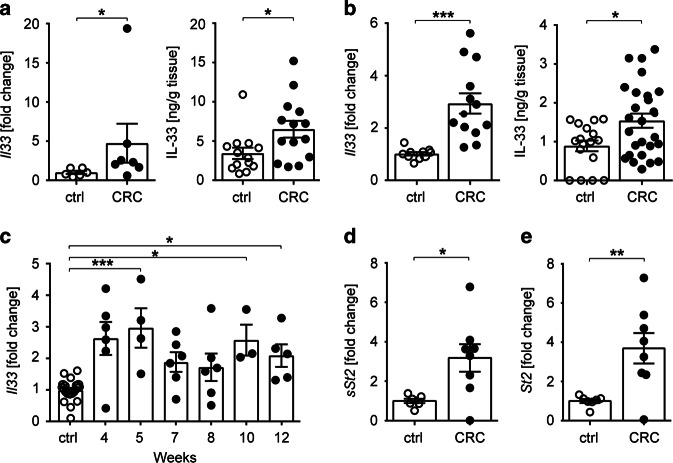
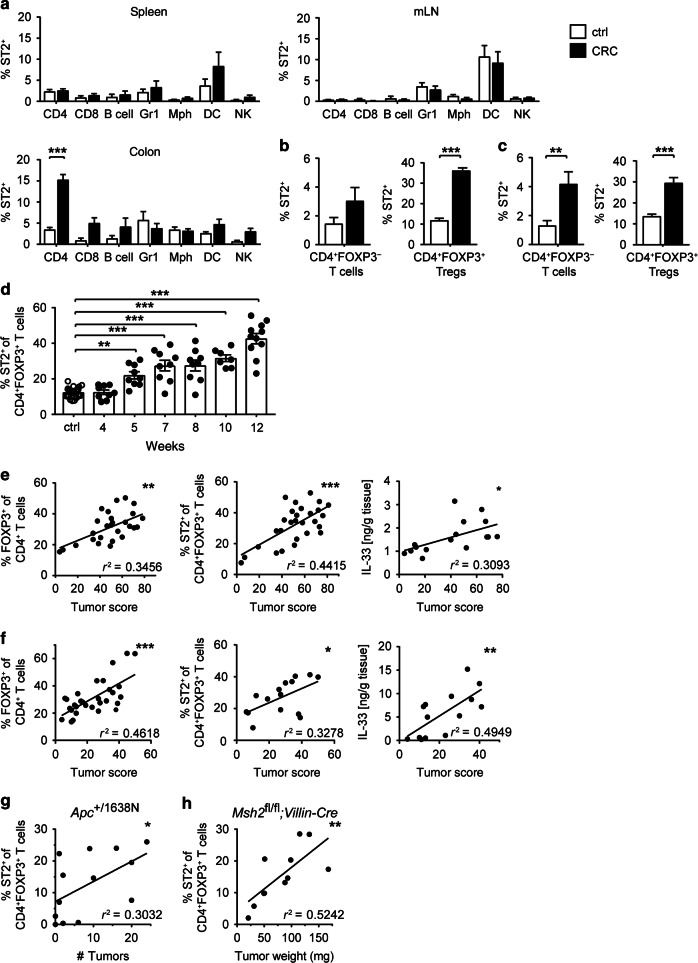
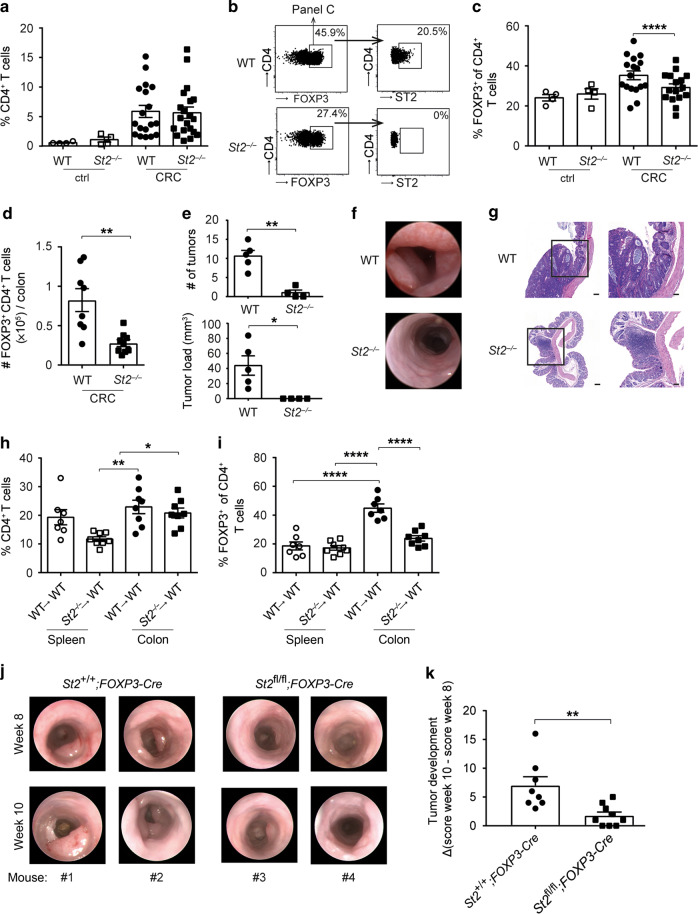
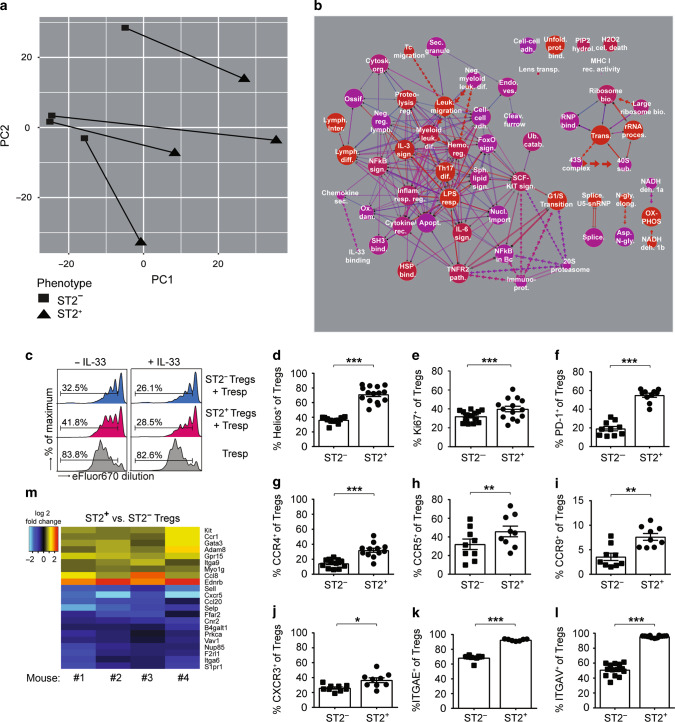
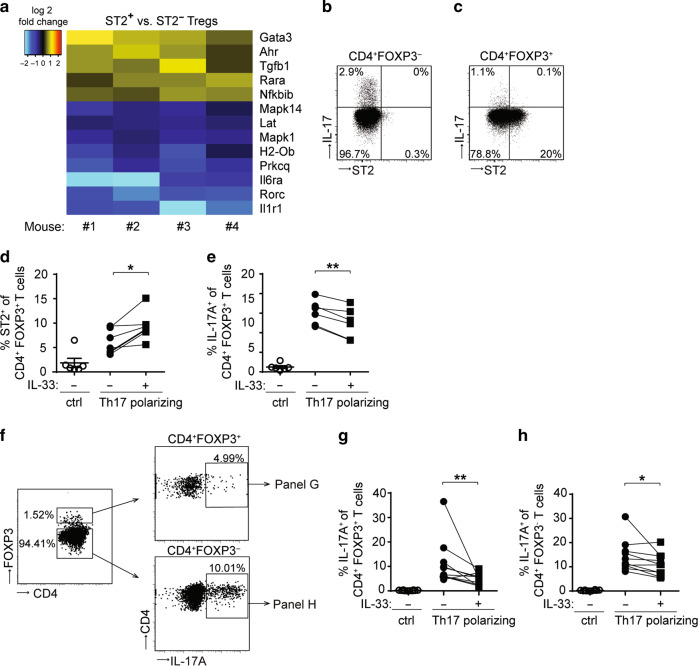
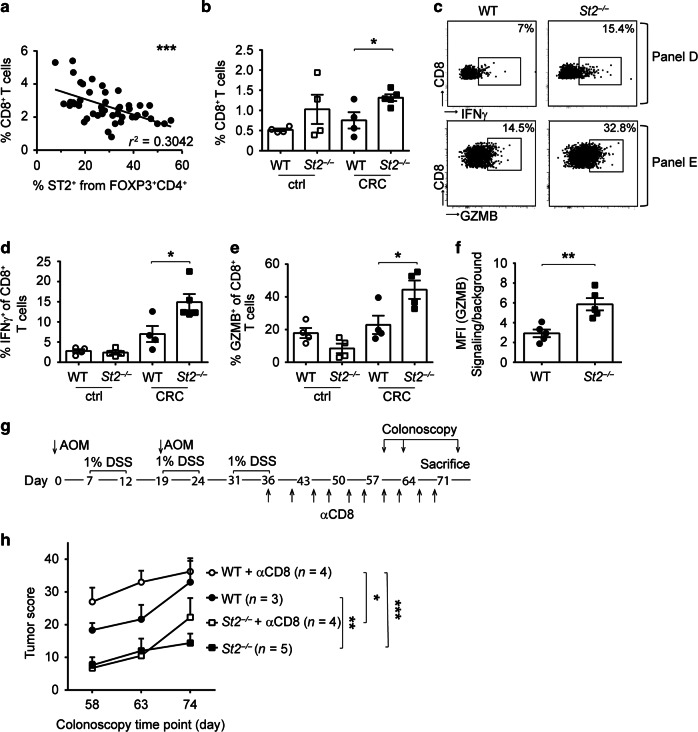
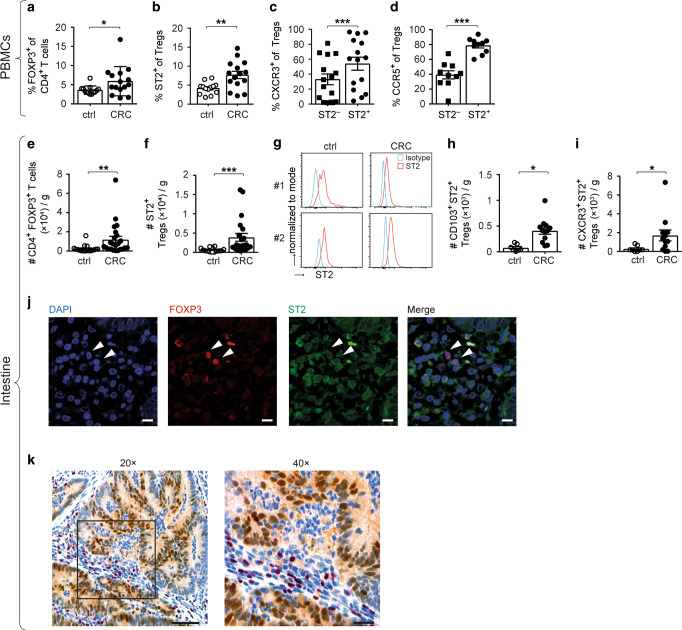
The composition of immune infiltrates strongly affects the prognosis of patients with colorectal cancer (CRC). Interleukin (IL)-33 and regulatory T cells (Tregs) in the tumor microenvironment have been separately implicated in CRC; however their contribution to intestinal carcinogenesis is still controversial. Here, we reveal that IL-33 signaling promotes CRC by changing the phenotype of Tregs. In mice with CRC, tumor-infiltrating Tregs preferentially upregulate IL-33 receptor (ST2), and IL-33/ST2 signaling positively correlates with tumor number and size. Transcriptomic and flow cytometry analyses demonstrate that ST2 expression induces a more activated and migratory phenotype in FOXP3+ Tregs, which favors their accumulation in the tumor environment. Consequently, genetic ablation of St2 reduces Treg infiltration and concomitantly enhances the frequencies of effector CD8+ T cells, thereby restraining CRC. Mechanistically, IL-33 curtails IL-17 production by FOXP3+ Tregs and inhibits Th17 differentiation. In humans, numbers of activated ST2-expressing Tregs are increased in blood and tumor lesions of CRC patients, suggesting a similar mode of regulation. Together, these data indicate a central role of IL-33/ST2 signaling in shaping an immunosuppressive environment during intestinal tumorigenesis. Blockade of this pathway may provide a strategy to modulate the composition of CRC immune infiltrates.


Conflict of interest statement

The authors declare no competing interests.

Figures

Fig. 1
Fig. 1
The IL-33/ST2 pathway is upregulated in intestinal tumors. Mice were treated with AOM/DSS and cancerous colonic tissues (CRC) were isolated for analysis after 10–12 weeks or at the indicated time points. Unless otherwise indicated, colon tissues from naïve mice of the corresponding strain were used as control (ctrl). Il33 transcript levels (left panel) and IL-33 protein secretion from explant cultures (right panel) were measured in the colon of a C57BL/6 mice (n = 6–17 mice per group; data pooled from two, respectively, four independent experiments) or b BALB/c mice (n = 10–26 mice per group; data pooled from three, respectively, five independent experiments). c Il-33 transcript levels were measured in tumor tissues of BALB/c mice at the indicated time points after the first AOM injection. Ctrl, n = 21; CRC, n = 3-6 mice per group; data are from two experiments. Transcript levels of d sSt2 and e St2 were measured in tumor lesions (CRC, n = 8 mice per group) or adjacent tumor-free tissues (ctrl, n = 7 mice per group) from C57BL/6 mice. Data are from one experiment. Data are mean ± SEM. Statistical analyses were performed using a, b, d, e standard Student’s t-test or c one-way ANOVA with Dunnett’s post-test. *P < 0.05; **P < 0.01; ***P < 0.001
Fig. 2
Fig. 2
ST2 is preferentially upregulated on CD4+ FOXP3+ Tregs in intestinal tumors. Mice were treated with AOM/DSS (CRC; black bars) or left untreated (ctrl; white bars), and immune cells from spleen, mesenteric lymph nodes (mLN), or colon were analyzed by flow cytometry. a Frequencies of ST2-positive cells were measured among CD4+ T cells, CD8+ T cells, B220+ B cells, GR1+ granulocytes, F4/80+ CD11cint/− macrophages (Mph), CD11c+F4/80 dendritic cells (DC) and CD335+ NK cells, respectively (n = 7–8 BALB/c mice per group). Frequencies of ST2-positive cells were measured among FOXP3 (left panel) or FOXP3+ (right panel) CD4+ T cells from b BALB/c (n = 15–22 mice per group) or c C57BL/6-Foxp3/RFP mice (n = 10–16 mice per group). d Frequencies of ST2+ FOXP3+ Tregs were measured in CRC lesions of BALB/c mice at the indicated time points during AOM/DSS treatment (n = 26 for ctrl and n = 7–11 for CRC mice per time point). FOXP3+ Treg frequencies (left panel), ST2-expressing FOXP3+ Treg frequencies (middle panel), or IL-33 protein expression (right panel) in colon were correlated with tumor score in e BALB/c (n = 16-28) or f C57BL/6-Foxp3/RFP (n = 14–31) mice. g Alternatively, Apc+/1638N mice (n = 13) were analyzed at different ages and frequencies of ST2-expressing FOXP3+ Treg were correlated with tumor numbers in the colon. h Msh2fl/fl;Villin-Cre mice (n = 11) were analyzed 269–342 days after birth and frequencies of ST2-expressing FOXP3+ Treg were correlated with tumor weight in the small intestine. Data are mean ± SEM and were pooled from a, h two, b, c four, d three, e 4–5, f 3–7 or g several independent experiments. Statistical analyses were performed using a–c two-way ANOVA with Sidak post-test and d one-way ANOVA with Dunnett's post-test. Correlations were calculated using Spearman correlation analysis. *P < 0.05; **P < 0.01; ***P < 0.001
Fig. 3
Fig. 3
Treg frequencies are reduced in tumors of St2−/− mice. Wild-type (WT) or St2−/− C57BL/6 mice were treated with AOM/DSS (CRC) or left untreated (ctrl) and a frequencies of CD4+ T cells in colonic tissues were measured after 10 weeks (n = 4–20 mice per group). b Flow cytometry plots from one representative CRC mouse per group depicted in c showing frequencies of CD4+ FOXP3+ Tregs (panels on the left) and frequencies of ST2-expressing cells among FOXP3+ Tregs (panels on the right). c Frequencies of FOXP3+ Treg were measured among CD4+ T cells based on the gating strategy shown in b. d Absolute numbers of FOXP3+ Treg were measured in the colon of AOM/DSS-treated mice (n = 8–9 mice per group). e Tumor numbers and tumor load were assessed in the colon of CRC mice (n = 5 mice per group). f Endoscopy pictures showing tumors in the distal colon from one representative CRC mouse per group depicted in e. g Hematoxylin and eosin (H&E) sections displaying representative colon tumors in the indicated groups of mice. Scale bars: overview: 200 μm; inlay: 100 μm. Indicated sets of chimeric mice were treated with AOM/DSS and h frequencies of CD4+ T cells or i frequencies of CD4+ FOXP3+ Treg were measured in the indicated organs after 10–13 weeks (n = 7–8 mice per group). j Intestinal tumorigenesis was assessed by endoscopy and k tumor development was calculated in the indicated groups of mice by subtracting tumor score on week 10 from tumor score on week 8 after the start of AOM/DSS treatment (n = 8–9 mice per group). Data are mean ± SEM and show a, c four pooled independent experiments out of six or e one representative experiment out of three. d, h, i, k data were pooled from two independent experiments. Statistical analyses were performed using a, c–e, k standard Student’s t-test or h, i one-way ANOVA with Bonferroni post-test. *P < 0.05; **P < 0.01; ****P < 0.0001
Fig. 4
Fig. 4
ST2 expression shapes the transcriptome and the phenotype of tumor-derived FOXP3+ Tregs. Foxp3/eGFP mice were treated with AOM/DSS and eGFP+ CD4+ T cells from CRC lesions were sort-purified into ST2+ versus ST2 cells for microarray analysis. a Principal component analysis depicting matched samples, connected by lines, from four analyzed mice. b Pathway analysis showing 58 pathways that were found to be differentially regulated between ST2+ versus ST2 eGFP+ CD4+ T cells (with adjusted p-value p < 0.001 and corrected p-value p < 0.001). Graph key: red color indicates increased significance and blue (purple) no significance. Size of circles is proportional to the number of genes within a pathway. Connection lines indicate pathways that share genes. Thickness of connecting lines is proportional to the number of genes shared between two pathways. Double lines indicate that the intersection between two pathways is significant. Dotted arrow lines indicate that a particular pathway corresponds to a subset within another pathway. Line length has no particular meaning. Full pathway names, detailed results, and references for the different pathways are shown in Supplementary Table 1. c To assess their suppressive capability, sort-purified ST2 and ST2+ eGFP+ Tregs were co-cultured at a 1:2 ratio with anti-CD3-activated responder St2/− T cells (Tresp), together with St2−/− antigen-presenting cells, in the presence or absence of IL-33. Proliferation of Tresp was analyzed after 3 days, based on the extent of eFluor670 fluorescence dilution. Histograms show one representative out of three independent experiments. d–l ST2 and ST2+ Tregs (defined as CD4+ FOXP3+ T cells) were analyzed for expression of the indicated markers (n = 7–15 mice per group, pooled from 2 to 3 independent experiments). m Heat map showing all genes in the gene ontology pathway “leukocyte migration” (GO:0050900) that are differentially expressed in ST2+ versus ST2 eGFP+ Tregs isolated from CRC lesions from the indicated four mice (adjusted p-value p ≤ 0.05). Blue indicates higher transcript expression in ST2 Tregs and red higher expression in ST2+ Tregs. d–l Data are mean ± SEM and statistical analyses were performed using paired Student’s t-test. *P < 0.05; **P < 0.01; ***P < 0.001
Fig. 5
Fig. 5
IL-33 restrains IL-17 production in CD4+ T cells. a Foxp3/eGFP mice were treated with AOM/DSS and eGFP+ CD4+ T cells were isolated from CRC lesions for transcriptomic analysis. Heat map showing all genes in the gene ontology pathway “Th17 cell differentiation” (ko04659) that are differentially expressed in ST2+ versus ST2 eGFP+ Tregs isolated from CRC lesions from the indicated four mice (adjusted p-value p ≤ 0.05). Blue indicates higher transcript expression in ST2 Tregs and yellow/red higher expression in ST2+ Tregs. BALB/c mice were treated with AOM/DSS and FOXP3 CD4+ T cells b or FOXP3+ CD4+ Tregs c were analyzed in the intestine for ST2 and IL-17 expression. Shown are flow cytometry plots from each one representative sample out of three. d–h Sort-purified eGFP+ b, c or eGFP d, f CD4+ T cells from spleens of naïve Foxp3/eGFP reporter mice were stimulated with anti-CD3/anti-CD28 antibodies (ctrl) or cultured under Th17 polarizing conditions in the presence or absence of IL-33. d Frequencies of ST2-positive or e IL-17A-positive cells were measured among CD4+ FOXP3+ Tregs. f Flow cytometry plots from one representative experiment showing the gating strategy applied to assess the proportion of IL-17A-expressing cells among FOXP3+ (right upper panel) or FOXP3- CD4+ T cells (right lower panel). In this particular dataset, eGFP CD4+ T were cultured under Th17-polarizing conditions, in the presence of IL-33. Frequencies of IL-17A-expressing cells were measured among g CD4+ FOXP3+ Tregs or FOXP3 CD4+ T cells h. d, e Data are mean ± SEM and were pooled from two representative experiment (n = 6 mice). Statistical analyses were performed using paired Student’s t-test. g, h Data are mean ± SEM (n = 10 mice, pooled from three independent experiments) and statistical analyses were performed using Wilcoxon matched-pairs signed rank test. *P < 0.05; **P < 0.01
Fig. 6
Fig. 6
Increased frequencies of effector CD8+ T cells in CRC lesions of St2−/− mice lead to improved antitumor immunity. Mice were treated with AOM/DSS and immune cells were analyzed in CRC lesions (CRC) or in adjacent tumor-free colons (ctrl). a Frequencies of CD8+ T cells were correlated with frequencies of ST2+ CD4+ Tregs in WT tumor tissues (n = 47 mice, pooled from nine independent experiments). b Frequencies of CD8+ T cells were measured in the intestine of the indicated strains. c Flow cytometry plots from one representative mouse per group depicted in d or e showing CRC-derived CD8+ T cells expressing IFNγ or GZMB, respectively. d Frequencies of IFNγ– or e GZMB-expressing CD8+ T cells were measured in the intestine of the indicated strains. f Median fluorescence intensity (MFI) of GZMB was measured on CRC-derived CD8+ T cells. g Mice were treated with AOM/DSS with or without antibody-mediated CD8+ T cell depletion, as shown in this experimental setup; h colonoscopy was then performed for longitudinal assessment of the tumor score in the indicated groups, at the indicated time points after the first AOM injection. Data are mean ± SEM. Data in b–f depict one representative out of six independent experiments (n = 4–5 mice per group) and data in h show one out of two experiments. Correlation in a was performed using Spearman correlation analysis and statistical analyses were performed using b–f standard Student’s t-test or h two-way ANOVA followed by uncorrected Fisher's LSD test. Statistics in h are shown only for the last colonoscopy time point. *P < 0.05; **P < 0.01; ***P < 0.001
Fig. 7
Fig. 7
Increased presence of ST2+ FOXP3+ Tregs in the PBMCs and tumors of CRC patients. CD4+ FOXP3+ Tregs were analyzed in PBMCs from healthy controls (ctrl) and CRC patients to measure a cell frequencies and b proportions of ST2-expressing cells (ctrl, n = 13; CRC, n = 15). c Frequencies of CXCR3-expressing (n = 15) or d CCR5-expressing cells were quantified among circulating ST2-negative versus ST2-positive CD4+ FOXP3+ Tregs from CRC patients (n = 10). Alternatively, lymphocytes were isolated from tumor (CRC) versus adjacent tumor-free (ctrl) colons and e numbers of CD4+ FOXP3+ Tregs (ctrl, n = 18; CRC, n = 23) and of f ST2+ Tregs (ctrl, n = 14; CRC, n = 21) were determined per gram of tissue. g Representative histograms showing ST2 expression on CD4+ FOXP3+ Tregs from tumor versus adjacent tumor-free colons from two CRC patients. Numbers of intestinal CD4+ FOXP3+ Tregs were determined for h CD103+ (ctrl, n = 7; CRC, n = 12) or (i) CXCR3+ (ctrl, n = 8; CRC, n = 12) cells. j Immunofluorescence was performed on human CRC tissue for DAPI (blue), FOXP3 (red), and ST2 (green). Scale bars: 10 µm. k Representative immunohistochemistry of human CRC tissue showing FOXP3-expressing lymphocytes (red) in the vicinity of IL-33-positive transformed intestinal epithelial cells (brown). Image magnification is indicated. Scale bars: 100 and 50 µm, respectively. Data are mean ± SEM. Statistical analyses were performed using a, b Mann–Whitney test, c, d paired Student’s t-test, ef, hi Wilcoxon matched-pairs signed-rank test. *P < 0.05; **P < 0.01; ***P < 0.001

References

    1. Liu X, et al. Structural insights into the interaction of IL-33 with its receptors. Proc. Natl Acad. Sci. USA. 2013;110:14918–14923. - PMC - PubMed
    1. Moussion C, Ortega N, Girard JP. The IL-1-like cytokine IL-33 is constitutively expressed in the nucleus of endothelial cells and epithelial cells in vivo: a novel ‘alarmin'? PLoS One. 2008;3:e3331. - PMC - PubMed
    1. Liew FY, Girard JP, Turnquist HR. Interleukin-33 in health and disease. Nat. Rev. Immunol. 2016;16:676–689. - PubMed
    1. Coyle AJ, et al. Crucial role of the interleukin 1 receptor family member T1/ST2 in T helper cell type 2-mediated lung mucosal immune responses. J. Exp. Med. 1999;190:895–902. - PMC - PubMed
    1. Schiering C, et al. The alarmin IL-33 promotes regulatory T-cell function in the intestine. Nature. 2014;513:564–568. - PMC - PubMed

Publication types

MeSH terms

Substances