

Intensive Glucose Control in Patients with Type 2 Diabetes - 15-Year Follow-up
- PMID: 31167051
- PMCID: PMC6706253
- DOI: 10.1056/NEJMoa1806802
Intensive Glucose Control in Patients with Type 2 Diabetes - 15-Year Follow-up
Abstract
Background: We previously reported that a median of 5.6 years of intensive as compared with standard glucose lowering in 1791 military veterans with type 2 diabetes resulted in a risk of major cardiovascular events that was significantly lower (by 17%) after a total of 10 years of combined intervention and observational follow-up. We now report the full 15-year follow-up.
Methods: We observationally followed enrolled participants (complete cohort) after the conclusion of the original clinical trial by using central databases to identify cardiovascular events, hospitalizations, and deaths. Participants were asked whether they would be willing to provide additional data by means of surveys and chart reviews (survey cohort). The prespecified primary outcome was a composite of major cardiovascular events, including nonfatal myocardial infarction, nonfatal stroke, new or worsening congestive heart failure, amputation for ischemic gangrene, and death from cardiovascular causes. Death from any cause was a prespecified secondary outcome.
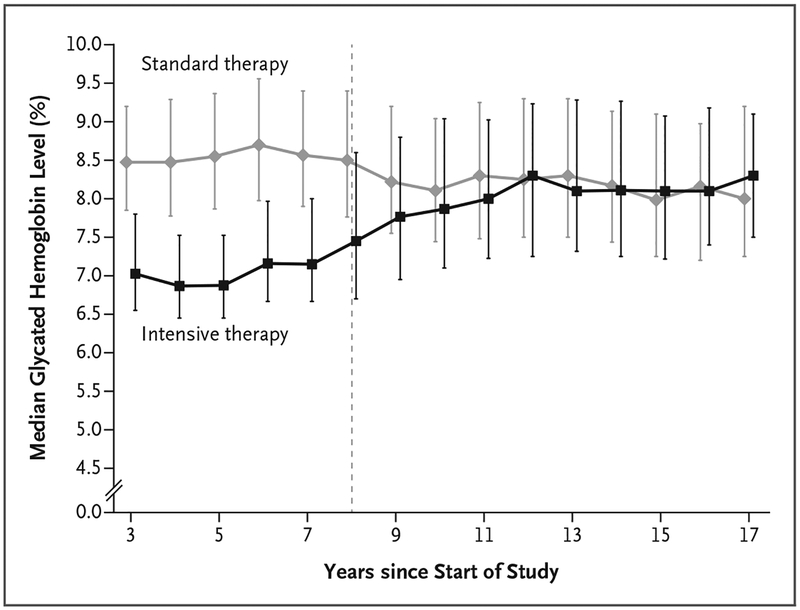
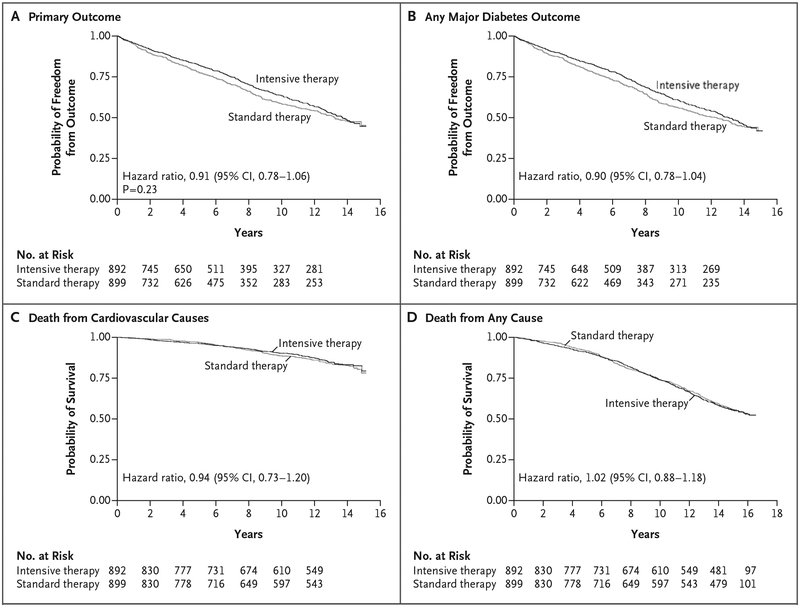
Results: There were 1655 participants in the complete cohort and 1391 in the survey cohort. During the trial (which originally enrolled 1791 participants), the separation of the glycated hemoglobin curves between the intensive-therapy group (892 participants) and the standard-therapy group (899 participants) averaged 1.5 percentage points, and this difference declined to 0.2 to 0.3 percentage points by 3 years after the trial ended. Over a period of 15 years of follow-up (active treatment plus post-trial observation), the risks of major cardiovascular events or death were not lower in the intensive-therapy group than in the standard-therapy group (hazard ratio for primary outcome, 0.91; 95% confidence interval [CI], 0.78 to 1.06; P = 0.23; hazard ratio for death, 1.02; 95% CI, 0.88 to 1.18). The risk of major cardiovascular disease outcomes was reduced, however, during an extended interval of separation of the glycated hemoglobin curves (hazard ratio, 0.83; 95% CI, 0.70 to 0.99), but this benefit did not continue after equalization of the glycated hemoglobin levels (hazard ratio, 1.26; 95% CI, 0.90 to 1.75).
Conclusions: Participants with type 2 diabetes who had been randomly assigned to intensive glucose control for 5.6 years had a lower risk of cardiovascular events than those who received standard therapy only during the prolonged period in which the glycated hemoglobin curves were separated. There was no evidence of a legacy effect or a mortality benefit with intensive glucose control. (Funded by the VA Cooperative Studies Program; VADT ClinicalTrials.gov number, NCT00032487.).
Copyright © 2019 Massachusetts Medical Society.
Figures
Comment in
-
Lack of Glycemic Legacy Effects in the Veterans Affairs Diabetes Trial.N Engl J Med. 2019 Jun 6;380(23):2266-2267. doi: 10.1056/NEJMe1905495. N Engl J Med. 2019. PMID: 31167058 Free PMC article. No abstract available.
-
In type 2 diabetes, intensive glucose control for 5.6 years did not differ from usual care for major CV events at 14 years.Ann Intern Med. 2019 Sep 17;171(6):JC31. doi: 10.7326/ACPJ201909170-031. Ann Intern Med. 2019. PMID: 31525765 No abstract available.
-
Intensive Glucose Control and Type 2 Diabetes - 15 Years On.N Engl J Med. 2019 Sep 26;381(13):1292-1293. doi: 10.1056/NEJMc1909041. N Engl J Med. 2019. PMID: 31553849 No abstract available.
-
Intensive Zuckersenkung wirkt nicht nach.MMW Fortschr Med. 2019 Nov;161(20):40. doi: 10.1007/s15006-019-1120-5. MMW Fortschr Med. 2019. PMID: 31773604 Review. German. No abstract available.
References
-
- Khaw KT, Wareham N, Bingham S, Luben R, Welch A, Day N. Association of hemoglobin A1c with cardiovascular dis-ease and mortality in adults: the European prospective investigation into cancer in Norfolk. Ann Intern Med 2004;141:413–20. - PubMed
-
- Kirkman MS, McCarren M, Shah J, Duckworth W, Abraira C. The association between metabolic control and prevalent macrovascular disease in Type 2 diabetes: the VA Cooperative Study in diabetes. J Diabetes Complications 2006;20:75–80. - PubMed
-
- Selvin E, Marinopoulos S, Berkenblit G, et al. Meta-analysis: glycosylated hemoglobin and cardiovascular disease in diabetes mellitus. Ann Intern Med 2004;141: 421–31. - PubMed
-
- Klein R, Klein BE, Moss SE, Davis MD, DeMets DL. The Wisconsin epidemiologic study of diabetic retinopathy. III. Prevalence and risk of diabetic retinopathy when age at diagnosis is 30 or more years. Arch Ophthalmol 1984;102:527–32. - PubMed
-
- Stratton IM, Kohner EM, Aldington SJ, et al. UKPDS 50: risk factors for incidence and progression of retinopathy in Type II diabetes over 6 years from diagnosis. Diabetologia 2001;44:156–63. - PubMed
Publication types
MeSH terms
Substances
Associated data
Grants and funding
LinkOut - more resources
Full Text Sources
Other Literature Sources
Medical