. 2019 Jun 4;27(10):2990-3005.e5.
doi: 10.1016/j.celrep.2019.05.003.

Phosphorylation of FANCD2 Inhibits the FANCD2/FANCI Complex and Suppresses the Fanconi Anemia Pathway in the Absence of DNA Damage

Affiliations

Phosphorylation of FANCD2 Inhibits the FANCD2/FANCI Complex and Suppresses the Fanconi Anemia Pathway in the Absence of DNA Damage

David Lopez-Martinez et al. Cell Rep. .

Abstract

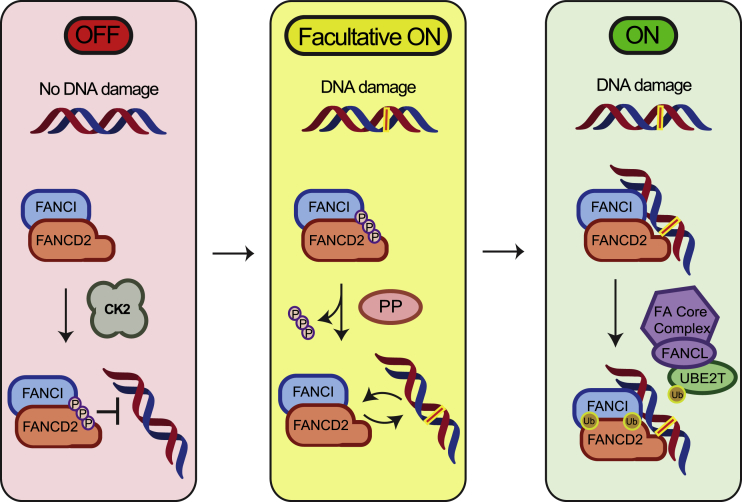
Interstrand crosslinks (ICLs) of the DNA helix are a deleterious form of DNA damage. ICLs can be repaired by the Fanconi anemia pathway. At the center of the pathway is the FANCD2/FANCI complex, recruitment of which to DNA is a critical step for repair. After recruitment, monoubiquitination of both FANCD2 and FANCI leads to their retention on chromatin, ensuring subsequent repair. However, regulation of recruitment is poorly understood. Here, we report a cluster of phosphosites on FANCD2 whose phosphorylation by CK2 inhibits both FANCD2 recruitment to ICLs and its monoubiquitination in vitro and in vivo. We have found that phosphorylated FANCD2 possesses reduced DNA binding activity, explaining the previous observations. Thus, we describe a regulatory mechanism operating as a molecular switch, where in the absence of DNA damage, the FANCD2/FANCI complex is prevented from loading onto DNA, effectively suppressing the FA pathway.

Keywords: CK2; DNA repair; FANCD2/FANCI; Fanconi anemia; ICL repair; casein kinase 2; genome stability; interstrand crosslink repair; kinase; phosphorylation.


Figures

None
Graphical abstract
Figure 1
Figure 1
Identification of a Phosphorylation Cluster on FANCD2 (A) Schematic representation of the generation of a Flag-HA-FANCD2 knock-in HeLa cell line through the use of CRISPR/Cas9. Exons are shown in green, and Flag-HA tag is shown in red. (B) Flag purification of both FANCD2 and Ub-FANCD2 from the knock-in HeLa cell line. Immunoblot analysis showing whole-cell lysate (WCL), pellet, lysate, flowthrough (FT), and elution of the purification. Silver stain showing the four elution products used for MS/MS in unperturbed conditions (no TMP) and after the induction of ICLs with TMP (TMP). (C) Alignment of residues 874–905 of human FANCD2 protein to those in mouse (Mus), chicken (Gallus), toad (Xenopus), zebrafish (Danio), and fruit fly (Drosophila). Serine and threonine residues are in red, and aspartic and glutamic acid residues are in blue (alignments done with ClustalW2). (D) Relative intensity of ubiquitinated peptides to unmodified peptides as identified in MS/MS in four samples: no ubiquitination/no TMP (1), ubiquitination/no TMP (2), no ubiquitination/TMP (3), and ubiquitination/TMP (4). Mean ± SD in n = 2 independent experiments. (E) Relative intensity of phosphorylated peptides to unmodified peptides (containing residues 882, 884, 886, 891, 896, and 898) as identified in MS/MS in four samples: no ubiquitination/no TMP (1), ubiquitination/no TMP (2), no ubiquitination/TMP (3), and ubiquitination/TMP (4). Mean ± SD in n = 2 independent experiments. (F) Crystal structure of the mouse FANCD2/FANCI complex (marked in yellow; PDB: 3S4W) docked into the cryo-EM structure of the human FANCD2/FANCI complex (in gray; EMDB: EMD-8141) showing the approximate location of the 882–898 cluster (marked in red) as well as the C-terminal Tower domain of FANCD2, where some DNA binding residues have been found. It should be noted that residues 882–898 were deleted from the mouse FANCD2 protein used to obtain the crystal structure.
Figure 2
Figure 2
Phosphorylation of the 882–898 Cluster on FANCD2 Suppresses Activation of the FANCD2/FANCI Complex in Human Cells (A) Survival assay to the crosslinking agent mitomycin C (MMC) added at the indicated concentrations and left for 2 weeks. Survival is assessed as the number of colonies formed after 2 weeks. HeLa cells were used, FANCD2 was knocked out with CRISPR/Cas9, and the HeLa FANCD2−/− cells were stably complemented with EGFP-FANCD2, EGFP-FANCD2-6A, or EGFP-FANCD2-6D (mean ± SEM, n = 3). (B) Immunoblot analysis of cell lysates of the HeLa FANCD2−/− cells complemented with EGFP-FANCD2, EGFP-FANCD2-6A, or EGFP-FANCD2-6D before and after treatment with TMP (2 μg/mL) and UVA (50 mJ/cm2) for 3 h. (C) Immunoblot analysis of cell lysates of HeLa FANCD2−/− cells complemented with EGFP-FANCD2, EGFP-FANCD2-6A, or EGFP-FANCD2-6D before and after treatment with TMP (2 μg/mL) and UVA (50 mJ/cm2) for 3 h. Samples were fractionated with CSK buffer so chromatin-bound and soluble fractions could be separated. (D) Live cell imaging of HeLa FANCD2−/− cells complemented with EGFP-FANCD2, EGFP-FANCD2-6A, or EGFP-FANCD2-6D and mCherry-UHRF1. Cells were treated with TMP (20 μg/mL) and microirradiated at the indicated areas (white arrows) and followed for the indicated times (stripe intensity quantified as mean ± SEM, n = 5) (scale bar, 10 μm).
Figure 3
Figure 3
CK2 Phosphorylates FANCD2 in the 882–898 Cluster In Vivo and Reduces Its Monoubiquitination In Vitro (A) Flag purification of endogenous FANCD2 from HeLa S3 knock-in cell line. Ctr, untreated control; CX-4945, treated with 10 μM CK2 inhibitor CX-4945 for 18 h. (B) Relative intensity of phosphorylated peptides containing the 882–898 cluster on FANCD2 in either untreated control or treated with the CK2 inhibitor CX-4945 for 18 or 48 h. (C) Coomassie blue gel of the proteins used in the in vitro ubiquitination assay: Flag-HA-UBA1 (E1), UBE2T (E2), Flag-HA-FANCL (E3), and His-ubiquitin. (D) Coomassie blue gel of the purification of the Flag-HA-FANCD2/His-FANCI complex co-expressed in Sf9 cells. (E) Coomassie blue gel of the in vitro ubiquitination of the FANCD2/FANCI complex as WT, 6A, or 6D forms. Quantification showing the ratio of Ub-FANCD2 to FANCD2. (F) Coomassie blue gel of the in vitro ubiquitination of the WT, 6A, and 6D forms of the FANCD2/FANCI complex following a mock treatment or in vitro phosphorylation by CK2. Quantification showing the ratio of Ub-FANCD2 to FANCD2.
Figure 4
Figure 4
Phosphorylation of the 882–898 Cluster on FANCD2 Hinders Its DNA Binding and Can Be Reversed by Dephosphorylation (A) Electrophoretic mobility shift assay (EMSA) showing the DNA binding of the Flag-HA-FANCD2/His-FANCI complex (WT, 6A, or 6D form) to a Y-shaped radiolabeled DNA probe (representative experiment of n = 2). Quantification showing intensities of the protein/DNA complexes. (B) EMSA showing the DNA binding of the Flag-HA-FANCD2/His-FANCI complex (WT and 6A) after mock or CK2 treatment to a Y-shaped radiolabeled DNA probe (loading control in Figure S4A) (representative experiment of n = 2). Quantification showing intensities of the protein/DNA complexes. (C) EMSA showing the DNA binding of the Flag-HA-FANCD2/His-FANCI complex (WT) after mock, CK2, λPP or both treatments to a Y-shaped radiolabeled DNA probe (representative experiment of n = 2). Quantification showing intensities of the protein/DNA complexes.
Figure 5
Figure 5
Lack of Phosphorylation of the 882–898 Cluster on FANCD2 Leads to Enhanced Recruitment to ICLs and Ubiquitination In Vivo (A) Cell cycle profiles measured by DNA content of HeLa FANCD2−/− cells and HeLa FANCD2−/− cells complemented with FANCD2-WT, FANCD2-6A, and FANCD2-6D after no treatment (Ctr) or after treating with 20 ng/mL MMC for 2 h and recovering for 24 h (MMC). Graph shows the percentage of cells in G2 for each cell line and treatment. (B) Live-cell imaging of HeLa FANCD2−/− cells complemented with EGFP-FANCD2 or EGFP-FANCD2-6A and mCherry-UHRF1. Cells were treated with TMP (20 μg/mL) and microirradiated at the indicated areas (white arrows) and followed for the indicated times (stripe intensity quantified as mean ± SEM, n = 5) (scale bar, 10 μm). (C) Immunoblot analysis of cell lysates of HeLa FANCD2−/− cells complemented with Flag-HA-FANCD2 or Flag-HA-FANCD2-6A either asynchronous (AS) or synchronized with double thymidine block (S and G1). ICLs were introduced with TMP (2 μg/mL) and UVA (50 mJ/cm2) 1.5 h before harvest.
Figure 6
Figure 6
Model of the Regulation of the FA Pathway by CK2 Phosphorylation of the FANCD2/FANCI Complex CK2 phosphorylates FANCD2 constitutively on the 882–898 cluster and prevents DNA binding of the FANCD2/FANCI complex in the absence of DNA damage. Upon the appearance of DNA damage, FANCD2 is dephosphorylated, increasing the affinity of the FANCD2/FANCI complex to DNA. This form of the FANCD2/FANCI complex can be considered facultative active. Once bound to DNA, the FANCD2/FANCI complex is monoubiquitinated by the core complex containing the E3 ligase FANCL, bringing the complex to its fully active state. Monoubiquitination locks the FANCD2/FANCI complex on DNA, completing its activation, and allows ICL repair to initiate.

References

    1. Andreassen P.R., D’Andrea A.D., Taniguchi T. ATR couples FANCD2 monoubiquitination to the DNA-damage response. Genes Dev. 2004;18:1958–1963. - PMC - PubMed
    2. Andreassen, P.R., D’Andrea, A.D., and Taniguchi, T. (2004). ATR couples FANCD2 monoubiquitination to the DNA-damage response. Genes Dev. 18, 1958-1963. - PMC - PubMed
    1. Arter M., Hurtado-Nieves V., Oke A., Zhuge T., Wettstein R., Fung J.C., Blanco M.G., Matos J. Regulated crossing-over requires inactivation of Yen1/GEN1 resolvase during meiotic prophase I. Dev. Cell. 2018;45:785–800.e6. - PMC - PubMed
    2. Arter, M., Hurtado-Nieves, V., Oke, A., Zhuge, T., Wettstein, R., Fung, J.C., Blanco, M.G., and Matos, J. (2018). Regulated crossing-over requires inactivation of Yen1/GEN1 resolvase during meiotic prophase I. Dev. Cell 45, 785-800.e6. - PMC - PubMed
    1. Ayoub N., Jeyasekharan A.D., Bernal J.A., Venkitaraman A.R. HP1-beta mobilization promotes chromatin changes that initiate the DNA damage response. Nature. 2008;453:682–686. - PubMed
    2. Ayoub, N., Jeyasekharan, A.D., Bernal, J.A., and Venkitaraman, A.R. (2008). HP1-beta mobilization promotes chromatin changes that initiate the DNA damage response. Nature 453, 682-686. - PubMed
    1. Blackford A.N., Jackson S.P. ATM, ATR, and DNA-PK: the trinity at the heart of the DNA damage response. Mol. Cell. 2017;66:801–817. - PubMed
    2. Blackford, A.N., and Jackson, S.P. (2017). ATM, ATR, and DNA-PK: the trinity at the heart of the DNA damage response. Mol. Cell 66, 801-817. - PubMed
    1. Blanco M.G., Matos J., West S.C. Dual control of Yen1 nuclease activity and cellular localization by Cdk and Cdc14 prevents genome instability. Mol. Cell. 2014;54:94–106. - PMC - PubMed
    2. Blanco, M.G., Matos, J., and West, S.C. (2014). Dual control of Yen1 nuclease activity and cellular localization by Cdk and Cdc14 prevents genome instability. Mol. Cell 54, 94-106. - PMC - PubMed

Publication types

MeSH terms

Substances