. 2019 Oct;78(10):1346-1356.
doi: 10.1136/annrheumdis-2018-214885. Epub 2019 Jun 5.

Multi-dimensional analysis identified rheumatoid arthritis-driving pathway in human T cell

Affiliations

Multi-dimensional analysis identified rheumatoid arthritis-driving pathway in human T cell

Masaru Takeshita et al. Ann Rheum Dis. 2019 Oct.

Erratum in

Abstract

Objectives: Rheumatoid arthritis (RA) is an autoimmune disease accompanied by lymphocyte infiltration into joint synovium. While T cells are considered to be important for its pathogenesis, the features that are the most relevant to disease and how they change after treatment remain unclear. The aim of this study was to clarify the characteristics of T cells in RA, comprehensively.

Methods: We enrolled a total of 311 patients with RA and 73 healthy participants, and carefully classified them by disease state, constructed multiple cohorts and analysed clinical samples from them in a stepwise manner. We performed immunophenotyping with multiple evaluation axes, and two independent transcriptome analyses complementary to each other.

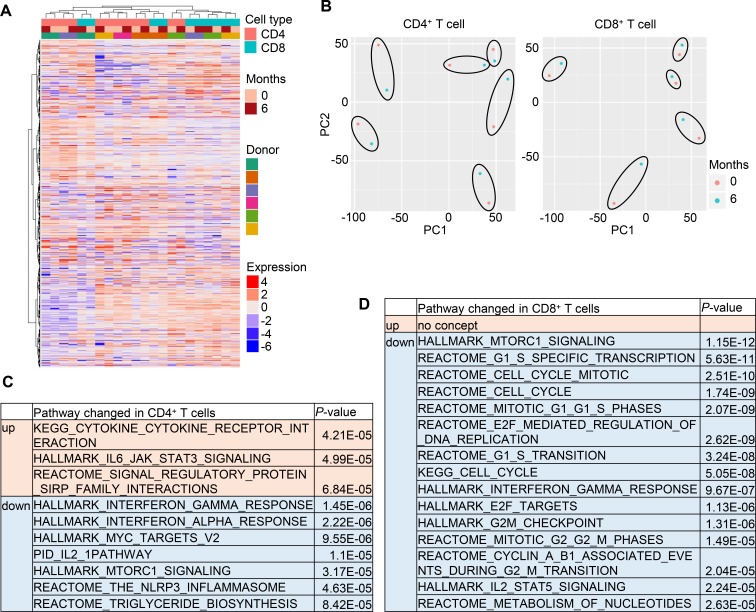
Results: We identified that 'effector memory-Tfh' subset was specifically expanded in the peripheral blood (PB) of patients with RA in correlation with disease activity, and reverted after treatment. Besides, we revealed distinct features of T cells in synovial fluid (SF) that the expression of Tfh/Tph-related genes and pro-inflammatory cytokines and chemokines, including CXCL13, were significantly enriched, whereas these phenotype were Th1-like. Finally, we identified specific pathways, such as mTORC1, IL-2-stat5, E2F, cell cycle and interferon-related genes, that were significantly enriched in SF, in particular, as well as PB of untreated patients with RA, and notably, these features reverted after treatment.

Conclusion: Our multi-dimensional investigation identified disease relevant T-cell subsets and gene signatures deeply involved in pathogenesis of RA. These findings could aid in our understanding of essential roles of T cells in RA and will facilitate to development better diagnostic and therapeutic interventions.

Keywords: T cell; rheumatoid arthritis; synovial fluid.


Conflict of interest statement

Competing interests: YO, KK, YK, KG, MT, RK, HM and YE are employees of Takeda Pharmaceutical Company Limited. KS has received research grants from Eisai, Bristol-Myers Squibb, Kissei Pharmaceutical, and Daiichi Sankyo, and speaking fees from Abbie Japan, Astellas Pharma, Bristol-Myers Squibb, Chugai Pharmaceutical, Eisai, Fuji Film Limited, Janssen Pharmaceutical, Kissei Pharmaceutical, Mitsubishi Tanabe Pharmaceutical, Pfizer Japan, Shionogi, Takeda Pharmaceutical, and UCB Japan, consulting fees from Abbie, and Pfizer Japan. AY has received speaking fees from Chugai Pharmaceutical, Mitsubishi Tanabe Pharmaceutical, Pfizer Japan, Ono Pharmaceutical, Maruho, and Novartis, and consulting fees from GSK Japan. TT has received research grants from Astellas Pharma Inc, Bristol-Myers KK, Chugai Pharmaceutical Co. Ltd., Daiichi Sankyo Co. Ltd, Takeda Pharmaceutical Co. Ltd, Teijin Pharma Ltd, AbbVie GK, Asahikasei Pharma Corp, Mitsubishi Tanabe Pharma Co, Pfizer Japan Inc, and Taisho Toyama Pharmaceutical Co. Ltd, Eisai Co. Ltd, AYUMI Pharmaceutical Corporation, and Nipponkayaku Co. Ltd, and speaking fees from AbbVie GK, Bristol-Myers KK, Chugai Pharmaceutical Co. Ltd, Mitsubishi Tanabe Pharma Co, Pfizer Japan Inc, and Astellas Pharma Inc, and Diaichi Sankyo Co. Ltd, and consultant fees from Astra Zeneca KK, Eli Lilly Japan KK, Novartis Pharma KK, Mitsubishi Tanabe Pharma Co, Abbivie GK, Nipponkayaku Co. Ltd, Janssen Pharmaceutical KK, Astellas Pharma Inc, and Taiho Pharmaceutical Co. Ltd.

Figures

Figure 1
Figure 1
Characterisation of T cells from PB of patients with RA according to developmental stage, activation status, and polarity. PBMCs from 53 patients with RA and 30 HCs were immunophenotyped. The proportions of cells in each developmental stage (Tn, Tscm, Tcm, Tem and Temra) and activated cells (DR+) in (A) CD4+ and (B) CD8+ T cells from HC (blue) and patients with RA (red) are shown. The proportions of (C) polarised T-cell subsets and (D) the Tfh subfraction in CD4+ T cells from HC (blue) and patients with RA (red) are shown. Wilcoxon rank sum test. *p<0.05, **p<0.01, ***p<0.001. HCs, healthy controls; PB, peripheral blood; PBMCs, PB mononuclear cells; RA, rheumatoid arthritis; Tcm, central memory T cell; Tem, effector memory T cell; Tn, naïve T cell; Tscm, stem memory T cell; Temra, effector memory rheumatoid arthritis T cell.
Figure 2
Figure 2
Two-dimensional analysis of T cells from PB of patients with RA according to development and polarity. CD4+ T cells from 12 patients with RA and 16 HCs were immunophenotyped simultaneously along two axes: development and polarity. (A) The proportions of Tn, Tscm, Tcm and Tem were evaluated via a Th1, Th17, Th1/17 and Tfh polarising marker as shown for HC (blue) and RA (red). Wilcoxon rank sum test. (B) The correlations between the proportions of each T-cell subset and DAS28-ESR are shown. The columns represent developmental stages, and the rows represent polarity. The numbers indicate correlation coefficients in Spearman's test. (C) CD4+ T cells from 27 patients with RA who started MTX or biologics were immunophenotyped simultaneously along two axes at 0, 1, 3 and 6 months after the start of treatment. The changes in Th1, Th17, Th1/17 and Tfh cell proportions at each developmental stage are shown in red. For reference, the proportions in HC (shown in figure 2A) are represented in blue. Wilcoxon signed-rank test compared with 0 month. (D) The correlations between the cell proportion of Tem-Th1, Tem-Th17, and Tem-Tfh and DAS28-ESR were measured at all time points in all patients. The numbers indicate correlation coefficients in Spearman's test. *p<0.05, **p<0.01, ***p<0.001. DAS28-ESR, disease activity score-erythrocyte sedimentation rate; HCs, healthy controls; MTX, methotrexate; PB, peripheral blood; PBMCs, PB mononuclear cells; RA, rheumatoid arthritis; Tcm, central memory T cell; Tem, effector memory T cell; Tn, naïve T cell; Tscm, stem memory T cell; Temra, effector memory rheumatoid arthritis T cell.
Figure 3
Figure 3
The comparison of T-cell subsets in SF and PB. Paired samples of SF and PB were collected from 14 patients undergoing joint centesis. The proportion of cells in each developmental stage and activated cells in (A) CD4+ and (B) CD8+ T cells, (C) polarised T-cell subset, and (D) Tfh subpopulation in PB (blue) and SF (red) were evaluated individually for each patient. Wilcoxon rank sum test. (E) The correlations between the proportion of each subset and DAS28-ESR are shown. Numbers indicate correlation coefficients in Spearman's test. *p<0.05, **p<0.01, ***p<0.001. DAS28-ESR, disease activity score-erythrocyte sedimentation rate; PB, peripheral blood; SF, synovial fluid; Tcm, central memory T cell; Tem, effector memory T cell; Tn, naïve T cell; Tscm, stem memory T cell.
Figure 4
Figure 4
Changes in immune-related pathways in T cells from patients with RA after TCZ treatment. PBMCs from six patients with RA before and at 6 months after the start of TCZ monotherapy were collected and cryopreserved until use. CD4+ and CD8+ T cells were sorted from PBMCs, and a transcriptome analysis was performed using an Ion AmpliSeq Transcriptome Human Gene Expression Kit. One sample of CD8+ T cells could not be analysed due to a lack of sufficient RNA. (A) Hierarchical clustering of all samples was performed. Red and blue colours indicate increased and decreased expression, respectively. (B) PCA analysis of CD4+ and CD8+ T cells was performed. Black circles indicate samples that were derived from the same patient. (C–D) Differentially regulated pathways were identified by enrichment analysis. DEGs between before and after TCZ treatment were extracted based on a p value <0.05 and an absolute fold change >1.2 (see online supplementary data 1), and enrichment pathways based on a p value <10−5 were shown (see online supplementary data 2). DEGs, differentially expressed genes; PBMCs, peripheral blood mononuclear cells; PCA, principal component analysis; RA, rheumatoid arthritis; TCZ, tocilizumab.
Figure 5
Figure 5
Transcriptomic analysis of T cells from PB and SF of patients with RA. PBMCs were collected from 10 patients each of the following five groups: HCs, untreated RA (RA-NT), MTX monotherapy (RA-MTX), combination therapy of MTX and IFX (RA-IFX), and TCZ monotherapy (RA-TCZ). SF mononuclear cells (four samples of CD4-Tcm, three samples of CD4-Tem and one sample of CD8-Tcm) were collected from four patients. From these, we freshly sorted CD4+ Tn, Tcm, and Tem and CD8+ Tn, Tcm, Tem, and Temra and performed a transcriptomic analysis. (A–B) PCA analysis of CD4+ and CD8+ T cells was performed. The shapes indicate patient groups, and colours indicate developmental stages. Samples obtained from SF are indicated with arrows. (C) The numbers of overlapped DEGs based on a p value <0.05 and an absolute fold change >1.2 between RA-SF and HC from CD4-Tcm, CD4-Tem and CD8-Tcm, respectively (see online supplementary data 4) were shown. (D–H) Normalised gene expression levels related to Th1, Th17, Tfh, Treg and Tph are shown. Some genes related to polarity, such as CXCR3 and IL17, were not included in the Ion AmpliSeq Transcriptome Human Gene Expression Kit. (I–J) An enrichment analysis was conducted based on a p value <10−5. The top 10 pathways enriched in SF-derived CD4-Tcm and CD4-Tem are shown (full pathway list, see online supplementary data 5). Orange indicates upregulated pathways, and blue indicates downregulated pathways. DEGs, differentially expressed genes; HCs, healthy controls; IFX, infliximab; PB, perpheral blood; PBMCs, PB mononuclear cells; PCA, principal component analysis; MTX, methotrexate; RA, rheumatoid arthritis; SF, synovial fluid; Tcm, central memory T cell; TCZ, tocilizumab; Tem, effector memory T cell; Tn, naïve T cell.
Figure 6
Figure 6
Differentially regulated pathways in T cells from untreated and treated patients with RA. (A–B) Pathways that were differentially regulated in untreated patients with RA (RA-NT) relative to HC based on a p value <10−5, and among them, pathways that were differentially regulated in MTX-treated, IFX-treated and TCZ-treated patients (RA-MTX, RA-IFX and RA-TCZ) relative to RA-NT based on a p value<10−2 were extracted (full pathway list, see online supplementary data 8). The number of the columns indicates the p value for each. Orange indicates upregulated pathways, and blue indicates downregulated pathways. (C) Hierarchical clustering of representative pathways in each subset was shown. Red and blue colours indicate increased and decreased expression, respectively. CD4-Tn, Tcm and Tem and CD8-Tn, Tcm, Tem and Temra were freshly sorted from 13 untreated patients with RA (RA-NT), 10 patients receiving MTX (RA-MTX), 9 patients receiving TCZ (RA-TCZ) and 17 HCs. Sorted cells were labelled with dye, and cultured with CD3/28 beads for 5 days. (D) The proliferation index was calculated by FlowJo software, as shown. Wilcoxon rank sum test. (E) Representative cell trace violet dilution in gated live cells after culture for 5 days is shown. *p<0.05, **p<0.01, ***p<0.001. HC, healthy control; IFX, infliximab; MTX, methotrexate; Tcm, central memory T cell; TCZ, tocilizumab; Tem, effector memory T cell; Tn, naïve T cell.

References

    1. McInnes IB, Schett G. The pathogenesis of rheumatoid arthritis. N Engl J Med 2011;365:2205–19. 10.1056/NEJMra1004965 - DOI - PubMed
    1. Kurkó J, Besenyei T, Laki J, et al. . Genetics of rheumatoid arthritis - a comprehensive review. Clin Rev Allergy Immunol 2013;45:170–9. 10.1007/s12016-012-8346-7 - DOI - PMC - PubMed
    1. Farh KK-H, Marson A, Zhu J, et al. . Genetic and epigenetic fine mapping of causal autoimmune disease variants. Nature 2015;518:337–43. 10.1038/nature13835 - DOI - PMC - PubMed
    1. Hu X, Kim H, Stahl E, et al. . Integrating autoimmune risk loci with gene-expression data identifies specific pathogenic immune cell subsets. The American Journal of Human Genetics 2011;89:496–506. 10.1016/j.ajhg.2011.09.002 - DOI - PMC - PubMed
    1. Kondo Y, Yokosawa M, Kaneko S, et al. . Review: transcriptional regulation of CD4+ T cell differentiation in experimentally induced arthritis and rheumatoid arthritis. Arthritis Rheumatol 2018;70:653–61. 10.1002/art.40398 - DOI - PMC - PubMed

Publication types