. 2019 Jul 19;294(29):11180-11198.
doi: 10.1074/jbc.RA118.007310. Epub 2019 Jun 5.

Protein painting, an optimized MS-based technique, reveals functionally relevant interfaces of the PD-1/PD-L1 complex and the YAP2/ZO-1 complex

Affiliations

Protein painting, an optimized MS-based technique, reveals functionally relevant interfaces of the PD-1/PD-L1 complex and the YAP2/ZO-1 complex

Amanda Haymond et al. J Biol Chem. .

Abstract

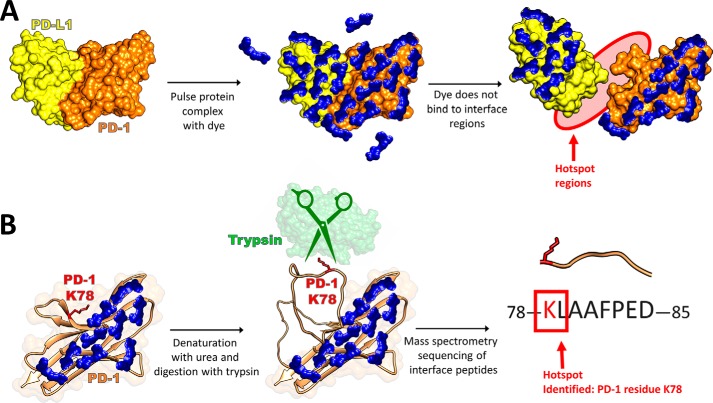
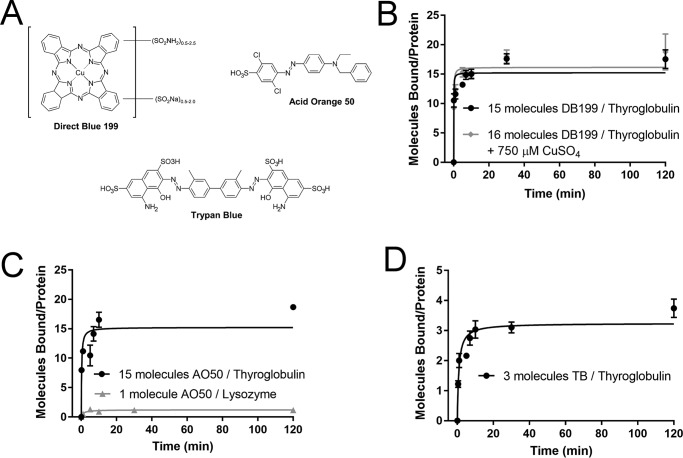
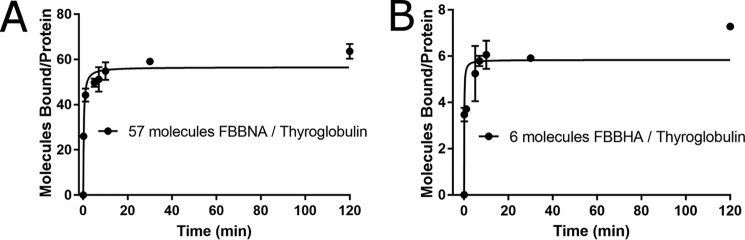
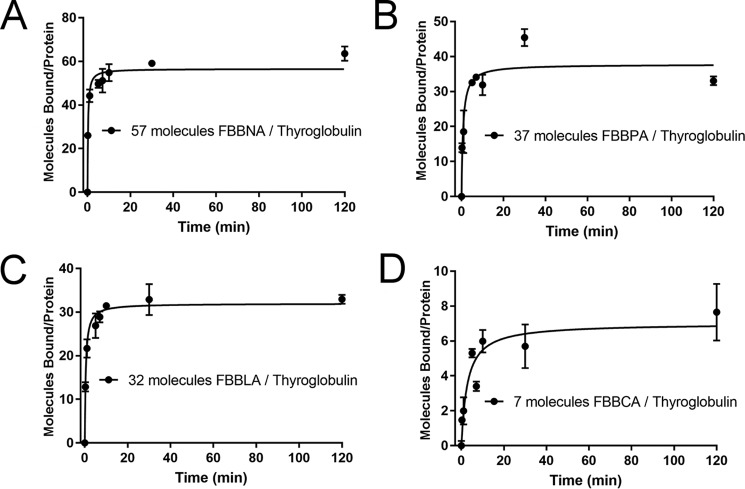
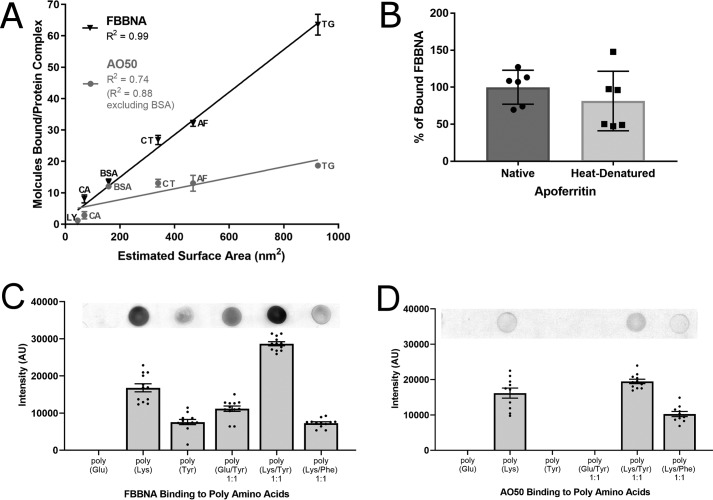
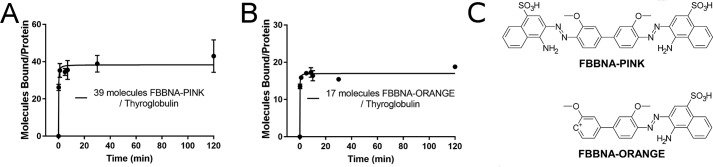
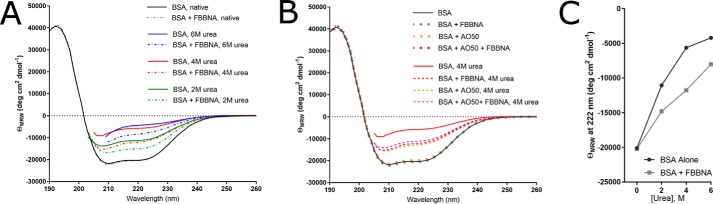
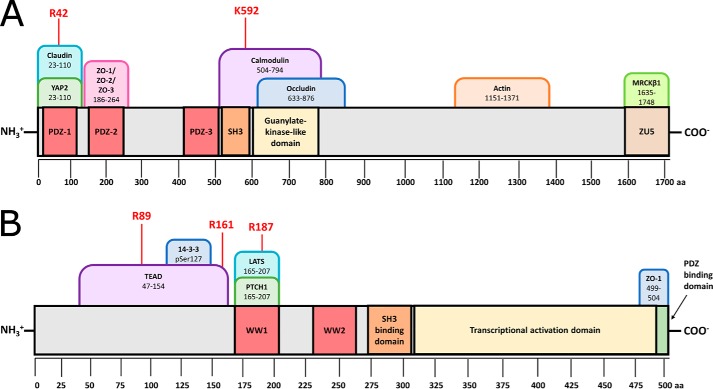
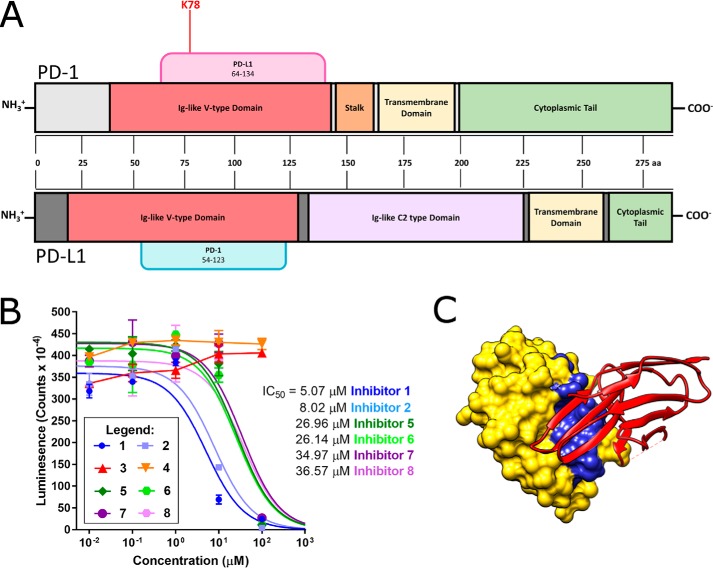
Protein-protein interactions lie at the heart of many biological processes and therefore represent promising drug targets. Despite this opportunity, identification of protein-protein interfaces remains challenging. We have previously developed a method that relies on coating protein surfaces with small-molecule dyes to discriminate between solvent-accessible protein surfaces and hidden interface regions. Dye-bound, solvent-accessible protein regions resist trypsin digestion, whereas hidden interface regions are revealed by denaturation and sequenced by MS. The small-molecule dyes bind promiscuously and with high affinity, but their binding mechanism is unknown. Here, we report on the optimization of a novel dye probe used in protein painting, Fast Blue B + naphthionic acid, and show that its affinity for proteins strongly depends on hydrophobic moieties that we call here "hydrophobic clamps." We demonstrate the utility of this probe by sequencing the protein-protein interaction regions between the Hippo pathway protein Yes-associated protein 2 (YAP2) and tight junction protein 1 (TJP1 or ZO-1), uncovering interactions via the known binding domain as well as ZO-1's MAGUK domain and YAP's N-terminal proline-rich domain. Additionally, we demonstrate how residues predicted by protein painting are present exclusively in the complex interface and how these residues may guide the development of peptide inhibitors using a case study of programmed cell death protein 1 (PD-1) and programmed cell death 1 ligand 1 (PD-L1). Inhibitors designed around the PD-1/PD-L1 interface regions identified via protein painting effectively disrupted complex formation, with the most potent inhibitor having an IC50 of 5 μm.

Keywords: PD-L1; Yes-associated protein (YAP); ZO-1; cell signaling; immune checkpoint inhibitor; mass spectrometry (MS); programmed cell death protein 1 (PD-1); protein painting; protein-protein interaction; structural biology.


Conflict of interest statement

The authors declare that they have no conflicts of interest with the contents of this article

Figures

Figure 1.
Figure 1.
Protein painting methods reveal protein–protein interaction hot spots by blocking tryptic cleavage sites at noninterface regions using molecular dyes. A, preformed protein complexes are pulsed with a great molar excess of small-molecule dyes. These dyes cover solvent-accessible surface regions of the protein complex but cannot bind to the solvent-inaccessible interface regions. After the dye pulse, unbound dye is removed via gel filtration. B, denaturation of the complex reveals the interface regions of the proteins that were previously solvent-inaccessible. Trypsin cleavage of arginine or lysine residues that are not dye-bound (such as Lys-78 of PD-1) yields tryptic peptides that are sequenced by subsequent MS. Those peptides that are exclusively found in samples consisting of a painted complex and absent in samples consisting of a painted individual protein are identified as hot spots of interaction.
Figure 2.
Figure 2.
Binding of commercially available molecular dyes reveals differences between dye classes. A, structure of commercially available dyes DB199, AO50, and TB. B, DB199 binds to thyroglobulin, but not to lysozyme. Binding to thyroglobulin in the absence of CuSO4 (15 molecules at equilibrium) is not significantly greater than binding in the presence of CuSO4 (16 molecules at equilibrium) in a competition assay, indicating the copper ion of DB199 is not primarily responsible for binding affinity. Because the copper moiety of phthalocyanine dyes has been shown to be essential for binding to carbohydrates, lack of involvement suggests that binding to proteins occurs through different mechanisms than binding to carbohydrates. C, Acid Orange 50 binds to both thyroglobulin (15 molecules at equilibrium) and lysozyme (one molecule at equilibrium). D, trypan blue binds to thyroglobulin, but not to lysozyme. Binding of trypan blue (three molecules at equilibrium) is reduced compared with either DB199 or AO50. All data points were collected in duplicate, and final data were fit to the Michaelis–Menten equation, where Vmax represents the maximum number of bound dye molecules per protein molecule at equilibrium. Error bars, S.D.
Figure 3.
Figure 3.
Binding of candidate dyes FBBNA and FBBHA reveals significant difference in binding based on hydrophobicity. A, binding of FBBNA to thyroglobulin shows an average of 57 molecules bound to each thyroglobulin molecule at equilibrium. B, binding of FBBHA to thyroglobulin shows an average of six molecules bound to each thyroglobulin molecule at equilibrium, roughly 10 times fewer than FBBNA. All data points were collected in duplicate and fit to the Michaelis–Menten equation, where Vmax represents the maximum number of bound dye molecules per protein molecule at equilibrium. Error bars, S.D.
Figure 4.
Figure 4.
Binding of candidate dye FBBNA compared with FBBPA, FBBLA, and FBBCA reveals the importance of the hydrophobic anchor region. As the hydrophobic portion of each coupling agent is reduced, the number of bound molecules of the corresponding dye is reduced. All data points were collected in duplicate and fit to the Michaelis–Menten equation, where Vmax represents maximum number of bound molecules at equilibrium. FBBNA had the highest number of molecules bound at equilibrium of the four candidate dyes tested. A, binding of FBBNA to thyroglobulin shows an average of 57 molecules bound to each thyroglobulin molecule at equilibrium, as determined previously and shown in Fig. 3A. The graph is reproduced in this figure for direct comparison with B, C, and D. B, binding of FBBPA to thyroglobulin shows an average of 37 molecules bound to each thyroglobulin molecule at equilibrium. C, binding of FBBLA to thyroglobulin shows an average of 32 molecules bound to each thyroglobulin molecule at equilibrium. D, binding of FBBCA to thyroglobulin shows an average of seven molecules bound to each thyroglobulin molecule at equilibrium. Error bars, S.D.
Figure 5.
Figure 5.
FBBNA binds to multiple different proteins in a surface area–dependent manner, remains significantly bound even after heat treatment, and binds to tyrosine residues in the absence of other positively charged residues. A, FBBNA binds to multiple proteins in a surface area–dependent manner (R2 = 0.99). Proteins examined include lysozyme (LY), carbonic anhydrase (CA), BSA, catalase (CT), apoferritin (AF), and thyroglobulin (TG) as described in Table 3. Number of bound FBBNA molecules is not significantly affected by the presence of glycosylation (thyroglobulin) or metallo-binding prosthetic groups (catalase) for this sample set. The number of bound AO50 molecules was not as highly correlated with surface area (R2 = 0.74) as FBBNA, with a particularly high number of AO50 molecules binding to BSA. Except for BSA and lysozyme, FBBNA bound in higher numbers to the proteins tested than did AO50. B, the percentage of FBBNA dye bound to apoferritin decreased only slightly upon heating at 100 °C for 10 min. Dye was allowed to bind to apoferritin, excess dye was removed by gel filtration, and then native samples were incubated at room temperature for 10 min, whereas heat denatured samples were incubated at 100 °C for 10 min. Samples were subsequently passed through a second gel filtration column, and binding was compared. C, FBBNA dot-blot dye binding to poly-amino acids reveals that FBBNA has affinity not only for positively charged samples, but also for poly-Tyr as well as poly-Tyr/Glu, emphasizing the importance of non-salt-bridge interactions. Each bar represents the spot intensity for 12 individual spots as calculated by ImageJ, with one sample dot blot shown for reference. D, AO50 dot-blot dye binding to poly-amino acids reveals that AO50 has affinity only for poly-amino acid samples that contain positively charged residues, suggesting that salt bridge formation is essential for AO50 binding. Each bar represents the spot intensity for 12 individual spots as calculated by ImageJ, with one sample dot blot shown for reference. Error bars, S.D.
Figure 6.
Figure 6.
Binding of each component of candidate dye FBBNA reveals that >50% of binding is attributable to the hydrophobic anchor region. A, a total of 48 molecules of the high-retention factor component of FBBNA, pink in color, bound to each molecule of thyroglobulin. B, a total of 14 molecules of the low-retention factor component of FBBNA, orange in color, bound to each molecule of thyroglobulin. C, structures of FBBNA-PINK and FBBNA-ORANGE reveal that FBBNA-ORANGE has one fewer coupling agent than FBBNA-PINK. Error bars, S.D.
Figure 7.
Figure 7.
CD spectroscopy of BSA in the presence of molecular dyes shows stabilizing effect of FBBNA and AO50 in the presence of chaotropic agent urea. A, native secondary structure of BSA (black solid line) does not change in the presence of FBBNA dye (gray dashed line). Denaturation at 2 m (green solid line), 4 m (red solid line), and 6 m (blue solid line) is attenuated in the presence of FBBNA at 2 m (green dashed line), 4 m (red dashed line), and 6 m (blue dashed line) as measured by an increase in helical content of the CD spectra. B, native secondary structure of BSA (black solid line) does not change in the presence of AO50 dye (orange dotted line) or the combination of AO50 and FBBNA (purple dotted line). Denaturation by 4 m urea is attenuated by FBBNA (red dashed line), AO50 (orange dashed line), and FBBNA + AO50 (purple dashed line) as compared with BSA denatured without dye (red solid line). C, mean residue ellipticity at 222 nm was greater for BSA in the presence of FBBNA dye as compared with BSA alone at all urea concentrations tested. The greatest difference in magnitude was observed at 4 m urea.
Figure 8.
Figure 8.
Hot spots identified in the ZO-1/YAP2 complex by protein painting include sites both within the canonical binding site and in novel interacting domains. A, ZO-1 is shown in light gray with PDZ domains highlighted red, SH3 domain highlighted orange, guanylate kinase-like domain highlighted in yellow, and ZU5 domain highlighted in brown. A selection of known binding partners are shown as tabs above the structure, with their binding regions given as amino acid positions in ZO-1. All hot spots, given in red, were identified in three independent protein-painting experiments. Arg-42 is a hot spot in the known binding site. B, YAP2 is shown in gray with WW domains highlighted red, SH3-binding domain highlighted orange, transcriptional activation domain highlighted in yellow, and PDZ-binding domain highlighted in green. A selection of known binding partners are shown as tabs above the structure with their binding regions given as amino acid positions in YAP2. All hot spots were identified in three independent protein-painting experiments and were found in the N-terminal proline-rich domain.
Figure 9.
Figure 9.
Hot spot in the PD-1/PD-L1 complex as identified by protein painting falls in the crystallographic binding site, and inhibitors designed around this hot spot disrupt complex formation. A, PD-1 is shown in light gray at the top, whereas PD-L1 is shown in dark gray at the bottom. Domains are marked directly on the protein. Known binding partners are shown as tabs above the structure with their binding regions given as amino acid positions. All hot spots were identified in three independent protein-painting experiments. B, inhibitors 1–8 were tested over a concentration range of 10 nm to 100 μm for inhibition of protein–protein interactions between PD-1 and PD-L1. The most effective inhibitors were 1 and 2, designed to mimic PD-L1, and had IC50 values < 10 μm. All data points were collected in duplicate, and data were fit to a sigmoidal dose–response curve with the following constraint: baseline ≥ 0. C, crystal structure of human PD-1/PD-L1 complex, PDB 4ZQK, where PD-L1 is shown using a space-filling model in yellow and PD-1 is shown using a ribbon model in red. The residues of Inhibitor 1, based on the PD-L1 interface sequence, are shown in blue at the interface of the two proteins. Error bars, S.D.

References

    1. Scott D. E., Bayly A. R., Abell C., and Skidmore J. (2016) Small molecules, big targets: drug discovery faces the protein–protein interaction challenge. Nat. Rev. Drug Discov. 15, 533–550 10.1038/nrd.2016.29 - DOI - PubMed
    1. Kobe B., Guncar G., Buchholz R., Huber T., Maco B., Cowieson N., Martin J. L., Marfori M., and Forwood J. K. (2008) Crystallography and protein–protein interactions: biological interfaces and crystal contacts. Biochem. Soc. Trans. 36, 1438–1441 10.1042/BST0361438 - DOI - PubMed
    1. Weiss G. A., Watanabe C. K., Zhong A., Goddard A., and Sidhu S. S. (2000) Rapid mapping of protein functional epitopes by combinatorial alanine scanning. Proc. Natl. Acad. Sci. U.S.A. 97, 8950–8954 10.1073/pnas.160252097 - DOI - PMC - PubMed
    1. Dailing A., Luchini A., and Liotta L. (2015) Unlocking the secrets to protein-protein interface drug targets using structural mass spectrometry techniques. Expert Rev. Proteomics 12, 457–467 10.1586/14789450.2015.1079487 - DOI - PMC - PubMed
    1. Luchini A., Espina V., and Liotta L. A. (2014) Protein painting reveals solvent-excluded drug targets hidden within native protein-protein interfaces. Nat. Commun. 5, 4413 10.1038/ncomms5413 - DOI - PMC - PubMed

Publication types

MeSH terms