. 2019 Jun 5;2(3):e201800287.
doi: 10.26508/lsa.201800287. Print 2019 Jun.

The WT1-BASP1 complex is required to maintain the differentiated state of taste receptor cells

Affiliations

The WT1-BASP1 complex is required to maintain the differentiated state of taste receptor cells

Yankun Gao et al. Life Sci Alliance. .

Abstract

WT1 is a transcriptional activator that controls the boundary between multipotency and differentiation. The transcriptional cofactor BASP1 binds to WT1, forming a transcriptional repressor complex that drives differentiation in cultured cells; however, this proposed mechanism has not been demonstrated in vivo. We used the peripheral taste system as a model to determine how BASP1 regulates the function of WT1. During development, WT1 is highly expressed in the developing taste cells while BASP1 is absent. By the end of development, BASP1 and WT1 are co-expressed in taste cells, where they both occupy the promoter of WT1 target genes. Using a conditional BASP1 mouse, we demonstrate that BASP1 is critical to maintain the differentiated state of adult taste cells and that loss of BASP1 expression significantly alters the composition and function of these cells. This includes the de-repression of WT1-dependent target genes from the Wnt and Shh pathways that are normally only transcriptionally activated by WT1 in the undifferentiated taste cells. Our results uncover a central role for the WT1-BASP1 complex in maintaining cell differentiation in vivo.


Conflict of interest statement

The authors declare that they have no conflict of interest.

Figures

Figure 1.
Figure 1.. BASP1 is expressed at the terminal stages of CV development.
(A) Immunohistochemistry of CV at different stages of development (indicated at right). BASP1 is red and Krt8 is green, and merged image is shown. DIC is shown at the left. Adult mice are at least 30 d post birth. (B) As in part (A) except that BASP1 (red) and GAP43 (green) were detected. For all images, a stack of five slices (1 μm each) is shown. Scale bar is 50 μm.
Figure S1.
Figure S1.. Secondary antibody control experiments
(A, B) No primary controls in (A) developing (E15.5) and (B) adult taste cells for secondary antibodies with either 488 or 594 fluorophores. Scale bar is 50 μm.
Figure 2.
Figure 2.. WT1 and BASP1 are expressed in overlapping cell types of the adult CV.
(A) Diagram of CV papillae showing the taste buds (comprising 50–150 cells) and innervation by the gustatory nerve. A single bud is shown at right containing the differentiated type I, II, and III cells, and the precursor K14+ and Shh+ cells. (B) WT1 and BASP1 are expressed in adult taste buds. Immunohistochemistry of CV papillae to detect BASP1 (red) and WT1 (green) with merged image. Scale bar is 50 μm. (C) Nuclear and cytoplasmic localization of WT1 and BASP1. BASP1 (top) and WT1 (bottom) are shown merged with DAPI staining. Scale bar is 50 μm. (D) Immunohistochemistry of CV taste buds to detect BASP1 (red) and either NTPDase2 (green; type I cells), PLCβ2 (green; type II cells) or NCAM (green; type III cells). DIC images are shown to the left of each with merged images of the labelling shown at right. Scale bar is 50 μm for each. (E) As in part (D) except that WT1 (red) was detected instead of BASP1. (F) Left panels: immunohistochemistry of CV taste buds to detect WT1 (red) and Krt14 (green). Merged image is shown at the bottom. Right panels: immunohistochemistry of CV taste buds to detect BASP1 (red) and Shh (green). Merged image is shown at bottom right. Scale bar is 10 μm for WT1 and 50 μm for BASP1. (G) As in part (D) except that Shh (green) was detected instead of Krt14. Scale bar is 10 μm. For all images, a stack of five slices (1 μm each) is shown.
Figure S2.
Figure S2.. Strategy for producing a floxed BASP1 mouse.
The mouse Basp1 gene (GenBank accession number: NM_027395.2, Ensembl: ENSMUSG00000045763) is located on mouse chromosome 15 and contains two exons. (A) Because all the coding region for BASP1 is located solely in exon 2, it was targeted as the conditional knockout region. Deletion of exon 2 results in the total loss of Basp1 protein. To engineer the targeting vector, homology arms and CKO region were generated by PCR using BAC clone RP23-209B5 or RP23-334N16 from the C57BL/6J library as template. In the targeting vector, the neo cassette was flanked by Frt sites and CKO region was flanked by LoxP sites. The conditional KO allele was obtained after Flp-mediated recombination and the constitutive KO allele is then obtained after Cre-mediated recombination. C57BL/6 ES cells were used for gene targeting. Primer-annealing sites are indicated in the diagrams. (B) Eight mice with BASP1 and Krt8-CRE genotypes indicated are analyzed. The upper gel is a compilation of homozygous floxed mice, heterozygous floxed mice, and wild-type (nonfloxed) mice. The floxed band generated by F2/R2 primers is present at 467 bp, whereas the wild type allele is 367 bp. The lower gel identifies mice containing Krt8-Cre. (C) Before tamoxifen treatment, wild-type and KO mice have either the 467 bp (floxed mouse) or the 345 bp band (wild-type) with F2/R2 primers. After tamoxifen treatment, primers specific to the resulting floxed site that is deleted of BASP1 produces a 271-bp band.
Figure 3.
Figure 3.. Knockout of BASP1 in the adult CV affects the stimulus responses of taste cells.
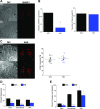
(A) Immunohistochemistry of CV papillae to detect BASP1 (red) in control (CTL) and Krt8-BASP1-CRE (KO) mice treated with tamoxifen. Scale bar is 50 μm. (B) Left graph: qPCR was used to determine BASP1 expression relative to GAPDH in RNA isolated from CTL (black bar) and KO (blue bar, KO) mice (*P < 0.05). Right graph: taste buds were stained with DAPI and the number of cells per bud were counted in CTL and KO mice (n = 3 mice, seven buds per mouse for each). Mean with SD are reported. (C) As in part (A) except that staining was with anti-Krt8. At right is the quantitation of immunoreactivity per taste bud using ImageJ. Horizontal bars represent mean average intensity. For all images, a stack of five slices (1 μm each) is shown. (D) Chi-square analysis compared the overall number of responsive taste cells in CTL and KO mice. The percentage of responsive taste cells is shown (***P < 0.001; **P < 0.01; *P < 0.05) for 5 mM denatonium (CTL: n = 150 cells, five mice; KO: n = 145 cells, three mice), 20 mM sucralose (CTL: n = 150 cells, five mice; KO: n = 145 cells, three mice), and 50 mM potassium chloride (HiK) (CTL: n = 135 cells, five mice: KO: n = 129 cells, three mice). (E) The response amplitudes (percent increase over baseline) for the responsive cells from part (D) were analyzed and compared for the CTL and KO mice. Mean with SD are reported along with a t test (***P < 0.001 and **P < 0.01). Representative traces are shown in Fig S3.
Figure S3.
Figure S3.. Reduced taste-evoked response of CV cells in the absence of BASP1.
Isolated taste cells from control mice (CTL) or Krt8-BASP1-KO mice were subjected to the stimuli indicated and calcium release measured by Fura2 imaging. Representative plots for each stimulus are shown.
Figure 4.
Figure 4.. Knockout of BASP1 in the adult CV leads to a disruption of type II and type III cells markers.
(A) Immunohistochemistry of CV taste buds using anti-BASP1 (red) in CTL and KO mice that had been treated with tamoxifen. Scale bar is 50 μm. (B) As in part (A) except that NTPDase2 (type I marker) was tested. A plot of signal intensity per taste bud is shown at right. Horizontal bars represent mean intensity (***P < 0.001 t test). (C) As in part (A) except that anti-PLCβ2 (type II marker) was used. A plot of signal intensity per taste bud is shown below. Horizontal bars represent mean intensity (***P < 0.001 t test). (D) As in part (A) except that NCAM labelling (type III marker) was measured. A plot of signal intensity per taste bud is shown below. Horizontal bars represent mean intensity (***P < 0.001 t test). For all images, a stack of five slices (1 μm each) is shown. (E) The number of PLCβ2− (above) and NCAM− (below) positive cells per taste bud in CTL and KO cells is shown. Seven buds from three mice for CTL and KO were analyzed for each antibody. Error bars are SD of the mean.
Figure S4.
Figure S4.. Some cell type markers were not affected by the loss of BASP1 expression in K8+ cells.
(A) Immunohistochemistry of CV taste buds to detect gustducin (red) in control (WT) mice and Krt8-BASP1-CRE (KO) mice treated with tamoxifen for 7 d. Scale bar is 10 μm. (B) A plot of gustducin signal intensity per taste bud in control (CTL) and Krt8-BASP1-CRE mice is shown. Horizontal bars represent mean intensity with P-value (t test). (C) Immunohistochemistry of CV taste buds to detect PGP9.5 (red) in control (WT) mice and Krt8-BASP1-CRE (KO) mice treated with tamoxifen for 7 d. Scale bar is 10 μm. (D) A plot of PGP9.5 signal intensity per taste bud in control (CTL) and Krt8-BASP1-CRE mice is shown. Horizontal bars represent mean intensity with P-value (t test).
Figure 5.
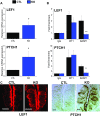
Figure 5.. The WT1–BASP1 complex represses LEF1 and PTCH1 expression in the differentiated cells of the CV.
(A) Quantitative PCR (qPCR) was used to detect LEF1 (above) and PTCH1 (below) expression relative to GAPDH in mRNA isolated from taste cells of CTL and KO mice. Means (of three independent experiments) with SD are reported (*P < 0.05, t test). (B) ChIP analysis of isolated taste cells from adult mice. WT1, BASP1, or control (IgG) antibodies were used. After normalization to input DNA, fold enrichment at the LEF1 (top) or PTCH1 (bottom) promoter regions over a control genomic region is shown in CTL and KO mice. Mean (of three independent experiments) with SD are reported (*P < 0.05, ***P < 0.001; t test). (C) Immunohistochemical analysis of LEF1 expression in the CV of CTL or KO mice (left panels). Expression levels of PTCH1 in the CV of CTL or KO mice (right panels). Scale bar is 20 μm.

References

    1. Barlow LA. (2015) Progress and renewal in gustation: New insights into taste bud development. Development 142: 3620–3629. 10.1242/dev.120394 - DOI - PMC - PubMed
    1. Barlow LA, Klein OD (2015) Developing and regenerating a sense of taste. Curr Top Dev Biol 111: 401–419. 10.1016/bs.ctdb.2014.11.012 - DOI - PMC - PubMed
    1. Blanchard JW, Xie J, El-Mecharrafie N, Gross S, Lee S, Lerner RA, Baldwin KK (2017) Replacing reprogramming factors with antibodies selected from combinatorial antibody libraries. Nat Biotechnol 35: 960–968. 10.1038/nbt.3963 - DOI - PubMed
    1. Castillo D, Seidel K, Salcedo E, Ahn C, de Sauvage FJ, Klein OD, Barlow LA (2014) Induction of ectopic taste buds by SHH reveals the competency and plasticity of adult lingual epithelium. Development 141: 2993–3002. 10.1242/dev.107631 - DOI - PMC - PubMed
    1. Chau YY, Brownstein D, Mjoseng H, Lee WC, Buza-Vidas N, Nerlov C, Jacobsen SE, Perry P, Berry R, Thornburn A, et al. (2011) Acute multiple organ failure in adult mice deleted for the developmental regulator Wt1. PLoS Genet 7: e1002404 10.1371/journal.pgen.1002404 - DOI - PMC - PubMed

Publication types

MeSH terms

LinkOut - more resources